


 Inglés (pdf)
 Articulo en XML
 Referencias del artículo
 Enviar articulo por email
 Citado por SciELO
  Citado por Google
  Similares en
SciELO
Similares en
SciELO  Similares en Google
 Permalink
I. INTRODUCTION
Internet of Things (IoT) can be defined as the integration of sensors and devices to objects in the physical world, which are connected to the Internet through a network connection, to exchange data, share resources, recognize events and react autonomously and appropriately [1]-[4]. Similarly, IoT can be considered as a technological framework that leverages the availability of heterogeneous devices and interconnection solutions, as well as physical objects that provide a shared information base on a global scale, to support the design of applications that involve both people and object representations at the same virtual level [5]. IoT is currently considered one of the pillars of Industry 4.0 and has generated impact, revolution and transformation in different application contexts, such as: monitoring of environmental variables, precision agriculture, health, industry, and education, among others [6]-[10].
Based on the above, in the particular context of health, the implementation of IoT through different sensors allows constant monitoring and control of patients, considering that there are several diseases whose symptoms are silent. Therefore, their early diagnosis would allow prevention and possible solutions to these diseases that can be fatal [11], [12]. On the other hand, in an industry as competitive as the sports industry, any small detail in the training process can make a difference. In this sense, the data obtained from sensors or commercial devices for monitoring and analyzing the performance of athletes provide an extra competitive advantage that can be differential. Thus, the variety of data that can be obtained from them and the speed at which they can be processed generates a great potential for athletes, coaches and trainers, who can take advantage of these techniques and technologies to improve their skills, training and results [13], [14].
A series of techno-complements called commercial wearable devices have been developed to obtain physiological variables, which monitor geolocation, as well as heart rate, calorie consumption, sleep patterns and other biological data [3], [15]-[19]. Despite the advantages of these devices in terms of capture and accuracy of physiological variables, they have limited storage and processing capacity, which makes it difficult to apply data analysis techniques and, therefore, to obtain value-added information from the captured data [6]. Based on the above, there is a need to include and take advantage of the benefits provided by these devices within hardware-software systems that enable the capture, storage, analysis and visualization of the variables of interest [20], which contribute to improving the training techniques used by sports coaches, in order to obtain better results in terms of the individual performance of each athlete.
At the IoT level, several works have been carried out related to monitoring physiological variables in the context of health and sport. Thus, [21] proposes a hardware-software system based on Libelium's eHealth kit and free hardware boards, which allows real-time monitoring of heart rate and obtaining statistics associated with this variable in patients with cardiovascular problems. In [22], a mobile health application called SIPS is proposed, which allows the detection of injury risk in athletes in school and amateur programs, as well as the measurement of the neuro-mechanical response capacity of an athlete through the use of monitoring devices connected via Bluetooth, having as a future challenge the inclusion of data analytics models. In [23], an IoT system for monitoring physiological signals for emergency management in road safety is presented, which consists of a monitoring module located on the bicycle and the cyclist's clothing so that when detecting out-of-range changes in physiological signals, an SMS message is sent to a web server. In [24], the development of a system for monitoring and alert generation focused on athletes is presented, which makes use of a smart band to obtain physiological variables such as heart rate, body temperature, distance traveled, accelerometer, pedometer, among others, so that when an abnormal value is detected in these variables, an alert appears in the mobile device. In [25], the development of an expert system was proposed, which makes it possible to establish the maximum heart rate in terms of percentage of intensity, duration of a training session and frequency in days per week in order to determine risk factors in athletes making use of data mining. In [26], an embedded system based on an Arduino board, a heart rate sensor, and an LCD display were presented, which allows the monitoring of heart rate and the identification of cardiac conditions such as bradycardia or tachycardia from the analysis based on descriptive statistics on data captured over a period of time. In [27], the design and implementation of an IoT system for home telemonitoring for the elderly was proposed, which captures data associated with the physiological variables of patients using sensors and sends them through the network to be displayed in a web application so that the system is articulated in a 3-layer architecture: capture, storage, and visualization, having as a challenge the inclusion of data analytics models. In [28], the development of an IoT-based architecture for the monitoring and analysis of physiological variables in patients, based on the use of commercial wearable devices, was presented, which is articulated in the IoT four-layer architecture (capture, storage, analysis, and visualization) and was validated through an IoT oximeter prototype. In [29], an IoT platform for remote monitoring of non-communicable diseases in China called eBPlatform was proposed, which captures variables of interest (blood pressure, blood sugar level, and heart rate) and sends them to a server in the cloud to be analyzed by experts, so that the platform is articulated in a 3-layer architecture: sensors, data processing, and applications, having as a challenge the inclusion of data analytics models.
Through the previous works, it is possible to observe the different potentialities of the IoT in the deployment of solutions for problems associated with health and sport. It is possible to appreciate that although most of the described works enable the monitoring and visualization of variables of interest from free hardware devices, they have the challenge of linking commercial capture devices, as well as the inclusion of a data analysis layer to apply machine learning models. In this article, we propose the development of an IoT system for monitoring and analysing heart rate and heart rate variability in athletes, which was validated in the sports school "Los Cracks" in the city of Cartagena de Indias, Colombia. The proposed IoT system is framed in the four-layer architecture (data capture, storage, processing, and visualization) or also known as Lambda architecture [30]-[34]. The capture layer contains the different sensors and commercial technologies that allow the acquisition of the different physiological variables of the athletes: heart rate (HR), heart rate variability (HRV), etc. In the storage layer, the different variables captured are stored using a session identifier in non-relational databases. In the processing or analysis layer, descriptive statistics and machine learning methods are applied to analyse the capture sessions using free software technologies and libraries. Finally, in the visualization layer, the end user can visualize the real-time monitoring of the variables and the results of the application of the statistical and machine learning models. Thus, the proposed system has the advantage of combining commercial devices with free software tools to monitor, analyze, and visualize heart rate variables and heart rate variability in athletes. The IoT system proposed in this article is intended to serve as a reference to be extrapolated and customized from the technologies associated with the different layers of the architecture in other contexts related to health and sport.
The article is organized as follows: Section II presents the methodological phases used for the development of this research; Section III describes the results obtained during the development of this work, which includes the design and implementation of the proposed IoT system, as well as a case study in which the system was validated; finally, Section IV presents the conclusions and future work derived from this research.
II. METHODOLOGY
For the development of this work, three methodological phases were defined: selection of techniques and technologies, design and implementation of the IoT system, and case study (Fig. 1).
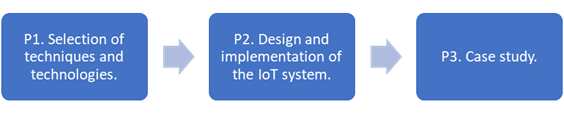
In phase 1 of the methodology, different techniques and technologies were explored to select the most appropriate for the conformation of the four layers (capture, storage, processing, and visualization) of the IoT system architecture for monitoring and analysing physiological variables in athletes. In phase 2, the tasks of design, coding and implementation of the IoT system were developed, taking into account the layers of the conventional IoT architecture and the techniques and technologies explored and selected. Finally, in phase 3, the IoT system was validated through a case study developed in the sports school "Los Cracks" in the city of Cartagena de Indias, with a total of 10 athletes. This case study made it possible to verify the system's operation and its usefulness in obtaining indicators in sports training for decision-making processes.
III. RESULTS
This section presents the design, implementation and validation of the IoT system for monitoring and analysing physiological variables in athletes.
A. IoT System Design
For constructing the proposed IoT system, the parameters represented in Table I were considered, which correspond to statistical methods in the time domain associated with heart rate variability [35]-[37]. Likewise, Table I shows the relationship of these metrics with cardiovascular risk levels (high, low, moderate), as proposed in [38]. Among the parameters considered are: average RR intervals, standard deviation of RR intervals (SDRR), percentage of differences larger than 50 milliseconds in consecutive RR intervals (pRR50), and standard deviation of RR intervals averaged over 5-minute periods (SDARR).
Table 1 References for statistical parameters in the time domain.
| Parameter | Risk Levels |
|---|---|
| Average RR | RR < 750 ms => High risk RR 750-900 ms => Moderate risk RR > 900 ms => Low risk |
| SDRR | SDRR < 50 ms => High risk SDRR 50-100 ms => Moderate risk SDRR > 100 ms => Low risk |
| pRR50 | pRR50 < 3% => High risk pRR50>= 3% => Low risk |
| SDARR | SDARR < 8 ms => High risk SDARR 8-12 ms => Moderate risk SDARR> 12 ms => Low risk |
The proposed IoT system has been specified in two architectural views, namely functional view and implementation view, each of them is made up of the four layers of the conventional IoT architecture, also known as Lambda Architecture. These layers were defined considering what was proposed in [39]. Based on the above, Fig. 2 presents the functional view of the implemented IoT system, which comprises the functional blocks or processes that make up the four layers of the architecture.
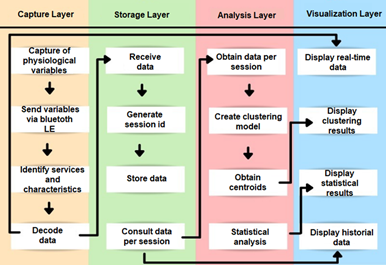
In the capture layer, the heart rate (HR) and heart rate variability (HRV or HRV) are obtained from a wearable device incorporated in the athlete's chest, which, once obtained, are sent through the Bluetooth LE wireless communication protocol to the backend of the system. At the storage layer, once the data is obtained through asynchronous requests, it is decoded from the data frame (hexadecimal format) and stored via a session id in a non-relational database. In the analysis layer, both analyses based on descriptive statistics from historical data and analyses based on the application of unsupervised learning models (clustering) using machine learning libraries are performed. Clustering models were chosen, considering that they allow obtaining clusters with an associated centroid, which makes it possible to appreciate more clearly the distribution of the data captured around the risk levels. Finally, in the visualization layer, it is possible to perform graphic monitoring of the variables obtained in the capture layer. Similarly, in this layer, the results of the statistical analysis are presented, as well as the results of the execution of the clustering models on the historical data per session.
On the other hand, Fig. 3 shows the diagram illustrating the implementation view of the IoT architecture of the proposed system. This view presents a set of techniques and technologies associated with each layer, which seek to fulfill the processes described in the functional view of the system architecture, presented in Fig. 2.
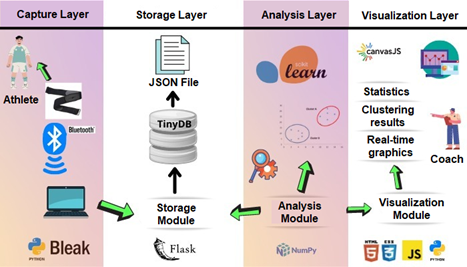
In the capture layer, using a commercial wearable device (Magene H64 pectoral band), HR and HRV are obtained and sent to the system's backend using the Bluetooth LE protocol. In the backend, using Bluetooth adapters or internal hardware, the connection to the chest band is made using the service id and the features available on the device. In order to make the connection to the pectoral band, the Python bleak library was used, which allows asynchronous connection to wearable devices from the Windows and Linux operating systems. Once the data is obtained and decoded, it is stored in the non-relational database TinyDB through the storage module using a capture session id. In the analysis layer, the analysis module loads the data from the different sessions of the TinyDB database to process them using descriptive statistics (average and standard deviation of the variables) and unsupervised learning models or clustering. The clustering models are developed using the Python library scikit-learn, which allows the implementation of the K-Means algorithm. This algorithm makes it possible to form groups of data, each of which has an associated centroid around which the data in each group is concentrated. Finally, in the visualization layer, using the JavaScript CanvasJS libraries, the charts with the fluctuation of the physiological variables in real time are presented, as well as the historical data and the results of the application of the analysis models.
B. IoT System Implementation
Based on the architectural views defined in the previous section, Fig. 4 shows the main interface of the system implemented through a web application developed using the Python Flask framework. As shown in Fig. 4, the implemented system consists of 6 tabs: "Scan", "Database", "Session", "Statistics", "Model 1" and "Model 2".
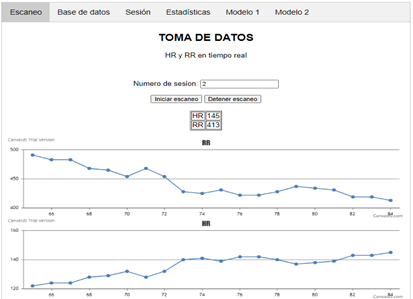
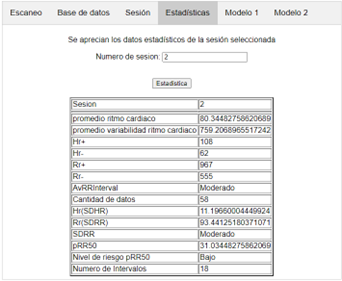
The "Scan" tab allows displaying capture data graphically and in real-time. In the "Databases" and "Session" tabs, it is possible to consult the data history or the specific data of a capture session, respectively. In the "Statistics" tab, the results of the statistical analysis of the capture session data are displayed. Finally, the "Model 1" and "Model 2" tabs present the results of applying the defined clustering models. Thus, in the first instance, the "Scan" tab displays two buttons that allow to start or stop the capture of data from the chest band. Thus, by pressing the "Start Scan" button and using the CanvasJS library, it is possible to visualize in real time the fluctuation of the HR and HRV variables as a function of time. At the same time that the capture data is presented on the screen, it is stored in the non-relational database TinyDB. Each set of captures is associated with a session id and a time stamp corresponding to the time at which the HR and HRV data were captured. In the same way, the captures stored in the database can be consulted in the visualization layer through the "Database" and "Session" tabs. In addition, in the "Statistics" tab with the data of each capture session, it is possible to obtain the metrics of Table 1 and the descriptive statistics calculations of the HR and HRV variables. As an example, Fig. 5 shows the statistical calculations and metrics obtained for an example session with id 2 of the database (average HR: 80.3 bpm, RR: 759.2 ms, SDRR: 93.4 ms, and pRR50: 31%). Based on the above, the system obtains as a result for session 2 a moderate risk level for the average RR and the SDRR metric, as well as a low-risk level for the pRR50 metric.
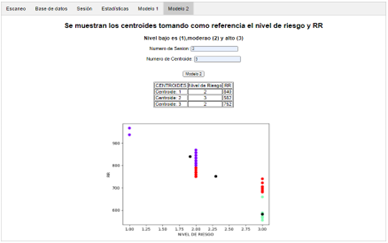
Regarding the analysis layer, within the "Model 1" and "Model 2" tabs of the web application, it is possible to choose the session id and the number of clusters to obtain on the selected session data from the use of the K-Means clustering model, which was implemented using the scikit-learn machine learning library of Python. Clustering "Model 1" obtains n clusters with their associated centroids from the relationship between the HR and RR variables for a particular session, while "Model 2" obtains the clusters and centroids corresponding to the relationship between HRV and risk level (RL) obtained from the metrics defined in Table I for a specific capture session. Thus, as an example, Fig. 6 shows the results generated by applying "Model 2" clustering on the test session with id 2 and 3 clusters, obtaining the following centroids: C1={Risk level (RL): 2, HRV: 840ms}, C2={Risk level (RL): 3, HRV: 582ms}, C3={Risk level (RL): 3, HRV: 752ms}. The clusters (green, red and purple colors) and centroids (black color) can be seen more clearly in the data distribution chart in Fig. 6.
C. Case Study
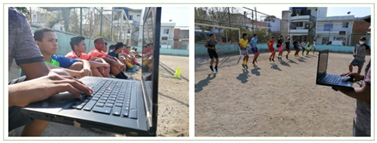
In order to verify the performance and usefulness of the IoT system implemented, a case study was conducted, in which 10 athletes were selected from the soccer school "Los Cracks" of Cartagena (Colombia) belonging to the 2005-2006 category, with an average age of 14.4 years and an average weight of 58.5 kg. The case study data were obtained at rest and during training, within 2 to 5 minutes, as shown in Fig. 7. The category was chosen considering that these athletes are in the process of starting their training, so they have a greater margin for improvement. Therefore, it is possible to identify values outside the range corresponding to high-performance athletes.
Each athlete performed a series of exercises and individual circuits during the training, which generated demand to evaluate their physical conditions from the data captured and analyzed by the IoT system. Table II shows the consolidated values obtained for the different metrics presented in Table I (HR, HRV, SDRR, and PRR50). It is possible to appreciate that HR increases while RR, SDRR, and pRR50 decrease when going from the resting state to the training state, indicating that parameters related to parasympathetic activity tend to reduce while those related to sympathetic activity grow significantly.
Table 2 Athlete statistics at rest and in training.
| Rest | Training | |||||||
|---|---|---|---|---|---|---|---|---|
| Athlete | RR | HR | SDRR | PRR50 | RR | HR | SDRR | PRR50 |
| 1 | 765.0 | 79.0 | 67.0 | 19.0 | 413.7 | 148.4 | 62.3 | 1.3 |
| 2 | 749.2 | 80.3 | 93.4 | 31.0 | 543.8 | 112.7 | 72.7 | 0.6 |
| 3 | 841.8 | 71.8 | 69.7 | 19.7 | 461.4 | 131.4 | 46.8 | 0.7 |
| 4 | 746.0 | 80.7 | 44.0 | 12.9 | 512.5 | 117.5 | 34.6 | 0.6 |
| 5 | 651.0 | 92.8 | 55.1 | 21.2 | 495.8 | 122.2 | 49.0 | 0.6 |
| 6 | 701.7 | 86.1 | 61.3 | 18.2 | 557.6 | 107.8 | 27.0 | 0.6 |
| 7 | 763.9 | 79.8 | 101.3 | 27.4 | 437.5 | 138.2 | 39.7 | 0.7 |
| 8 | 714.5 | 84.8 | 72.9 | 22.3 | 538.5 | 111.5 | 21.4 | 1.4 |
| 9 | 750.7 | 81.0 | 86.4 | 29.0 | 455.6 | 131.8 | 19.8 | 0.6 |
| 10 | 820.5 | 73.8 | 82.0 | 23.4 | 504.2 | 122.6 | 84.1 | 1.3 |
| Avg | 750.4 | 81 | 73.3 | 22.4 | 492 | 124.4 | 45.7 | 0.85 |
According to the data captured in the case study using the IoT system and presented in Table 2, an average VFC value of 750.4 ms, a maximum value of 841.82 ms and a minimum value of 650.96 ms was obtained at rest. Similarly, in training, the average HRV was 492 ms, the maximum value was 557.60 ms, and the minimum value was 413.74 ms. Likewise, at rest, an average HR value of 81 bpm was obtained, as well as a maximum value of 92.77 bpm and a minimum value of 71.75 bpm. Similarly, in training, the average HR was 124.4 bpm, with a maximum value of 148.41 bpm and a minimum value of 107.78 bpm. In addition, the average SDRR at rest was 73.3 ms and during training 45.7 ms, while the average pRR50 at rest was 22.4% and during training 0.85%. When analyzing the above results, it was found that athletes at rest remain within the ranges associated with a moderate or high-risk level, but during training, the HRV indices tend to deviate from the reference standards (see Table 1). This is because the selected athletes are still in the age and category of sporting growth and must adapt to the training loads suggested by their coaches.
On the other hand, regarding the clustering models, Tables 3 and 4 present the results obtained by applying "Model 1" and "Model 2" to the capture sessions of the case study developed with a total of 3 clusters.
Table 3 HR-RR centroids of model 1.
| Rest | Training | |||||||||||
|---|---|---|---|---|---|---|---|---|---|---|---|---|
| C1 | C2 | C3 | C1 | C2 | C3 | |||||||
| Athlete | HR | RR | HR | RR | HR | RR | HR | RR | HR | RR | HR | RR |
| 1 | 70 | 852 | 86 | 696 | 77 | 775 | 182 | 328 | 128 | 466 | 155 | 387 |
| 2 | 71 | 840 | 79 | 752 | 103 | 582 | 102 | 588 | 150 | 398 | 120 | 499 |
| 3 | 65 | 914 | 71 | 834 | 81 | 740 | 122 | 491 | 140 | 427 | 166 | 361 |
| 4 | 76 | 782 | 82 | 728 | 96 | 624 | 118 | 507 | 107 | 555 | 130 | 461 |
| 5 | 92 | 649 | 79 | 752 | 104 | 573 | 112 | 533 | 130 | 461 | 154 | 389 |
| 6 | 77 | 775 | 94 | 636 | 83 | 719 | 108 | 550 | 121 | 496 | 104 | 576 |
| 7 | 66 | 905 | 89 | 668 | 78 | 768 | 156 | 383 | 126 | 472 | 141 | 423 |
| 8 | 86 | 697 | 75 | 791 | 99 | 602 | 112 | 534 | 116 | 514 | 105 | 567 |
| 9 | 80 | 747 | 69 | 863 | 94 | 638 | 125 | 478 | 133 | 450 | 140 | 426 |
| 10 | 81 | 739 | 65 | 914 | 74 | 809 | 102 | 586 | 158 | 379 | 120 | 499 |
| Avg | 76.4 | 790 | 78.9 | 763.4 | 88.9 | 683 | 123.9 | 497.8 | 130.9 | 461.8 | 133.5 | 458.8 |
From what is presented in Table 3 and referring to the results of the application of "Model 1" in the case study, it was obtained that during the resting state the 3 average centroids are: C1= {HR=76.4 ; HRV = 790}, C2 = {HR = 78.9 ; HRV = 763.4}, C3 = {HR = 88.9 ; HRV = 683}, while during the training state the 3 average centroids are: C1 = {HR =123.9 ; HRV = 497.8}, C2 = {HR = 130.9 ; HRV = 461.8}, C3 = {HR = 133.5 ; HRV = 458.8}. In agreement with the statistical data in Table II, it can be noted that the average of the centroids at rest is within the moderate and high-risk levels, while the three centroids are in a high-risk level during training, taking into account the ranges of the statistical parameters described in Table I.
Similarly, as presented in Table 3 and concerning the results obtained by the IoT system in "Model 2", it was necessary to determine for each athlete the cluster with the highest number of instances or also known as the dominant cluster (DC) (see Table 4), considering that the risk level (RL) is categorical so that the analysis using the average does not yield a representative value. From the above, the dominant centroid for each athlete is shown below, along with its associated risk level: athlete 1 = {DC=3, RL=3}, athlete 2 = {DC = 1, RL = 2}, athlete 3 = {DC = 3; RL= 2}, athlete 4 = {DC = 1, RL = 3}, athlete 5 = {DC = 2; RL = 3}, athlete 6 = {DC = 2, RL = 3}, athlete 7 = {DC = 2, RL = 3}, athlete 8 = {DC = 3, RL = 3}, athlete 9 = {DC = 1, RL = 3} and athlete 10 = {DC= 2, RL = 3}. Likewise, during the training period, the level of risk present for each of the centroids of the different players corresponds to level 3 or high.
Table 4 HR-RR centroids of model 2
| Rest | Training | |||||||||||
|---|---|---|---|---|---|---|---|---|---|---|---|---|
| C1 | C2 | C3 | C1 | C2 | C3 | |||||||
| Athlete | RL | RR | RL | RR | RL | RR | RL | RR | NR | RR | NR | RR |
| 1 | 2 | 755 | 2 | 852 | 3 | 696 | 3 | 395 | 3 | 331 | 3 | 468 |
| 2 | 2 | 752 | 3 | 582 | 2 | 840 | 3 | 588 | 3 | 398 | 3 | 499 |
| 3 | 1 | 914 | 3 | 740 | 2 | 834 | 3 | 491 | 3 | 431 | 3 | 365 |
| 4 | 3 | 728 | 3 | 624 | 2 | 782 | 3 | 552 | 3 | 458 | 3 | 505 |
| 5 | 3 | 573 | 3 | 649 | 3 | 152 | 3 | 553 | 3 | 461 | 3 | 389 |
| 6 | 3 | 719 | 3 | 636 | 2 | 775 | 3 | 546 | 3 | 573 | 3 | 496 |
| 7 | 1 | 905 | 3 | 668 | 2 | 768 | 3 | 472 | 3 | 383 | 3 | 423 |
| 8 | 3 | 602 | 2 | 791 | 3 | 697 | 3 | 533 | 3 | 566 | 3 | 514 |
| 9 | 3 | 743 | 2 | 856 | 3 | 638 | 3 | 450 | 3 | 478 | 3 | 426 |
| 10 | 1 | 914 | 3 | 739 | 2 | 809 | 3 | 379 | 3 | 586 | 3 | 499 |
The data corresponding to the number of instances associated with each cluster for each athlete during rest can be seen more clearly in Fig. 8.
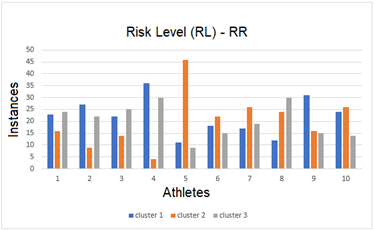
From Table 4 and Fig. 8, it is possible to observe that 80% of the players had a predominance of risk level 3 (high), and the other 20% had a predominance of risk level 2 (moderate) at rest; although the high-risk level was still dominant. Similarly, it can be noticed that the dominant risk level was 3 (high) during the training. In this sense, it is confirmed that the athletes are not yet in the best physical conditions and must adapt to the training loads directed by their coaches since they belong to a category of sports growth, which is in the process of formation in the sports school "Los Cracks".
IV. CONCLUSIONS AND FUTURE WORK
In this paper, we presented as a contribution the development of an IoT system for monitoring and analysing heart rate and heart rate variability in athletes. The proposed system is articulated within the conventional four-layer architecture, considering two architectural views (functional and implementation). One of the main advantages of the system focuses on the use of data from commercial devices for subsequent storage and analysis using unsupervised learning methods or clustering, which allow clearer visualization of the distribution of data in space in order to obtain groups from the data set.
The proposed architecture presents as a contribution the inclusion of commercial devices, together with free software tools, in such a way that the Magene H64 pectoral band was used in the capture layer, from which the data is obtained asynchronously by means of the Bleak Python library via Bluetooth and stored in the free non-relational database TinyDB in the storage layer. Similarly, in the analysis layer, using the advantages provided by the Python libraries scikit-learn, matplotlib, pandas and numpy, supervised learning models were implemented to determine the distribution of the captured data. Finally, the visualization layer makes use of the JavaScript CanvasJS library to visualize the data in real time, as well as the results obtained from the analysis models. This architecture is intended to serve as a reference to be extrapolated to other related application contexts.
A pilot test of the IoT system was conducted with athletes at the "Los Cracks" soccer school in the city of Cartagena, which consisted of capturing physiological variables from a sample of players with a series of physical conditions, which were tested and monitored at two specific times (rest and training). Subsequently, these data were analyzed using the IoT system, concluding that 80% of the data obtained at rest were at a high-risk level, while during training, the total number of players is at a high-risk level. These results were provided to the school's coaches as support for the decision-making process regarding the training load that each player can withstand and the progressive plan to increase this load.
As a recommendation, it is suggested that when developing IoT projects with commercial Bluetooth devices, it is necessary to take into account the characteristics of the services since many of them differ in aspects such as connectivity and coverage range. In addition, it is important to verify the mode of use, as some require the application of cooling gel in the contact area. On the other hand, the implemented IoT system can run on either Windows or Linux, making use of the Python bleak library and the free tool Gattool, which allow the connection and asynchronous access to the physiological variables data from the wearable devices.
As future work derived from the present research, it is intended to include other physiological variables to the IoT system, as well as to apply other artificial intelligence models to the captures made.

