


 Inglés (pdf)
 Articulo en XML
 Referencias del artículo
 Enviar articulo por email
 Citado por SciELO
  Citado por Google
  Similares en
SciELO
Similares en
SciELO  Similares en Google
 Permalink
I. INTRODUCTION
The applications and services supported by data networks are constantly growing, so the architectures of the new networks must be service-oriented and equipped with intelligence, flexibility, and programmability. The above with the aim of providing the global acceptability of an application or service. This is the quality of experience (QoE) [1]. To achieve this vision, the industry and the academy have established that the softwarization of the network constitutes the fundamental basis for achieving a multi-client architecture capable of satisfying the diverse current and future requirements [2]. From this situation, a proposal that takes advantage of the technological advance of recent years arose; that is, the Software-Defined Network (SDN) and the Network Function Virtualization (NFV) [3], [4].
The QoE is based on subjective parameters; that is, it measures the interaction between the content presented and the user's perception (color, light intensity, or damaged pixels), and it is expressed through concepts such as: excellent, good, acceptable, regular, or bad [5]. Other factors that could impact the QoE are usability, technological performance, subjective evaluation, expectations, context, screen size, lighting, viewing distance, and user movement [6]. The SDN, on the other hand, separates forwarding and controlling functions to design a network that can be centrally scheduled and managed. In contrast, the NFV isolates network functions from hardware and provides the infrastructure on which the SDN software can run. Both are based on virtualization and use network isolation, but they differ in how they separate functions and extract resources [7].
Thus, this paper presents the construction of a video scenario since this service generates the most traffic in both mobile and wired data networks [8], [9]. Moreover, the consumption of this service has dramatically increased with the arrival of OTTs, social networks, and the capabilities of devices such as smart TVs and smartphones [10]. Therefore, the functional scenario that supports the video streaming service is built using SDN and NFV networks; background traffic is used to vary its behaviour. For each scenario, the QoE is estimated using the subjective metric of the Mean Opinion Score (MOS), and the objective metrics are also calculated using image quality measurements with complete reference (FR-IQA). The objective metrics used are the Peak Signal-to-Noise Ratio (PSNR), the Structural Similarity Index Measure (SSIM), and the Video Multimethod Assessment Fusion (VMAF). The PSNR is the relationship between the maximum possible power value of a signal and the power of the noise that affects or distorts the quality of its representation. The SSIM is used to measure the similarity between two images and predict the perceived quality of the images. The VMAF predicts subjective video quality by comparing the reference video stream and the one received by the client.
The paper is organized as follows: section II presents the methodology, section III presents the results and their discussion, and finally, section IV presents the conclusions and future works derived from this research.
II. METHODOLOGY
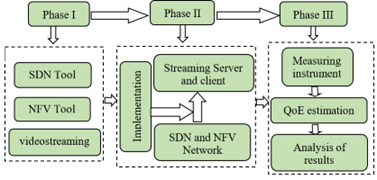
For the development of this research, an adaptation of the methodology considered in [11] was carried out, where three methodological phases were defined. In the first phase, the tools identified were capable of supporting software networks under the SDN and NFV paradigms, as well as the server and the client for the video transmission service. In the second phase, we proceeded to implement and integrate the tools in a functional scenario. In phase three, the QoE estimation experiments were carried out using measurement instruments and the analysis of the results (Figure 1).
For the implementation of the scenario, open-source tools were chosen as follows: for the construction of the SDN, the Mininet software was used due to its ability to emulate the behavior of this type of network [12]. For virtualization, docker was chosen due to its low resource consumption and ease of creating containers. Then, the NGINX server was selected as the server for video transmission due to its ability to support a high number of simultaneous requests. Lastly, VLC was selected as the client due to its ability to play many video formats and codecs and its reliability in the graphical environments available for Linux systems. As a video encoding tool, the FFmpeg multimedia framework was used. As a tool for background traffic generation, D-ITG (Distributed Internet Traffic Generator) was used because it allows the handling of packets at a low level; that is, the ability to select the number, size, or speed. The video used was Big Buck Bunny, which is classified as category AE due to its movement [13].
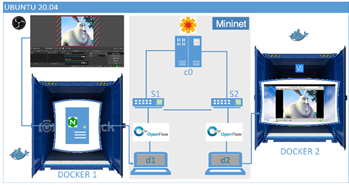
Figure 2 shows the experimentation scenario. In addition, the OpenDayLight (ODL) remote controller was used, which allowed viewing the network topology and the registration of the devices. The video streaming server and the client were hosted in separate containers which are built using Docker. To make the connection between the SDN network, the server, and the client hosted in the containers, the Mininet-based NFV tool called Containernet [14] was used. This tool helps to virtualize Docker containers as hosts in a Mininet-emulated network topology.
To deliver the video to the NGINX server, the OBS Studio software was used so that it could carry out the transmission. The topology used in the SDN is a linear network made up of two OVS switches, which run with the Linux kernel to run the OpenFlow 1.3 protocol necessary for its compatibility with the ODL driver. The switches are connected to each other through an Ethernet interface, and each of them has a host. In this case, the Docker containers with the server and the client are generated by the Containernet API. The Python code and the topological dictionary of the SDN network are shown in Figure 3.
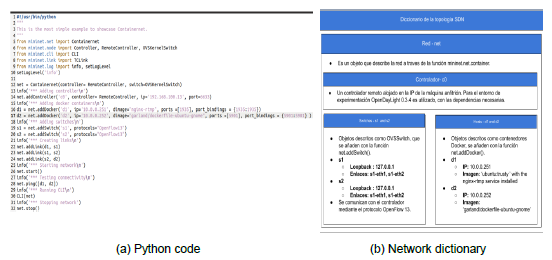
The docker container operating system for the server is Ubuntu Trusty, this being the official image, which is ready to add and install whatever application or service is needed, in this case, the NGINX server. For the client, the image used by the Docker container is dockerfile-ubuntu-gnome provided in the official Docker image repository [15].
Up to this point, we have the elements of the experimentation scenario. In addition, to build different scenarios, the D-ITG platform was used to congest the network with background traffic; thus, observe how this traffic affects the quality of the transmitted video. This platform is capable of producing traffic for IPv4 and IPv6 accurately replicating the workload of current internet applications [16], allowing the variation of different characteristics in the traffic to be introduced, such as the type of packet, the size in bytes of the payload, the packets sent per second, and the time in milliseconds in which the traffic will be sent.
As instruments for the estimation of the QoE, the MOS was used. For this, 15 users were selected through the Ishihara test [17]. Thus, users watched 40-second video clips that qualify for the following 15 seconds. The quality criterion considered the color of the image, the resolution, the blurriness, and the continuity of the movement if there is flickering. On the contrary, the content of the video was not considered. The following scale is used for the qualification: Excellent = 5, Good = 4 - 4.9, Acceptable = 3 - 3.9, Mediocre = 2 - 2.9, and Poor = 1 - 1.9 [18].
The test was designed to be carried out with three different scenarios: scenario 1, without congestion; scenario 2, with medium congestion of 90 Kbps; and scenario 3, with high congestion of 200 Kbps in the SDN network. The congestion was performed using the D-ITG tool using the ITGSend command from the server and ITGRecv on the client, using TCP (Transmission Control Protocol) packets with a payload size of 100 bytes. Each scenario was repeated three times, giving a total of 9 different visualizations.
III. RESULTS AND DISCUSSION
A. Subjective Estimation of the QoE
The surveys carried out were processed in such a way that, for each user, the average of their scores was obtained in each of the visualizations by experimentation environment with a relative error of 5%. Subsequently, the standard deviation and the mean for each experimental environment were found among all the calculated means.
In Figure 4 (a), the results obtained for Scenario 1 are observed; that is, without congestion. The quality of experience expressed by users was, on average, in the range between Excellent and Good. It is understood that this estimate is given since the video display was the best by not having any network congestion.
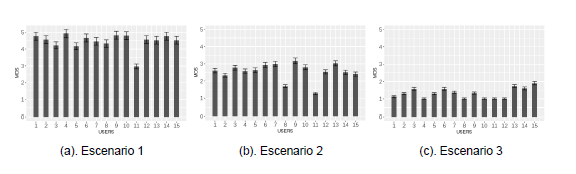
Scenario 2 employed medium congestion where users perceived that the quality of the video received by the client was in the range between Acceptable and Mediocre. The result is observed in Figure 4 (b). On the other hand, for Scenario 3, which had high congestion, the users rated the video quality as Poor. This can be seen in Figure 4 (c).
The results of the general mean for each of the experimental environments shown in Table 1 establish that, on average, the users had a perception of Good, Mediocre, and Bad quality for the scenarios without congestion, with medium congestion, and with high congestion, respectively.
Table 1 Statistics of the QoE for each scenario.
| Scenario | Average QoE | Standard deviation |
|---|---|---|
| 1 | 4.48 | 0.4723239853 |
| 2 | 2.55 | 0.5017219028 |
| 3 | 1.32 | 0.2996823715 |
However, to corroborate the QoE assertiveness of the scenarios, it is also necessary to analyze the standard deviation of the general mean. This measure defines the dispersion between each data obtained for each experimental scenario; so that, having a high standard deviation, there is a greater distance between the data and having a low standard deviation, the data is closer to each other. Therefore, it can be inferred that in the scenario with high congestion, the surveyed users gave a very close value to the video quality since it has a low standard deviation value, see Table 1; while in the scenarios without congestion and with average congestion, the standard deviation value is in a medium range, see Table 1, concluding that the users surveyed gave a more dispersed rating.
B. Objective Estimation
The measures for the objective Video Quality Assessment (VQA,) are studied from the measurements of the Image Quality Assessment (IQA). Since this research employs a controlled environment, the FR-IQA [19] is used. In FR-IQA algorithms, complete reference image information is needed to predict the quality of degraded or distorted images; these algorithms generally perform pixel disparity measurements between reference and distorted images. These FR-IQA objective metrics were obtained with the help of the FFmpeg framework [20] and an additional library called ffmpeg-quality-metrics, which allowed to obtain comma-separated value files for the following metrics [21]: PSNR, this metric calculates the mean square value of the difference between the original video and the received frames from the pixel distortions [22]; SSIM, which is based on perception to determine how much degradation an image/video has compared to a reference; it is expressed in a decimal from 0 to 1, being 1 the total similarity between the compared elements [23]; and VMAF, which is a metric based on perception through machine learning, developed by Netflix for streaming systems, which uses different algorithms and measures through Vector support machines (SVM) to provide a quality measure for the video for the high correlation to the subjective opinions that a human being can have, allowing in some video streaming architectures the correction in real time of the video quality [24], its measurement is a decimal from 0 to 100, with 100 being the maximum measurement fidelity.
Next, the curves of the frame-by-frame results of each objective metric for each of the three experimentation scenarios are presented.
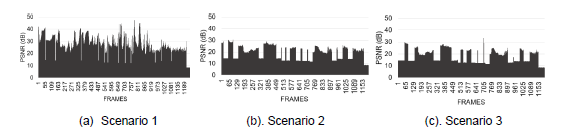
1) PSNR. For the PSNR in Figure 5 (a), it is observed that 91.5% of the frames exceed the value of 20 dB and that, according to [25], they are in the range of general PSNR. In Figure 5 (b), the PSNR is presented for Scenario 2, where 52% of the frames exceed the value of 20 dB. In Figure 5 (c), the PSNR is presented for Scenario 3, where only 40% of the frames exceed the value of 20 dB. According to these results, only Scenario 1 meets the general range of the PSNR.
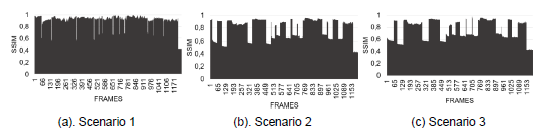
2) SSIM.Figure 6 (a) shows the behavior of the SSIM metric of the video when it is transmitted in Scenario 1, where 92% of the frames exceed the value of 0.8; that is, they present a high similarity. In Figure 6 (b), the SSIM for Scenario 2 is presented, where only 58% of the frames exceed the value of 0.8. In Figure 6 (c), the SSIM for Scenario 3 is presented, where only 49% of the frames exceed the value of 0.8.
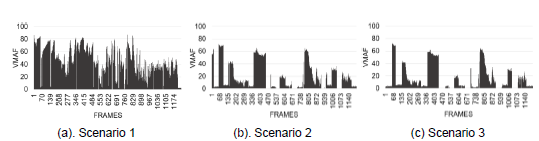
3) VMAF. In Figure 7 (a) - (c), the curves of the behavior of the frames-by-frames VMAF metric for scenarios 1, 2, and 3 are presented, respectively. Figure 7 (a) shows the VMAF for Scenario 1, where 48.7% of the frames exceed the value of 40, and 2% of the frames have a VMAF value of 0. Figure 7 (b) shows the VMAF for Scenario 2, where only 20% of the frames exceed the VMAF value of 40, and 15% of the frames have a VMAF value of 0. Figure 7 (c) shows Scenario 3, where only 16% of the frames exceed the VMAF value of 40, and 20% of the frames have a VMAF value of 0. Therefore, there is a greater loss of frames in scenarios with greater congestion; that is, VMAF equal to 0. In addition, note that there is a greater number of lost frames in the scenario with greater congestion; this is a lower VMAF frame by frame.
According to the above and relating the subjective metrics of the MOS with the objective metrics PSNR, SSIM, and VMAF, it can be said that the estimate of the QoE will be greater than or equal to 4; that is, a good MOS if the objective value of VMAF is above 40 in at least 50% of the frames, the objective value of the PSNR is greater than or equal to 20 dB in at least 90% of frames, and the SSIM target value is greater than or equal to 0.8 in at least 90% of frames.
IV. CONCLUSIONS
The chosen free tools showed their functionality and allowed their integration for constructing an emulated scenario of an SDN network to support the video service. Thus, an NGINX server and a VLC video client supported by NFV technology represented by Docker containers were integrated into a single scenario. The data network is based on SDN technology for which the Mininet emulation tool and the ODL external controller were used.
Subjective estimation using the MOS metric is a time-consuming process, which requires the prior selection of users; this is costly in terms of time and human resources. The QoE estimation was only good for Scenario 1, which is the one without congestion. It is worth mentioning that the influence of computational resources on the results obtained in each scenario cannot be ruled out. However, the contribution lies in the construction of the scenario and how it can be modified through background traffic.
Objective metrics for QoE estimation showed agreement with MOS and have the advantage of not being costly in terms of human resources or time. Furthermore, being complete reference metrics, they adapt well to controlled environments, and it is also possible to automate the process thanks to the capabilities offered by the FFmpeg framework.
In future work, the extrapolation of the scenario to the cloud and the study of other types of metrics that do not require a complete reference for the estimation of QoE is proposed.

