


 Inglés (pdf)
 Articulo en XML
 Referencias del artículo
 Enviar articulo por email
 Citado por SciELO
  Citado por Google
  Similares en
SciELO
Similares en
SciELO  Similares en Google
 Permalink
I. INTRODUCTION
In Colombia, coffee farmers face several challenges, including the lack of financial support from government entities, limited resources, and low access to technologies to optimize their activities [1]. These limitations can be addressed from different points; however, from the technological perspective, it is necessary an efficient, economical, and accessible solution that is easy to implement.
One of the most used and least expensive technologies to optimize agricultural management are UAVs, since these equipment with multispectral cameras enables seeing the spectral difference between healthy and diseased vegetation [2], [3]. Moreover, the variety of soils, environments, and the given treatment must be considered because small variations in these conditions can impact the characteristics of crops and the analysis of their reflectance[4], [5]. For instance, analyzing coffee crops under agroforestry systems is different from free exposure crops because they grow in dissimilar microclimates.
This research will focus on the study of the health status of coffee crops through the analysis of images obtained by the Agrocam and Survey 3 multispectral cameras transported in Unmanned Aerial Vehicles (UAVs). This aims to create tools that support coffee growers to monitor the general health of their crops in a global and fast way in the future, thus saving resources, time, and money.
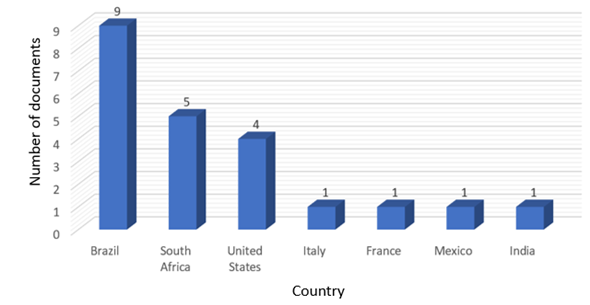
The Scimath tool and a Systematic Literature Review (SLR) on software engineering were used for the bibliometric collection following Kitchenham’s methodology [6]. In addition, when executing the bibliographic search using the filter "Multispectral and Coffee" without restriction of years in the Web of Science (WOS) and Scopus databases, 22 studies that analyzed coffee crops through multispectral images were found. None of these studies was carried out in Colombia, as shown in Figure 1. Subsequently, another search was carried out in Google Scholar using the filter "Multispectral and Coffee and Colombia", and 536 results were obtained, out of which only two focused on coffee crops [7], [8].
The most important works related to the use of UAVs and multispectral images in Colombia are highlighted below, Meneses et al. [9]used drones and RGBN (Red, Green, Blue, NIR) cameras to know the health status of the plants by studying the spectral response of a potato crop in Cundinamarca and calculating the NDVI. J. Rojas et al [10] proposed a different approach to analyze the health status, the authors calculated 7 vegetation indices: Relative Vigor Index (RVI), Green Normalized Difference Vegetation Index (GNDVI), Difference Vegetation Index (DVI), Transformed Vegetation Index (TVI), Corrected Transformed Vegetation Index (CTVI), Modified Soil-Adjusted Vegetation Index (MSAVI), and Normalized Difference Vegetation Index (NDVI) to estimate rice biomass at different stages of cultivation by UAV and a Tetracam ADC-lite multispectral camera.
Using the same equipment, Rojas et al [10], [11] developed a system (Hardware and Software) to capture and process multispectral images of rice crops at different stages and for two types of crops: Santa Rosa for lowlands and Palmira for highlands. To do this, they calculated the vegetation indices (RVI, NDVI, GNDVI, DVI, CTVI, TVI, and MSAVI). Debian et al [2] monitored rice fields in Bogotá using UAVs and a NIR camera. This provided farmers with an integrated tool to measure and assess living green vegetation by assembling a mosaic of multispectral images of the terrain.
In contrast to the works mentioned above, the present study aims to evaluate the use of images captured by the Survey 3 multispectral camera transported by a UAV to study the health status of freely exposed coffee crops in the department of Cauca, Colombia.
II. MATERIALS AND METHODS
For the experimental design, the CRISP-DM model was adapted for this experimental design [12], [13]. It consists of 5 phases: i) understanding the business and the goals of the project; ii) data collection; iii) prepare and understand data; iv) techniques and processing applied to the data; v) data evaluation [12], [13].
Figure 2 presents the stages of the adapted experimental design linked to some phases of the CRIPS-DM model. The first phase, called Understanding the business, analyzes the problem presented in the previous section, in this adaptation it was not considered in the experimental design stages. The second and third phases are joined to form the Data capture stage, which involves the collection of data. The third stage, Data pre-processing, involves filtering the data captured initially and the generation of synthetic data to obtain the final data set with which the models will be trained. Finally, the fourth and fifth phases represent the Data modeling through learning techniques and the evaluation of the error of said models.
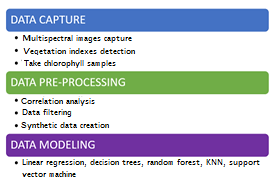
Figure 3 shows the internal stages of data collection and processing.
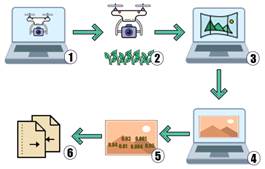
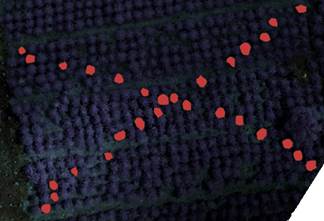
In Step 1, the flight of the SOLO 3DR UAV was programmed in Mission Planner to capture multispectral images of a coffee crop located in San Joaquín, Tambo, Cauca with the MAPIR SURVEY 3 camera. Step 2 represents the collection of the data, which includes taking pictures with the UAV and chlorophyll samples with the CCM-200 plus device. For mapping the terrain, the number of samples to be taken were determined based on the literature [14], [15]. Two samples per leaf, 30 leaves per plant, and 30 coffee trees in total were taken from a field of approximately 460 coffee trees in an X shape—as shown in Figure 4—to measure chlorophyll, thus fulfilling the first phase of data capture.
It should be noted that chlorophyll serves as an indicator of the health status, nutrients, and productivity of plants [15]- [17]. It is possible to establish a classification scheme for the health and nutritional status based on the chlorophyll values measured in situ [18]- [20]. The ICC values are close to those found in the literature; however, for this study the relationship between SPAD and ICC expressed by [21] will be considered because it includes a wider variety of crops (Table 1).
Table 1 SPAD and CCI values based on the health status.
| Category | SPAD 502 (SPAD) | CCM-200 (CCI) |
|---|---|---|
| Poor | X < 43 | X < 25 |
| Marginal/Normal | 44 < X > 55 | 26 < X > 54 |
| Appropriate | X > 56 | X > 55 |
In Step 3, the orthophotos are created with the professional Agisoft Metashape program to have a solid image of the terrain to be studied. They are processed in the QGIS program where the values of the vegetation indices (NDVI, GNDVI, RVI, GCI, NRVI, and CVI) of the sampled plants are obtained and associated with the CCI taken from chlorophyll. In Step 4, due to the small amount of data obtained initially and the low correlation, the data set is filtered by date and time range to improve the latter. As shown in Table 2, filtering the data improves said correlation and synthetic data is generated with the Gretel-Synthetics library from Gretel using the new data set [22], thus finishing the data pre-processing phase. Based on these results, in Step 5 the machine learning models are trained with the initial data structure and the synthetic data. They are modeled with linear regressions, support vector machine, decision trees, random forest, and k-nearest neighbors.
IV. RESULTS AND ANALYSIS
At the end of the data collection and training the models, we found that for each case, integrating synthetic data decreased the given error by having more training data. Table 3 shows that the model that obtained the lowest error when having all the training data was support vector machine, with an error of 7.85 and a correlation of 0.58.
Table 3 Error of the complete data set with the different machine learning models.
| Model | MAE | MSE | Pearson Correlation |
|---|---|---|---|
| Linear regression (LR) | 8.58 | 111.95 | 0.48 |
| Decision tree (DT) | 10.87 | 208.05 | 0.42 |
| Vector Machine (SVM) | 7.85 | 106.49 | 0.58 |
| Random forest (RF) | 8.79 | 130.98 | 0.49 |
| KNN | 8.26 | 120.74 | 0.51 |
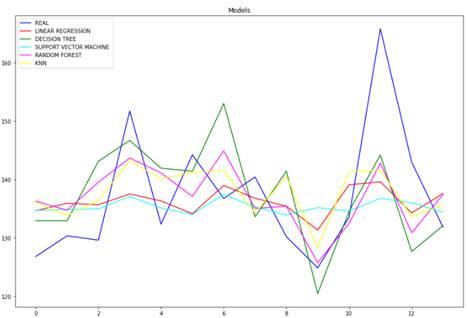
Figure 5 shows the behavior of the estimated data of each model compared to the real data (blue line), the X axis represents the data identifier, and the Y axis is the chlorophyll value. The vector machine model stands out.
Finally, to finish the data modeling phase, Table 4 shows the error for each vegetation index and trained model. The vector machine model stands out, like in Table 3. Moreover, the vegetation indices with less error were those related to chlorophyll (GCI, GNDVI, and CVI), which makes sense, and presented a high correlation.
Table 4 Data error of each vegetation index with each model.
| LR | DT | SVM | RF | KNN | Media | ||
|---|---|---|---|---|---|---|---|
| NDVI | MAE | 8.412 | 11.69 | 8.44 | 10.25 | 9.43 | 9.64 |
| MSE | 108.68 | 242.01 | 117.18 | 177.50 | 140.70 | 157.21 | |
| CVI | MAE | 8.414 | 9.84 | 7.96 | 8.848 | 8.30 | 8.67 |
| MSE | 116.22 | 175.79 | 108.31 | 137.78 | 111.51 | 129.92 | |
| GNDVI | MAE | 8.44 | 11.04 | 7.95 | 9.49 | 8.23 | 9.03 |
| MSE | 115.56 | 209.56 | 108.81 | 155.41 | 115.68 | 141 | |
| NRVI | MAE | 8.403 | 11.70 | 8.50 | 10.27 | 9.42 | 9.66 |
| MSE | 108.08 | 241.79 | 118.93 | 177.30 | 140.97 | 157.41 | |
| RVI | MAE | 8.416 | 11.11 | 8.45 | 9.64 | 9.27 | 9.38 |
| MSE | 108.31 | 213.79 | 117.26 | 162.17 | 135.91 | 147.49 | |
| GCI | MAE | 8.45 | 11.16 | 7.96 | 9.38 | 8.26 | 9.04 |
| MSE | 115.56 | 219.582 | 8.44 | 157.02 | 17.15 | 103.55 | |
V. CONCLUSIONS
When analyzing the errors of the different models, their values can be justified by several factors. In the first place, the chlorophyll data present a significant standard deviation both at the leaf and plant levels, which increases the dispersion between the data obtained. In addition, the long sampling times of the physical parameters with respect to the UAV flight time must be considered, since taking the physical samples took 7-8 hours approx. and the UAV flight was carried out in 10 minutes at a specific time of the day (usually between 11:00 a.m. and 01:00 p.m.). Another important aspect is that the climatic variation affects the response of chlorophyll and the reflectance captured by the camera; in one of the flights the day was clear and in the other there was intermittent cloudiness. More flights were made, but they were discarded because it was not possible to collect all the data completely since the rains affected the sampling. Additionally, the national strike on April 28, 2021, and the health emergency due to the COVID-19 pandemic affected the mobilization to carry out more flights.
For these reasons, it was necessary to categorize and segment the information to conduct the exploratory data analysis and model it in a better way. It is important to take the data at a certain time, preferably at noon, when the sun is at its highest point and the reflectance level is most appropriate. Having a sampling scheme is also important because defining the section and measurement points at the leaf and plant level enables better relating the data obtained.
Considering the aspects that affected the experiment, when observing the errors obtained, the correlation, and the level of precision, the vector machine model stands out. In it, outliers have less impact due to segmentation of hyperplanes. When reviewing multicollinearity through the analysis of the correlation among the vegetation indices, the division between two groups stands out: the first one relates the NDVI, RVI, and NRVI indices; the second group contains the GNDVI, GCI, and CVI indices. For most of the models, except linear regression, the second group obtains the lowest errors, and it makes perfect sense since—as has been expressed on several occasions and according to the literature—they are used to estimate the chlorophyll content. In the linear regression, the NRVI index stood out. It is similar to the NDVI, but also reduces the effects of topography, lighting, and atmospheric effects, which is helpful when clouds dim the capture of multispectral images.
Finally, the health of the crop in general is estimated as adequate in each plant, taking the reference value of chlorophyll as a reference and the estimate, since it exceeds 54 CCI in each plant. In general, the UAV airborne Mapir Survey camera was useful to estimate the health of coffee crops; however, it is advisable to have more indicators (carbon, nitrogen, fertilizer, among others) apart from the chlorophyll measured with the CCM 200 PLUS to feed the prediction models.
Research carried out in recent years documents the potential of UAVs and multispectral images applied to agriculture. By using a 3DR Solo UAV, the Mapir survey 3 and Agrocam multispectral cameras in coffee crops in the department of Cauca, it is expected to estimate the health, nitrogen levels, and maturity with acceptable precision, which supported coffee growers in making decisions.
By knowing the state of maturity, health, and nitrogen levels of an affected space quickly, control measures can be used to treat the area in the best possible way. Then, coffee growers will be able to determine the amounts of nitrogen fertilizer needed, to separate infected areas with some type of pest or damage, and to estimate times and harvest yield.
As future works, we propose to analyze more thoroughly the correlation among values of vegetative indices such as NDVI, SAVI or TVI with pathogens or common ailments in coffee, and to estimate other components such as biomass and chlorophyll, which will yield more detailed results about what is affecting the crop.
Considering the research opportunities opened by this research project, the following works are proposed:
Increase the data size. It is important to take a larger number of samples, if possible, with several pieces of equipment (more devices to measure physical variables in the field). Consider other physical variables such as nitrogen, amount and type of fertilizer used, and carbon of a technified lot to improve the estimate and consider more factors that influence it; all this, along with other training models such as close neighbors, decision tree, and random forest.
Another possibility is to work with diseased crops segmented by type of disease to analyze it and its behavior through multispectral images and different parameters measured on land. This enables characterizing the crop and perform automatic segmentation.
A variant that can be added to this study and to what was mentioned in the previous points, is to carry out the analyzes with cameras with a greater range and more bands to consider more vegetation indices and have a better resolution. In addition, having access to a precision geolocator that follows the measurements on land would help improve the quality and fix the orthomosaic.
Coffee life stages are long; thus, we propose to analyze the different coffee cycles. A lot of time is needed to do this with UAV and physical measurements taken by plant; hence, it would be recommended to work with satellite multispectral/hyperspectral images of a technical batch to ease the process and analyze a good amount of information.
Study different agricultural crops representative of Colombia such as plantain, banana, avocado, and sugarcane.
An important aspect to validate and conduct tests is to use new input data to analyze the behavior of the models, i.e., to use generalization, since taking new data according to the national panorama and time was not feasible in our case.
Due to the prolonged growth times of coffee, it is difficult for us to collect enough spectral images with UAVs to apply machine learning methods; for this reason, we propose to apply machine learning to coffee crops in Colombia through the analysis of multispectral images captured by satellite. Additionally, bring the technology to lulo, cassava, plantain, banana, and other strong crops in the country to improve the global supply of agricultural products in Colombia.

