


 Inglés (pdf)
 Articulo en XML
 Referencias del artículo
 Enviar articulo por email
 Citado por SciELO
  Citado por Google
  Similares en
SciELO
Similares en
SciELO  Similares en Google
 Permalink
I. INTRODUCTION
According to the Orientation Guide of the Saber 5º tests [1], they “evaluate elementary school fifth-grade students aiming to contribute to the improvement of the quality of Colombian education through periodic tests that evaluate the students' competences in Language, Mathematics, Natural Sciences, and Citizenship, and analyze the factors that affect their achievements.” Its nature enables assessing their progress in a given period and establish the impact of specific programs and improvement actions. According to the ICFES [2] guidelines for sample and census applications, the design of the Saber 5° tests “aligns with the Basic Skills Standards established by the Ministry of National Education (MEN), understood as common a reference that enables to determine how well students and the education system as a whole meet the quality expectations in terms of what they know and are able to do.”
In Colombia, several studies on the Saber 5° tests have been conducted. Torres et al. [3], Martín [4], and Gutiérrez [5] seek to identify the variables associated with academic performance in the Saber 5° Tests based on only one fundamental area -Natural Sciences, Mathematics or Language. In another study [6], the associated factors of the 5° and 9° grade tests were analyzed; one of the conclusions was that the higher the socioeconomic level of the students and their families, the higher the expected performance in both areas and grades. In addition, private school students tend to obtain higher test scores, and the differences -compared to those who attend official schools- increase as socioeconomic conditions improve. The report on Associated Factors of the Saber 5° and 9° Tests published by the ICFES [7] identifies variables related to performance in the Saber tests. Statistical techniques that enabled visualizing elements that affect academic performance were applied. To extend evaluation processes, the ICFES studied factors associated with school performance using theoretical models. The aim was to explain the relationship between the elements that determine learning at three levels: educational institutions, classrooms, and students [2].
According to Timaran et al. [8-9] “the studies carried out to date to determine academic performance in the Saber tests are based on information processed through statistical analysis, considering variables and primary relationships, but ignoring the true interrelationships, which are usually hidden and can only be discovered giving a more complex treatment to the data, which is possible with data mining.”
Educational institutions can use data mining to make comprehensive analysis of the characteristics of their students and evaluation methods, to reveal successful processes or, on the contrary, detect fraud or inconsistencies, and determine the probability of dropout of any student [10-13].
In this paper, predictive data mining techniques are applied to discover academic performance patterns in the Language skill of the Saber 5° test taken by fifth grade students at Colombian elementary schools in 2017.
II. MATERIALS AND METHODS
The data used in this research was obtained from the ICFES databases, where the socioeconomic, academic, and institutional information of the students of the elementary educational institutions who presented the Saber 5° tests are stored.
This research was descriptive, under the quantitative approach, and applied a non-experimental design. The CRISP-DM (Cross-Industry Standard Process for Data Mining) methodology was used. According to [14], [15], [16], it is "one of the models used, mainly, in academic and industrial environments and the most widely used reference guide in the development of data mining projects”. It comprises six phases: business understanding, data understanding, data preparation, modeling, evaluation, and deployment.
In the business understanding phase, the necessary information was collected and selected. It allowed the researchers to know and appropriate the knowledge about the Saber 5° tests and the evaluated skills, with emphasis in Language. This process made it possible to collect the correct data to obtain adequate results.
In the data understanding phase, the socioeconomic, academic, and institutional information of Colombian students who presented the Saber 5° tests in 2017 was identified, collected, and familiarized. As a result, an initial data set called sbr11_776436A56 was obtained, it had 776436 records and 56 attributes.
In the data preparation phase, data cleaning and transformation techniques were applied to the set sbr11_776436A56 to eliminate noisy, null, atypical data, and transform some attributes so that they obtain more information, and to eliminate those irrelevant attributes that did not contribute to the pattern detection process. As a result, the data set called sbr11_776436A15 was obtained. It consisted of 776436 records and 15 attributes, which served as the basis for the modeling phase.
In the modeling phase, the classification model with decision trees was selected as the most appropriate data mining technique to solve the research problem due to the ease and simplicity to interpret the patterns obtained [17-19]. This technique has several advantages: first, the reasoning process behind the model is clearly evident when examining the tree, contrary to other black box modeling techniques, where the internal logic can be difficult to figure out; second, the process automatically includes only the attributes that really matter in decision-making and omit the ones that do not contribute to the accuracy of the tree [20-21].
In the evaluation phase, the cost of the classifier for the sbr11_776436A15 repository was estimated through the confusion matrix [18]. Following the recommendation of Hernández et al. [20], we used the cross-validation method with 10 partitions (10-fold cross validation) to test the quality and validity of the model and to reduce the dependency of the result on the way in which the partition is performed [20]. Likewise, the discovered patterns were evaluated to determine their validity, remove redundant or irrelevant patterns, and interpret useful patterns so they are understandable to the user, considering their support and confidence.
In the deployment phase, the discovered patterns were documented. These are quality information to help the decision-making of organizations such as the MEN and elementary educational institutions to create plans to improve the quality of elementary education in Colombia.
III. RESULTS
A. Exploratory Data Analysis
To understand the data, we analyzed the socioeconomic variables of the students who took the Saber 5° tests in 2017. The results show that by gender most of them are men, with a 52.3%. By age, most are between 10 years old (39.9%) and 11 years old (35.2%). Almost all students (89.3%) do not live in overcrowded households. Moreover, most of their parents have a high school degree (48.2% of the mothers and 47% of the fathers). The majority of students have good rates of ICTs and home appliances (43.6% and 47.7%, respectively). The largest number of students are from the Atlantic region (25.3%), followed by the Eastern (16.9%), and Pacific (15.2%) regions. Finally, 53% of students had a Language performance “below the national mean” and 47% were “above the national mean.”
B. Results
By selecting decision trees as classification technique, we aim to obtain a model that enables forecasting the socioeconomic, academic, and institutional factors associated with good (above mean) or poor (below mean) new cases of academic performance in the Saber 5° test. The target attribute was the score obtained in the Language skill. Different decision tree algorithms were evaluated with the Weka tool to select the one that best classifies the sbr11_776436A15 dataset. Results are shown in Table 1.
Table 1 Evaluation of different decision tree algorithms
| Algorithm | Accuracy |
|---|---|
| Decision Stump (One-level decision tree) | 61.95% |
| J48 | 64,44% |
| LMT (Logistic Model Tree) | 65.48% |
| Random Forest | 73.28% |
| Random Tree | 63.65% |
| RepTree | 55.50% |
According to Table 2, the algorithms with the highest accuracy were Random Forest and LMT, but we did not choose them due to their interpretability. For this reason, we chose the J48 algorithm for the construction of decision tree classification models since it facilitates understanding the patterns.
Table 2 Selection of the best tree.
| Tree | C | M% | % Accuracy |
|---|---|---|---|
| leng_c25m7764 | 25 | 1 | 63.94 |
| leng_c25m3882 | 25 | 0.05 | 64.38 |
| leng_c005m7764 | 5 | 1 | 63.97 |
| leng_c005m3882 | 5 | 0.05 | 64.37 |
Once the algorithm, training, and testing methods for the models were selected, we built decision trees with the J48 algorithm of the WEKA tool V. 3.9.4 [22] that implements algorithm C4.5 [23]. For pruning the tree, the confidence level C, which influences the size and predictability of the tree was considered. The default value of this factor is 25% and as it decreases more pruning operations are allowed, thus getting smaller trees [24]. The parameter M was also used; it determines the minimum number of records per tree node. The Language score obtained by the students was chosen as class attribute and it was discretized as “above the mean” and “below the mean.”
Different tree models were generated to choose the decision tree that best classifies students and has the highest level of interpretability of the patterns associated with academic performance. Therefore, two values for the confidence factor C were set: 25% and 5%, combined with two values for the factor M: 1% (7764 examples) and 0.05% (3882 examples). The Cross Validation test with 10 folds was used. Table 2 shows the different trees constructed and their percentage of accuracy.
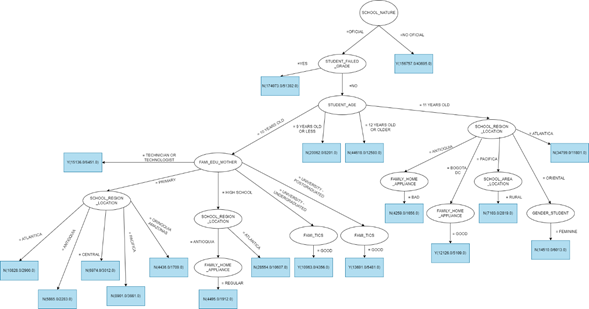
According to Table 2, the tree built with the parameters C=0.25 and M=3882 was the most accurate. Figure 1 shows the obtained classification tree. To evaluate or estimate the cost of the constructed classification model, the confusion matrix was used. This tool enables visualizing the performance of a supervised learning algorithm, as shown in Figure 2.
C. Discussion
Analyzing the Saber 5º tests Language performance according to the model shown in Figure 1, 499,929 instances were classified correctly -i.e., an accuracy of 64.4%- and 276,507 instances were classified incorrectly -i.e., 35.6%.
Evaluating the model with the confusion matrix, obtained with the Weka tool as shown in Figure 2, it correctly predicted 296,922 cases of students whose performance in Language was below the mean (True Negatives-TN) and 203,007 cases above the mean (True Positives-TP). Likewise, 161,721 cases whose performance is above the mean were incorrectly classified as below the mean (False Negatives-FN) and 114,786 cases whose performance was below the mean were incorrectly classified as above the mean (False Positives-FP).
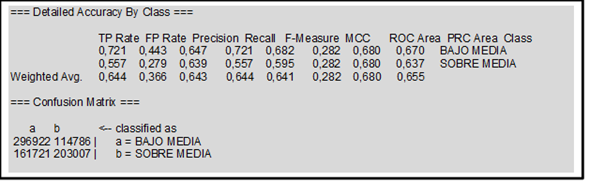
For the case of students with a score below the mean, the model has a prediction accuracy of 0.65, i.e., 65% of the predicted cases are correct. The sensitivity (TPR) and Recall of the model is 0.72, which indicates that the model correctly classifies 72% of the students who are actually in this category. On the other hand, the False Negative Rate (FP Rate) of the model is 0.44, which means that 44% of students who were above the mean were classified as below the mean. The F-measure is 0.68, which means that the harmonic mean between the precision and the recall of those below the mean is 68%. The combination of these measures indicates a better performance of the model for them.
For the case of students who are above the mean in the language score, the model has a prediction accuracy of 0.64, i.e., 64% of the predicted cases are correct. The sensitivity (TPR) and Recall of the model is 0.56, which indicates that the model correctly classifies 56% of the students who are actually in this category. On the other hand, the False Positive Rate (FP Rate) of the model is 0.28, which means that 28% of students who were below the mean were classified as above the mean. The F-measure is 0.60, which means that the harmonic mean between the precision and the recall of those above the mean is 60%. In the combination of these measures, a worse performance of the model can be seen for the latter.
The model built to detect performance patterns in the Saber 5° tests Language skill is not unbalanced. There is no significant difference between cases below the mean (53%) and those above the mean (47%). Therefore, Cross Validation was used to build the tree.
Within the evaluation metrics calculated above, the model has an accuracy of 64.4% and it predicts better the students below the mean than those above the mean. This is also observed in the relationship between Recall and Accuracy given in the PRC area, which is 0.67 for students below the mean and 0.64 for those above the mean. The Mathews-MCC correlation coefficient of the model is 0.28, which indicates a medium agreement between what is predicted and what is observed. That is, a regular quality in the prediction. Regarding the areas, the ROC area of the model (0.68) indicates that it has a good performance in the classification of Colombian students with respect to the Language score obtained in the Saber 5° tests because it is greater than 0.5.
To choose the most representative performance patterns in Language, as seen in Figure 1, students who pass a minimum support of 1% and a minimum confidence of 60% were considered. The following rules are the interpretation of these patterns (in descending order by support):
Rule 1. If the student comes from an official school and failed school years, then his/her performance in Language is likely to be below the national mean, with a support of 22.4% and a confidence of 70.5%. 42.3% of the analyzed students below the mean meet this pattern.
Rule 2. If the student comes from an unofficial school, then his/her performance in Language is likely to be above the national mean, with a support of 20.2% and a confidence of 72.1%. 43% of the analyzed students above the mean meet this pattern.
Rule 3. If the student comes from an official school, did not fail school years, and is 12 years old or older, then his/her performance in Language is likely to be below the national mean, with a support of 5.7% and a confidence of 71.8%. 10.8% of the analyzed students below the mean meet this pattern.
Rule 4. If the student comes from an official school, did not fail school years, belongs to the 10 years old age group, the educational attainment of their mother is high school, and the student comes from the Atlantic region, then their performance in Language is likely to be below the national mean, with a support of 3.7% and a confidence of 62.9%. 6.9% of the analyzed students below the mean meet this pattern.
Rule 5. If the student comes from an official school, did not fail school years, belongs to the 10 years old age group, the educational attainment of their mother is university and the ICT index at home is good, then their performance in Language is likely to be above the national mean, with a support of 1.4% and a confidence of 60.3%. 3% of the analyzed students above the mean meet this pattern.
Rule 6. If the student comes from an official school, did not fail school years, belongs to the 10 years old age group, the educational attainment of their mother is elementary school, and the student comes from the Atlantic region, then their performance in Language is likely to be below the national mean, with a support of 1.4% and a confidence of 73.2%. 2.6% of the analyzed students below the mean meet this pattern.
IV. CONCLUSIONS
In this research, the decision tree classification model was selected to detect performance patterns in the Saber 5° tests Language skill presented by Colombian students of elementary schools in 2017 because it is easier to interpret the patterns. To prepare the data, the construction and evaluation of the model, we followed the stages of the CRISP-DM methodology.
Among the most important factors discovered -associated with good or bad academic performance in Language- we found the nature and location of the school, whether or not students failed a school year, the age group, the educational attainment of the mother, and ICT rates and home appliances. The main characteristic of the students’ good performance in Language is that they belong to unofficial (private) schools with a support of 20.2% -in relation to all the students who presented the Saber 5° tests- and a confidence of pattern of 72.1%. Likewise, students from official schools who failed school years had low performance with a support of 22.4% and a pattern confidence of 70.5%.
According to the analyzed quality metrics, the model predicts better students below the mean (negative) than those above the mean (positive). This means that the model is more sensitive than specific; thus, it tries to avoid false negatives.
Future work includes building decision tree models to predict the performance of Colombian students in the Saber 5° tests Mathematics skill and analyzing the results. Apply descriptive data mining techniques to find the association and similarity relationships between the socioeconomic, academic, and institutional attributes of the students who took the Saber 5° tests.

