


 Inglês (pdf)
 Artigo em XML
 Referências do artigo
 Enviar este artigo por email
 Citado por SciELO
  Citado por Google
  Similares em
SciELO
Similares em
SciELO  Similares em Google
 Permalink
I. INTRODUCTION
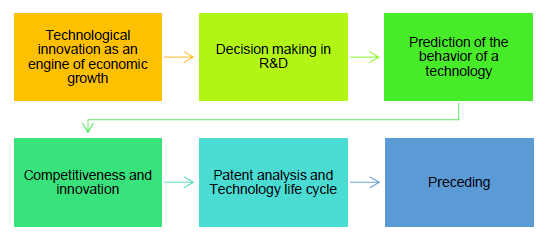
Technological innovation is one of the engines of economic growth for any company; therefore, it is crucial to estimate the scope of the technology to be developed and its possible potential to revolutionize the industry or the field of application. Decision-making in research and development is a fundamental to define project priorities and strategies, which entails an investment of time and resources with benefits projected in the medium and long term [1 - 2]. Therefore, understanding what can be expected from a technological development enables knowing its limits and the resources that will be needed for its creation and execution.
It is vital to predict if the project to develop a technology will be innovative and competitive prior to starting it up. To do so, it is necessary to implement methods that project the behavior of the technological development over time and the novelty it will represent in the market. This is an important pillar to maintain the competitiveness of a company. The analysis of patent databases and the analysis of the technology life cycle (forecasting) are two useful methods to identify the direction of technological growth and planning the development of a technology; in the industrial and academic sectors, They consist on examining the statistical, analytical, and methodological information contained in patent documents [3], along with the use of mathematical models to predict the behavior of a technology over time.
These methods have been used in different fields like research and identification of technological trends, e.g., 5G telecommunications [4], in water treatment [5], the automotive sector (hybrid and electric) [6], medical technology (electronic skin) [7], nanotechnology [8], emerging technologies in the energy sector [9], and in the development of population and cities using the logistic model [10]. The above confirms the versatility of these methods in various applications. Patent data mining can be made from specialized web portals, it could be directly from patent offices such as Espacenet (European Patent Office), USPTO (United States Patent Office and Trademark); or from software that allows broader analysis such as Orbit Intelligence (licensed software) or Lens (open access version).
Finally, there are guidelines on patent analysis [11], [12], like the Elsevier editorial, which presents some recommendations for writing scientific articles [13]. However, this methodology not only proposes a series of steps that provide the reader with a guide to conduct this type of analysis for any technology, but also how to use each software and interpret the results obtained and formulate a concept on the cycle of technological maturity based on the logistic model for forecasting [14]. Below, we summarize the importance of patent analysis for the development and competitiveness of a company or institution (Figure 1).
II. METHODOLOGY
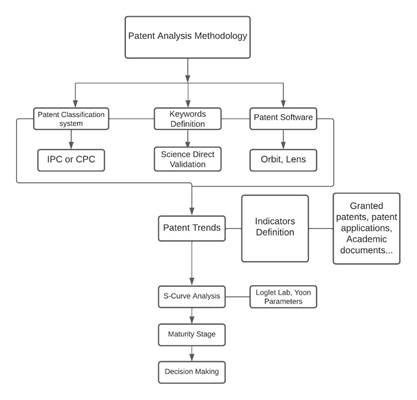
This methodology is designed based on different patent analysis papers and editorial recommendations, according with the methodologies applied, this one collect some of the most relevant concepts to guide the user and understanding the results from the software to prepare a patent analysis article (Figure 2).
III. RESULTS
A. Abstract
The Elsevier editorial establishes that the abstract must be concise and brief regarding what was done in the investigation. This part of the document shows a brief context and summarizes the main issues and results, it is also necessary to present a precise conclusion of the conducted analysis. The abstract must also contain the predictive concept on the future behavior of the target technology supported by the data, graphs, and comparisons shown in the document.
B. Introduction
The introduction must present, the appropriate references that support the topic of interest, as well as a brief theoretical introduction on the technology using reference reviews focused on the topic. It is preferable to cite previous analyzes on related topics, give a short introduction to the software to be used, describe the mathematical model that fits the evaluation of the technological maturity cycle for this analysis, and cite documents where they have been used. These can be both from the basic sciences and the social sciences. It should not be very extensive and the impact of this type of research in the academic, industrial, and financial fields should be clear.
C. Methodology and Data Collection
The methodology must present all the steps to get the data and the analysis that will be applied to obtain valid results.
D. Keywords
The keywords must define specifically the technology from which information is to be extracted; therefore, it is necessary to know if each one is really used in the field of interest. To validate them, it is necessary to find the corresponding thesaurus because keywords represent the concept on which the research is focused. The ScienceDirect platform enables the validation through a search for academic documents in the Elsevier databases; in this case, it would be used to validate the concepts related to the patent search.
Choosing a keyword will depend on the field and on the specificity, since a single word can be accompanied by another concept interferes with the data extraction. The image shows how the keyword “antibacterial” can appear in chemistry in different ways such as “antibacterial agent” or “antibacterial drug”; thus, it is necessary to be clear about the specific field to be studied.
E. Search Equations
Once the validation of the keywords is finished, it is necessary to build the equation that will be entered in the patent database. For this purpose, the Boolean operators “AND”, “OR” or “NOT” must be used. To create the search equation, it is necessary to use the manual of writing and nomenclature of terms of each one of the platforms [15], because the way of representing the words, in case of having compound words with “-”, “/”, subscripts, etc. may differ. For example: “Keyword 1” AND “Keyword 2” OR “Keyword 3”.
After having assembled the search equation with the validated keywords, filters must be set to ensure that the searched only in the fundamental parts of a patent and to avoid disturbances in the information. Otherwise, the keyword could be found in a patent reference without a significant value and affect the interpretation of results.
The applied filter will only relate the keywords to patents that contain them in the title, abstract or description. This way, it excludes non-relevant documents, as citations of other works. The literature recommends that patent analyzes are conducted within a time span of 20 years, the maximum period to renew a patent [16]. The selection of the filter by patent families is important because, in this way, the software will count each patent and its renewals as a single document, thus reducing the bias in the amount of data obtained.
The patent classification system also plays an important role in the quality of the obtained data. In general research topics on technology (e.g.: "nanomaterials"), a greater amount of data will be obtained if the International Patent Classification system (IPC) is used. However, if the research is on a more specific topic and the equation has a greater number of keywords, it is recommended to search in the Cooperative Patent Classification system (CPC), that contains information from the Office of European Patents (OEP) and the United States Patent and Trademark Office (USPTO) (example: “Titanium dioxide” AND “antibacterial activity” AND “coating ”) [17].
F. Data Mining and Results
After entering the validated search equation and the corresponding filters, Lens or Orbit will return the patent data that must be selected or grouped by patent families. Each software gives the option of analyzing the found the patents automatically. Among the graphs presented by the software, the user must select the one that you consider most appropriate for the research topic. Lens and Orbit show differences in part of the information they have access and its representation. Hence, we present the most important differences and graphs to make a correct decision about the software to use (Table 1).
Table 1 Comparison of the information provided by Lens and Orbit.
| Software/ Analysis | Orbit | Lens |
|---|---|---|
| Number of patents | √ | √ |
| Number of applications | √ | √ |
| Countries | √ | √ |
| Jurisdiction | √ | √ |
| Patent codes | √ | √ |
| Technology fields | √ | X |
| Companies | √ | √ |
| Institutions | √ | √ |
| Technology domain per company | √ | X |
| Inventors | √ | √ |
| Citation dependence | √ | X |
| Legal estatus | √ | √ |
| Investment trend | √ | X |
Other graphs provided by both software offer the user a greater amount of information, that can be used to better interpret the results. The obtained data presents a first approximation to understanding the behavior of the target technology. However, it is important to be clear about what the trend of this technology will be in the future to design research and investment strategies. This point has aroused great interest in predictive models for the behavior of technology in the future, i.e., “forecasting” [18].
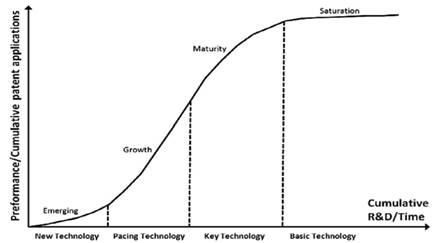
One of the ways to interpret this behavior is through the Technology Life Cycle analysis (TLC), It allows adjusting the data related to the technology of interest and extracted from indicators to a mathematical model that represents their growth based on the time through the logistic model, which is the most used for these analyses. For this, tools such as Loglet Lab 4 software can be used [19]. It fits these values to the model and represents them graphically.
Equation of the Logistic model:
Where Y(t) represents the indicator as the dependent variable of the S-curve, L is the asymptotic (maximum) value of the variable, t0 and k are model parameters automatically defined by the software and they define the midpoint and slope, respectively.
This curve by definition can be divided into different phases of technology as, presented by Ernst [18] (Figure 3).
To obtain the accumulated values of the number of patents or documents to be analyzed, it is necessary to download the data from Lens or Orbit in “csv” format. Thus, they can be processed in Excel and used later in Loglet Lab 4.
According to Gao [20], the stages of development can be defined as follows:
Emerging stage: Low competitive impact and low presence in products and processes; Growth stage: Highly competitive impact without presence in products or processes; this is known as "pacing technology". Maturity stage: Highly competitive impact and product integration; at this stage, the technology is classified as “key/leading technology”. Saturation stage: Loss of competitiveness, it becomes a technology close to being replaced and the processes from this moment on will be focused only on cost reduction.
The indicators applicable to the model can show similar stages because, they are related to the investment and interest of the scientific community [21]. Some of the most used indicators in forecasting are: Number of patents granted, Number of patent families, Number of patent applications, Number of academic documents on this technology, Number of inventors, Number of citations, Public spending on research, and, Number of patents with renewal.
The graph of the logistic model can be constructed using these indicators to give an approximation of the state of the technology using as example the "Antibacterial and self-cleaning surfaces based on TiO2/ZnO" case:
The analysis tab gives the option to modify the mathematical model, either as Logistic, Gompertz, and Richards. To find out the appropriate model, it is necessary to consult the software documentation; however, in this type of study, the logistic model is generally used [14]. The time filter in the patent search engine is removed because it is necessary to consider the record of the first documents (patents or articles depending on the indicator) on this technology.
Once the accumulated data and the time have been entered, the “guess parameters” option will allow the software to estimate the model parameters. They can be entered manually with the advanced options, in this case, the least squares adjustment method will be used. Finally, when selecting the “fit” option, the graphs with the data fitted to the model will appear as shown in Figure 4.
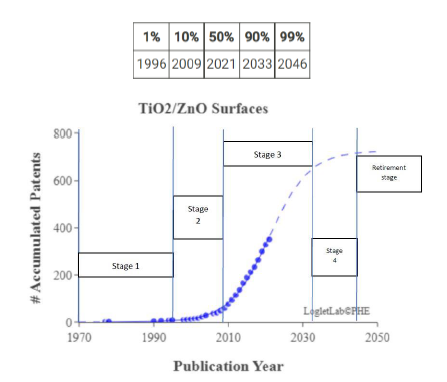
The percentages indicated in the statistics provided by the software will show the stages of technology development, making it easier to classify the stage of maturity, as follows:
1% - 10% Emergent stage
10% - 50% Growth stage
50% - 90% Maturity stage
90%-98% Saturation stage
≥99%: Retirement stage
Reaching 99% means that the technology is about to be replaced or withdrawn from the market, this is known as the “Retirement Stage”.
Having the indicators evaluated in the Loglet Lab 4 software, it will be possible to give a more solid concept on the state of the technology from the TLC. Yoon raised a series of parameters that complement the life cycle analysis and can be calculated with the data obtained in the software [22], they are shown below.
The rate of technological maturity (TMR) enables modeling the technological life cycle described in equation (2), the number of potential patents to appear (PPA) (3), and the expected remaining life (ERL) (4). The last one can only be calculated if there is a defined threshold ρ for the technology under study. In this case, a value of 0.90 is estimated for ρ, which indicates that the threshold will be 90% of the total value of the accumulated patents in the saturation phase, that is, the inflection point in the maturity phase. Next, the Yoon approximation equations are presented:
Where Lnow is the number of documents registered in the last year and L is the maximum number presented by the model for which a TMR of 100% (Retirement stage) is considered.
Where Tρ is the year with the cumulative number of patents ρ*L. Table 2 shows the parameters obtained by indicator and number of granted patents for the example in question:
Table 2 Yoon’s parameters for Antibacterial and Self-cleaning surfaces based on TiO2/ZnO [1].
| Indicator | Name | TMR | PPA | ERL (90%) | ERL (99%) |
|---|---|---|---|---|---|
| 1 | Granted patents | 66.2% | 179 | 7 | 18 |
| 2 | Patent applications | 90.0% | 90 | 2 | 11 |
| 3 | Scholarly works | 61.0% | 404 | 4 | 10 |
G. Discussion and Conclusions
The graphs obtained and the mathematically represented life cycle should help engineers to formulate a concept on the behavior of the technology. It must give a theoretical support to this behavior, contrasted with the current situation of society or the context of this technology. A clear example is the rising trend of patents in disinfection processes that may be linked to the recent Covid-19 pandemic. It is important to identify the leading countries in this technology, rather than the jurisdiction where they were patented, since it has been shown that the US market is the most desired worldwide [23].
After making a complete analysis of the technology, the concept of its behavior should be formulated and a possible strategy to be followed by the user should be clear. The leading countries and companies or institutions should be established, as well as the researchers and patents with the most citations in the field. This will action to be taken within the institution or company to achieve a better use of resources.
For the case presented in Figure 3, the life cycle analysis shows that the technology of "Antibacterial and self-cleaning surfaces based on TiO2/ZnO" is higher than 50%, which places it in a stage of maturity. It is also consistent with Yoon's parameters. This stage indicates that projects begin to focus on the innovation of products and processes related to this object of study. Thus, it appears as a leading technology and, innovations in this field will have a high impact. in the market.
Finally, if the user wants to make a first approach to patent analysis, Lens is a free access software that will enable learning how to interpret relevant data on technology, thus being a useful tool for educational purposes. Moreover, Orbit Intelligence, being a licensed software, has access to a greater number of databases and indicates the behavior of the technology more precisely. Therefore, it can be used as software for commercial purposes [23].
IV. DISCUSSION AND CONCLUSIONS
Innovation is a determining factor for the growth of a company or institution and its validity in the market. The efficient management of resources in the development of projects is essential. This type of analysis allows to recognize a clear trend of technologies in the market, which is vital for planning investment and strategies. The used software presents relevant data on the behavior of technology over time; however, Orbit has a more commercial focus due to its investment analysis. Lens, the free version, offers a first approach to patent analysis that can be used to conduct general analysis of the technology or as practice software to start in this type of study. The Loglet Lab 4 program offers different mathematical models and graphs that, complemented with the theory and experience of the researcher, allow formulating a strategic concept on the stage of maturity of a technology and the possible strategies to follow according to the results obtained. Finally, Yoon’s parameters are useful for researchers in R&D planning since results similar to the stages of maturity previously proposed are found.

