


 English (pdf)
 Article in xml format
 Article references
 Send this article by e-mail
 Cited by SciELO
  Cited by Google
  Similars in
SciELO
Similars in
SciELO  Similars in Google
 Permalink
I. INTRODUCTION
X-ray images play a fundamental role in image processing, particularly in the field of medicine. These images are vital, as they are used as a primary clinical tool for disease interpretation and accurate pathological decision-making. In recent years, there have been significant advances in the technologies employed in clinical settings, enabling the acquisition of X-ray images with millimeter-scale resolution and providing a detailed view of internal anatomical structures. Thanks to this improvement in image quality, it is possible to perform an exhaustive analysis of these images and, consequently, develop image-guided therapies based on computer-assisted diagnosis. This combination of cutting-edge technology and computational analysis has opened new possibilities in medicine, allowing for a more precise interpretation of X-ray images and facilitating the planning of more effective and personalized treatments for each patient [1, 11, 12].
Since its discovery by Röntgen, X-rays have been the subject of extensive research in various fields. One of the earliest applications of X-rays was in the medical field to gather information from inside the body without dissection. Over the years, significant advancements have been made in medical imaging, leading to the development of various systems capable of capturing moving images, mainly focused on the cardiovascular system and 3D imaging by computed tomography [2,13].
The interaction of X-rays with the human body to obtain the desired image is summarized in Figure 1. In this process, an X-ray beam is generated, which passes through the object in question, in our case, the human body, and is partially absorbed by internal structures in a phenomenon known as attenuation. On the opposite side of the body, a detector absorbs the attenuated X-rays and generates an image showing a shadow representation of the bones and soft tissues (Figure 1 (a)). However, due to the random impact of attenuated X-ray photons on the receiver plate during a given time interval, an uneven distribution of photons on the surface of the receiver occurs (Figure 1 (b)). This phenomenon results in irregular artifacts in the image that produce noise [3,14]. It is important to consider these factors to understand the limitations and challenges associated with X-ray image acquisition so that processing methods and noise reduction techniques can be improved to obtain clearer and more accurate images.
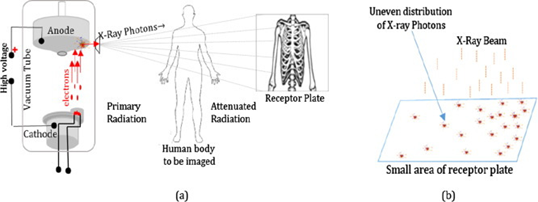
Fig. 1 (a) X-ray imaging modality. (b) Uneven distribution of X-ray photons in a small area of the receptor plate [3].
X-rays, due to their high energy, can negatively affect the human body because it is continuously concentrated, which is particularly harmful in pediatric radiology [2]. In order to reduce the risk of exposure, methods have been developed to use low doses of X-rays, which involves reduced photon information reaching the detector, consequently degrading image quality. In other words, there is a trade-off between noise reduction and information loss. Therefore, selecting an efficient filtering algorithm [3] is required to improve image quality rather than increasing the radiation dose. Denoising algorithms [4,14,15] offer a promising solution in this context. Considering the properties of gradient-based algorithms [5], such as 2D-LMS and 2D-NLMS, in this paper, noise reduction in dental radiological images is investigated using the 2D-ARγ algorithm [6].
II. METHODOLOGY
According to [6], the 2D-ARγ algorithm is governed by the following matrix equations:
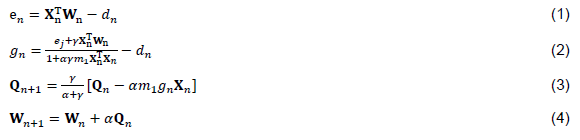
where for the time instant [n]:
X n : Matrix of the input signal
W n : Matrix of adaptive filter coefficients
d n : Scalar corresponding to the desired signal
e n : Scalar corresponding to the measurement error
g n : Auxiliary scalar
Q n : Auxiliary Matrix
𝛼, 𝛾, 𝑚1: Adjustment parameters
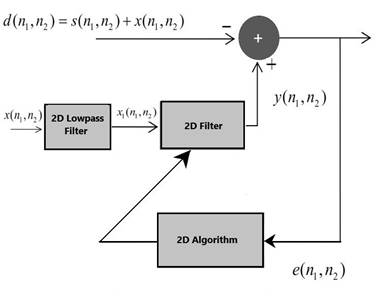
For the noise cancellation configuration of the 2D-AR γ γ filter, the block diagram scheme shown in Figure 2 was used.
The main signal 𝐝(𝒏𝟏,𝒏𝟐) is a combination of the desired signal 𝐬(𝒏𝟏,𝒏𝟐) and noise 𝐱(𝒏𝟏,𝒏𝟐). The reference signal 𝒙𝟏(𝒏𝟏,𝒏𝟐) is the noise correlated with the noise in the main signal. The 2D adaptive filter aims to reduce the noisy signal using the equation:

After the convergence of the filter coefficients, 𝐞(𝒏𝟏,𝒏𝟐) will be the estimation of the desired signal. In this simulation, white Gaussian noise with zero mean and unit variance 𝒙(𝒏𝟏,𝒏𝟐) is added to the image to create a noisy image, where the Peak Signal-to-Noise Ratio (PSNR) is set to 0 dB.
Taking the works [7], [8] as a reference in the configuration of the 2D low-pass filter in Figure 2, the reference signal 𝒙1(𝒏𝟏,𝒏𝟐) is generated by passing white Gaussian noise with zero mean and unit variance through a 2D low-pass filter.
To determine the best parameters for the 2D-ARγ algorithm, the following phases were carried out:
Variation of 𝛼 and 𝛾 with 𝑚1fixed.
Variation of 𝛼 and 𝑚1with 𝛾 fixed.
Variation of 𝑚1and 𝛾 with 𝛼 fixed.
The variation of the parameters was performed between 0 and 1000 for each image. Once the values where the PSNR is higher were identified, we proceeded to search near those same parameters for new values that allowed us to obtain an even higher PSNR. The order of the 2D adaptive filter was set to N1 = N2 = 6. The algorithm was run once. Table 1 shows the optimal values found in the three phases of the procedure.
Table 1 Parameters comparison.
III. RESULTS
The functionality of the 2D adaptive algorithms is validated using real dental radiological images contaminated with Gaussian noise. The order of the 2D adaptive filter is set to 𝑵𝟏=𝑵𝟐=𝟔. The algorithm was run 20 times with different random seeds.
Figure 3 shows the radiological images used for the simulation. These images are available in an open-source database [9]. The access path to the images is as follows: DentalPanoramicXrays.zip → Images → 1.png, 29.png, 58.png, 116.png.
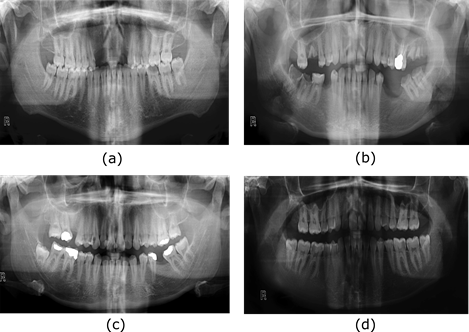
Table 2 presents some metrics used to compare the performance of the 2D adaptive filters in terms of image quality [3].
Table 2 Image quality measures [10].
| Image quality metric | Formula |
|---|---|
| MSE |
|
| RMSE |
|
| SNR |
|
| PSNR |
|
Where 𝑰 is the original image and y 𝑱 is the filtered image, 𝑴𝟏 and 𝑴𝟐 are the dimensions of the image.
The Mean Square Error (MSE) is the average of differences between the filtered and the reference images. A high MSE value indicates a degraded image, while zero MSE represents a perfect image. On the other hand, the Root Mean Square Error (RMSE) quantifies the standard deviation of the points concerning the fitted regression line. It is the square root of the mean square error and provides information about the accuracy of the fit. The Signal-to-Noise Ratio (SNR) is defined as the ratio of the signal power to noise power. This measure reflects how noise affects the visual quality of an image. Finally, the Peak Signal-to-Noise Ratio (PSNR) is a widely used metric to evaluate the quality of a restored image when it has been affected by noise and blur. It is calculated as the ratio between the maximum possible signal and the mean square error of the restored image.
A high SNR value indicates a low level of noise. On the other hand, a low RMSE value represents better image quality since it reflects a smaller difference between the filtered and the reference images. Finally, a higher PSNR value corresponds to higher image quality, indicating less distortion than the original image. [3]. Table 3 shows that the 2D-ARγ algorithm consistently produces slightly better results across all metrics compared to the 2D-LMS and 2D-NLMS algorithms.
Table 3 Comparative quality measurement values.
ANOVA (Analysis of Variance) tests were conducted along with the Turkey HSD (Honest Significant Difference) test to achieve statistical validity. The results are presented in Table 4. Three comparison groups were formed: LMS vs. ARγ, NLMS vs. ARγ, and LMS vs. NLMS. For each comparison, the 95% confidence interval and the corresponding p-value are provided. A significant difference is observed when the p-value is less than 0.01, leading to the rejection of the null hypothesis. There is no difference between the values obtained by ARγ and the LMS and NLMS filters.
Table 4 Results of the ANOVA + Turkey HSD test.
| Metric | Group | Confidence Interval (95%) | p-value |
|---|---|---|---|
| MSE | LMS vs. ARγ | (0.003923, 0.005326) | ≤ 0.001 |
| NLMS vs. ARγ | (0.001873, 0.00327) | ≤ 0.001 | |
| LMS vs. NLMS | (-0.002751, -0.001348) | ≤ 0.001 | |
| RMSE | LMS vs. ARγ | (0.01129, 0.01510) | ≤ 0.001 |
| NLMS vs. ARγ | (0.005523, 0.009326) | ≤ 0.001 | |
| LMS vs. NLMS | (-0.007676, -0.003873) | ≤ 0.001 | |
| SNR | LMS vs. ARγ | (-1.4593 y 0.24516) | ≤ 0.001 |
| NLMS vs. ARγ | (-1.1508, 0.38207) | ≤ 0.001 | |
| LMS vs. NLMS | (-0.6897 y 1.6287) | ≤ 0.001 | |
| PSNR | LMS vs. ARγ | (-0.7449, -0.5593) | ≤ 0.001 |
| NLMS vs. ARγ | (-0.4669, -0.2814) | ≤ 0.001 | |
| LMS vs. NLMS | (0.1851, 0.3707) | ≤ 0.001 |
From the table, we can identify significant differences for all metrics (p ≤ 0.001), indicating the statistical validity of the algorithm's performance. Therefore, we can assert that the ARγ algorithm presents a better performance compared to the LMS and NLMS filters.
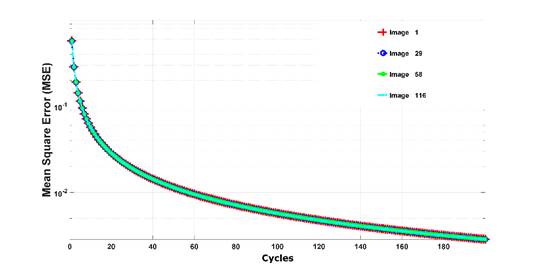
Figure 4 depicts the fast convergence of the 2D adaptive filter algorithms, and the MSE values approach zero at the iteration near 200. This indicates a significant computational efficiency of the 2D adaptive filter algorithms.
In the analysis of the output peak power performance of the 2D adaptive filter algorithms, different input PSNR values were used. Figure 5 shows the input and output PSNR values using the 2D-LMS, 2D-NLMS, and 2D-ARγ adaptive filter algorithms for various test images or changing noise conditions. It was observed that the performance of the 2D-ARγ adaptive filter algorithm was significantly more efficient in noise reduction compared to the other two algorithms. This was reflected in the output PSNR values, which indicated higher quality and lower distortion in the filtered images using the 2D-ARγ adaptive filter algorithm. Thus, the proposed algorithm demonstrates robustness against various noise conditions in the images, translating to the ability to handle different PSNR values in the input image.
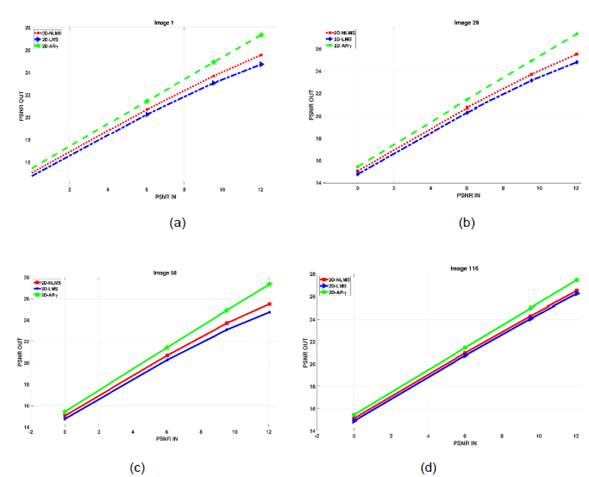
Fig. 5 Output PSNR versus input PSNR for 2D-LMS, 2D-NLMS, and 2D- ARγ. (a) image 1.png (b) image 29.png (c) image 58.png (d) image 116.png.
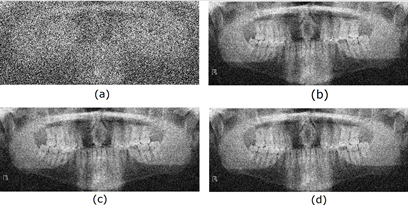
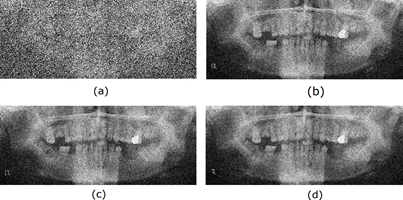
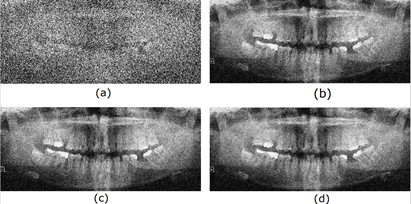
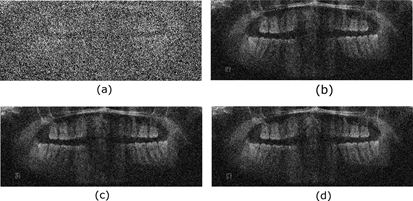
Finally, the radiological images restored using different adaptive filters are presented. Figures 6, 7, 8, and 9 show the noisy and restored images using different 2D adaptive filtering algorithms, respectively. From visual observation, it can be seen that the proposed filter produces a smoother version of the image and, thus, a slightly higher noise reduction compared to the LMS and 2D-NLMS algorithms. Furthermore, the proposed filter improves the visualization of the elements present in the image by more accurately highlighting transitions or edges. This enhancement means that details and structures of interest in the image become more discernible and can be appreciated with greater clarity.
IV. CONCLUSIONS
In this paper, for the first time, the use of the 2D-ARγ algorithm in noise reduction in dental radiological images is proposed. Three calibration phases were conducted for algorithm development. The performance of the 2D-ARγ adaptive filter algorithm was compared with that of other classical algorithms. To ensure a fair comparison, all conditions were determined according to recommendations from the literature. ANOVA and Turkey HSD analyses were performed on the obtained metric results, demonstrating statistically superior outcomes. In comparison with the LMS and 2D-NLMS algorithms, the proposed filter provides a favorable combination of noise reduction and enhanced visibility of elements in radiological images. These results support the efficacy and superior performance of the proposed adaptive filter in the context of radiological image restoration.
The application of this adaptive filter has the potential to contribute to higher quality and more accurate radiological images in dental diagnosis, which can have a positive impact on clinical practice and improve patient care.

