


 Inglês (pdf)
 Artigo em XML
 Referências do artigo
 Enviar este artigo por email
 Citado por SciELO
  Citado por Google
  Similares em
SciELO
Similares em
SciELO  Similares em Google
 Permalink
I. INTRODUCTION
Data science leverages data to support decision making and occupies a more important place within organizations every day. However, the data on which it is based are not always of adequate quality, thus promoting inadequate decision making. In this sense, Srivastava et al. [1] state that "high quality data is critical for effective data science".
Now, as Clarke [2] mentions, "the Big data literature, both academic and professional, focuses heavily on opportunities. Less attention has been paid to the threats that arise from reusing data, consolidating data from multiple sources, applying analytical tools to the resulting collections, drawing inferences and acting on them." In other words, much progress has been made in algorithms and data processing techniques, but aspects such as data quality have been neglected.
It is important to note that in any data-driven project, data quality verification becomes relevant. These specific tasks are mainly related to the validation of data ranges, the handling of missing data, the detection and handling of outliers in each attribute, among others [3]. However, at this stage there is no explicit emphasis on the analysis of the representativeness of the data initially collected in relation to the reality or the universe of the business that is expected to be modelling, a fact that can have negative consequences in the generated models.
Representativeness is defined as the level of participation of individuals as a combinatorial element of characteristics in the sample (or in the data available for the data science process). In more precise terms, it seeks to measure whether in a population, where two or more characteristics are studied, there is at least a minimum number of representatives of each combination of characteristics. For example, if the characteristics are type (private or public) and location (urban or rural), there is at least a certain number of elements of each combination: urban private, rural private, urban public, and rural public.
Thus, errors in the collection, construction, treatment, or sampling of the data set can have implications on the representativeness of the data, and these can lead to problems in the generated models. For instance, those outlined by Yapo and Weiss [4]: racism in the results of image searches, sexism in how advertising is displayed to people, and even discrimination against minorities in criminal risk software, which in general results in consequences that should be highlighted as a social problem. Supporting the above and from a more technical point of view, Polyzotis et al. [5] indicate that "for the development of reliable, robust and understandable machine learning models... it is necessary to build the model using high quality training data... the data supplied to the model at the time of service must be similar in distribution (and in features) to the training data, otherwise the accuracy of the model will decrease". It can then be concluded that quality data is required to obtain consistent and fair results in a social context.
Likewise, in big data contexts where it is thought that having a lot of data means that the whole population is represented, it is generally not clear how sampling is performed or if it is done at all. Rojas et al. [6] state that "sampling appears to be an important approach for exploring large datasets. However, as far as has been identified, there is no evidence in the literature on how data scientists use sampling techniques with Big Data, nor how those sampling techniques affect the quality or focus of their insights. Based on the lack of Big Data sampling tools available today, we maintain the hypothesis that data scientists are using random sampling..."
Following this line of thought, Schönberger and Cukier [7] mention that "random sampling has been a tremendous success and is the backbone of modern-scale measurement. But it is still a shortcut, a second-order alternative to collecting and analyzing the entire data set. It brings with it a few inherent weaknesses... If there are systematic biases in the way the data are collected that can make the extrapolated results grossly inaccurate". So, it is possible to conclude that, although sampling techniques are important elements in scientific studies, it is key to measure the level of representativeness of the constructed data sets to avoid possible biases in the generated models.
Currently, the mentioned problems, in terms of data quality and especially representativeness, have been addressed from statistics, through mathematical models, which generally compare data sets with external and much larger ones (such as censuses, seen as reference data) or rely on third party information to detect missing elements. However, in the context of Big Data, this task has become even more challenging. Considering all of the above, this paper presents the progress in the development of a new model to measure representativeness in datasets.
II. METHODOLOGY
In the methodology, two aspects are considered: materials that are divided into model, software, and data; and method that narrates the design of the experiment.
A. Tools
To measure representativeness in data sets, a model that was implemented through prototype software and will be tested with a recognized data set is proposed. Each of these elements will be explained in the following sections.
1) Model. The main algorithm uses a Coverage Array (CA) element called "P Matrix", Torres and Izquierdo [8] mention that CAs "are combinatorial objects that have been successfully used to automate the generation of software test cases. CAs have the characteristics of being of minimum cardinality (i.e., they minimize the number of test cases), and of maximum coverage (i.e., they guarantee the coverage of all combinations of a certain size among the input parameters)".
The above concept could be represented by the coverage array CA (5; 4, 2, 2, 2) presented in Table 1. This covering array has 5 rows (N), 4 parameters (k), it is binary (alphabet 2 -v- for the 4 columns), and strength 2 (t). Since it is a strength 2 array, combinations of values {0-0}, {0-1}, {1-0}, {1-1}, {1-1}, appear at least once for any combination of columns or parameters, as highlighted by Timaná et al. [9].
To verify that the coverage array complies with the minimum combinations established by the parameter, an element called Matrix P is used, as shown in Table 2. Each row counts the possible combinations with respect to the combinatorics between columns, the idea is that at least one record complies with the combinatorics.
Table 2 P Matrix.
| Column Merge vs. Data Merge | 00 | 01 | 10 | 11 |
|---|---|---|---|---|
| C1, C2 | 2 | 1 | 1 | 1 |
| C2, C3 | 2 | 1 | 1 | 1 |
| C1, C3 | 2 | 1 | 1 | 1 |
| C1, C4 | 1 | 2 | 1 | 1 |
| C2, C4 | 1 | 2 | 1 | 1 |
| C3, C4 | 1 | 2 | 1 | 1 |
For now, the model only evaluates binary type data and allows a general assessment of representativeness based on the data in the P matrix (Figure 1).
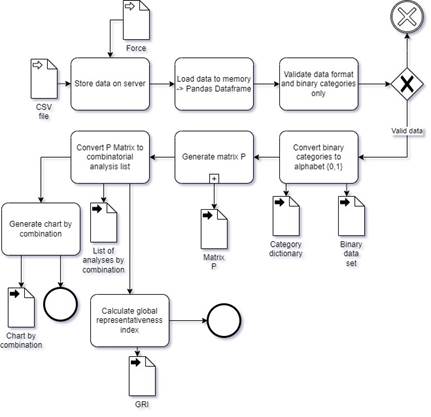
The representativeness index, i.e., the average of the percentage of the normalized incident count using MinMax, is used for the measurement.
2) Software. For the development of this project, an application called "Representativeness Meter" was developed (software available at https://github.com/alexander-castro/representativeness-https://github.com/alexander-castro/representativeness-front) (Table 3).
Table 3 Application technologies.
| Software | Version |
|---|---|
| Python | 3.10 |
| Flask | 2.2.2 |
| Scikit-learn | 0.20 |
| Pandas | 1.5.0 |
| Numpy | 1.23.4 |
| Vue | 3.2.45 |
| ChartJs | 3.9.1 |
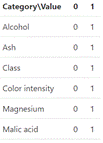
3) Data. The "Wine Data Set" [10] was used with the following adjustments: only two classes were taken, with a total of 130 records that were converted to binary considering whether they were above or below the mean. The columns used were "Alcohol, Malic acid, Ash, Magnesium, Color intensity, Class". Available at https://github.com/alexander-castro/representativeness/blob/main/uploads/paper_data.csv.
B. Method
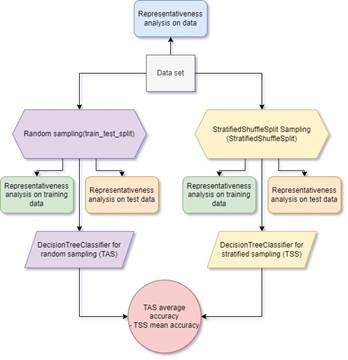
The experiment to be performed consists of comparing the representativeness of the data after using two classifiers-one random “train_test_split” and one stratified “StratifiedShuffleSplit”-and a tree classification algorithm “DecisionTreeClassifier” and the average accuracy metric, as shown in Figure 2.
III. RESULTS
The data set was transformed to binary data with conversion dictionary, as shown in Figure 3.
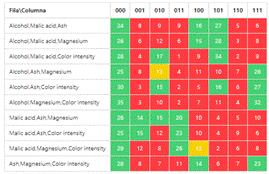
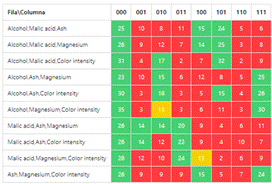
Data analysis was performed with the complete data set, thus obtaining the P Matrix shown in Figure 4.
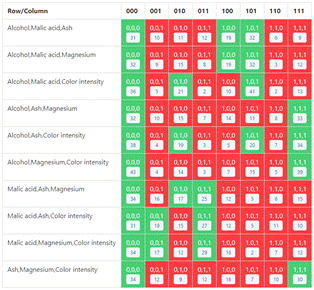
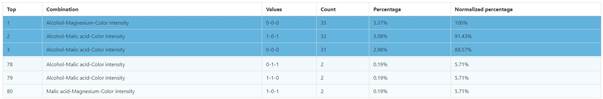
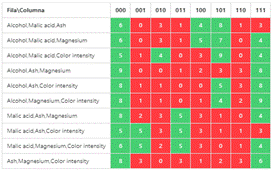
This model can be a little difficult to analyze, so the top three combinations of the three most representative and least representative forces are shown. Figure 5 presents the results; the last column shows the percentage of normalized representativeness.
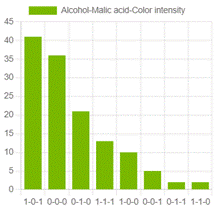
Analyzing all the records, the average percentage of representativeness was 34.76%. It is interesting to see how each combination behaves, for example, that of "Alcohol, Malic acid, Color intensity" can be seen in Figure 6.
Finally, the experiment is carried out as shown in Table 4 and Table 5.
IV. DISCUSSION
The representativeness analysis based on the method of checking the coverage arrays shows poorly attended combinations within a data set, it is an exhaustive task that can be time consuming according to the strength to be analyzed. But it is interesting to see how common combinations can be either over represented or under represented. For example, Figure 4 shows how the combination of "Alcohol, Magnesium, Color intensity" for the values "0,0,0" i.e., the three below the overall average, has forty-three elements but the combination "0,1,1" i.e., Alcohol below the average and "Magnesium, Color intensity" above has only three. The question for researchers would be Is this combination really uncommon? Or maybe the way the sample was taken had to do with the low representativeness? (for example, if it was taken in a specific region where these indicators have a certain tendency).
It can be complex to answer sampling questions, but this can be the key to having more robust models, especially when looking for algorithms to be more inclusive. Now, the overall representativeness indicator is still too naive and does not give a useful approximation to the researcher, but it is an interesting starting point to understand how complete a dataset is without taking into account reference data.
Finally, it is clear that there are several ways to select data to train and evaluate an algorithm, e.g., for classification. However, the way this separation is done may depend on the results of the model, it does not mean that a higher representativeness makes a more accurate model, but it can be a fairer starting point for algorithms that take into account most possible scenarios.
V. CONCLUSIONS
The representativeness of the data is often not taken into account in the data science process, and the consequences can be serious, especially when the algorithms are intended to have an equitable approach. Therefore, it is necessary to perform early assessments of data quality to avoid having biased models due to incomplete data. In this sense, problems such as class imbalance have been studied in depth, but the analysis of the remaining data requires more work.
A naive model that requires more iterations but gives an initial taste of how to measure representativeness in data sets, which is not so common, was proposed. The challenge lies in evolving the model to support categorical, continuous data, and, above all, establish metrics that can be interpreted by scientists and allow them to make better decisions regarding the sampling of their data.
Finally, it is important to emphasize that the creation of indicators must go hand in hand with visual aids that allow understanding different aspects of the data analyzed; the use of colors and different types of graphics to understand the analyses proposed here has been positive.

