


![Synthesis and Spectroscopic Characterization of the Products Derived from the Reaction of [Ru3(CO)12] with the Chloroaryliderhodanine Ligand](/img/en/prev.gif)


Services on Demand
Journal
Article
 English (pdf)
 Article in xml format
 Article references
 Send this article by e-mail
Indicators
-
 Cited by SciELO
 -
 Access statistics
Related links
-
 Cited by Google
 -
 Similars in
SciELO
Similars in
SciELO -
 Similars in Google
Share

 Permalink
Revista de Ciencias
Print version ISSN 0121-1935
rev. cienc. vol.18 no.1 Cali Jan./June 2014
Electrochemical Characterization of Mass Transport at Microelectrode Arrays
Walter Torres Hernández
Electrochemistry Research Group, Department of Chemistry: Universidad del Valle, Cali - Colombia
E-mail: walter.torres@correounivalle.edu.co
Received: June 6, 2014
Accepted: August 28, 2014
Abstract
Electrodes with dimensions in the micro- and nano-meter scale can be used as analytical probes in confined places such as cells and organelles. Arrays of microelectrodes, particularly disk-shaped electrodes, are now a platform to fabricate electrochemical sensors and multisensors. A useful characteristic of such arrays is that enhancement of the current signal is due to the fact that radial diffusion becomes important as the disk radius gets smaller and steady state currents are attainable in a relatively short time. Because there is no general analytical solution for the current response at MEAs, previous characterization of any micro electrode array at hand is still required. This paper discusses the electrochemical characterization of the mass transport of a reversible electrochemical probe at a commercially available micro-disk electrode array by two commonly used tools for electro analysis, namely: cyclic voltammetry and chronoamperometry. The questions to be addressed are whether clear radial diffusion control can be effectively achieved and the time required for the electrode system to reach steady state. For chronoamperometric experiments, the current response almost achieves steady state in the time range between 0.49 s and 1 s. This is precisely the time bracket in which analytical measurements should be made in order to achieve high sensitivity.
Keywords: Microelectrode arrays.
1. Introduction
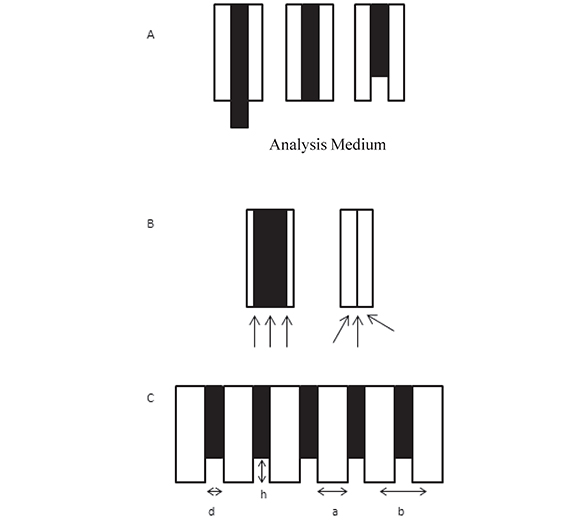
Electrodes with surfaces in the micro- and nano-meter scale are popular in electroÂanalysis because they can be used as probes in places that are inaccessible to larger electrodes (Arrigan, 2004). In addition, mass transport of electro-active species to micro and nanoÂelectrodes is enhanced with respect to macro-electrodes thus larger current densities are achievable as the electrodes get smaller. Mass transport and current response depend on whether the electrode is inlaid, recessed or protruding from the electrode shrouding (Figure 1). Many fields of work benefit from these analytical tools. For instance, it is now possible to monitor small quantities of electro-active molecules of biomedical and pharmacological interest in individual cells and organelles both in vitro and in vivo (Vaddiraju et al., 2010).
Figure 1. A. Schematic representation (side view) of three types of disk electrodes (black): protruding, inlaid and recessed in an insulating shroud (white) in contact with an analytical medium. B. Scheme of diffusion modes to an inlaid electrode surface: semi-infinite linear diffusion for a "macro" disk and enhanced, radial diffusion to a micro-disk. C. Scheme of a recessed disk electrode array where d is the disk diameter, h is the recess height with respect to the external surface of the insulating layer, a is the disk edge-to-edge distance, and b is the disk center-to-center distance.
The electrochemistry laboratory at Universidad del Valle is interested in the application of platform technologies for the design and fabrication of electrochemical and optoÂelectrochemical biosensors. To this end, arrays of microelectrodes are of interest (Morf et al., 2006) because of the much larger current signals attainable with these arrays compared to those with single electrodes (Berduque et al., 2007; Freeman et al., 2013) and because these arrays can be incorporated within analytical microsystems (biochips) (Albers et al., 2003). The electrodes in the array are fabricated in a variety of configurations and shapes (Daniele et al., 2006) among which, disk-shaped electrodes are perhaps the most commonly used. Geometric factors such as size, shape and position of the individual metal disk electrodes (inlaid, protruding, recessed) with respect to the insulating substrate as well as the time dependent evolution of the individual disk diffusion layer thickness with respect to the electrode-to-electrode separation affect the current response of the micro electrode arrays, MEAs (Amatore et al., 2006a; 2006b).
At the micro-disk electrode, enhancement of the current signal results from the fact that radial diffusion becomes important as the disk radius gets smaller and one hopes to achieve and maintain steady state currents in a relatively short experimental time. This results in a larger sensitivity and a faster response time of the micro-disk sensor not to mention that steady state conditions make the math used for quantification simpler. In MEAs, steady state currents may be achieved in the time bracket at which the radial diffusion layers about the individual microelectrodes do not overlap and there is a current interest in optimization of electrochemical response of MEAs through selection of disk diameters and electrode separation (Chevallier et al, 2006; Justin et al., 2009). In practice, as there is no general analytical solution for the current response at MEAs, previous characterization of the MEA at hand is still required in order to use it for analytical purposes.
Here, I discuss the electrochemical characterization of the mass transport of a reversible electrochemical probe, ferrocenecarboxylic acid, at a commercially available micro-disk electrode array by two commonly used tools for electronalysis, namely, cyclic voltammetry and chronoamperometry. The questions to be addressed are whether clear radial diffusion control can be effectively achieved and the time required by the electrode system to reach steady state.
2 Experimental
2.1 Materials and reagents
Ferrocenecarboxylic acid (FcCO2H, CAS # 1271-42-7), from Sigma Aldrich, was used as received except for a control experiment in which this compound was purified over alumina and recrystallized from methanol.
2.2 Electrodes, Electrochemical Cell and Instrumentation
Electrochemical experiments were carried out with a BAS 100BW electrochemical workstation in a three-electrode cell under an Ar blanket. A platinum mesh (2 cm2) was used as the auxiliary electrode. Gold micro-disk electrode arrays (MEA250Au) and micro Ag/AgCl electrodes, both from Abtech Scientific (Richmond, VA), were used as working and reference electrodes, respectively. The working electrodes were hexagonal arrays of 207 recessed micro-disks, fabricated by photolithographic techniques, each with a 0.1 cm2 collective electrode area. Each micro-disk resides at the bottom of a cylindrical cavity etched through the Si3N4 passivation layer. The diameter of each disk, the center-to-center separation, and the recessed depth are therefore 250, 500, and 0.5 µm, respectively.
2.3 MEA Cleaning and Polishing
Electrode arrays were first cleaned by sequentially dipping in hot trichloroethane, isopropanol, acetone, aqueous hydrogen peroxide/ammonia (4:1:1) and then washed profusely with deionized water as described elsewhere (Guiseppi-Elie et al., 2005). The electrochemical polishing procedure consisted of a series of potential cycles between 0 and 1.5 V vs. Ag/AgCl (at 100 mV/s) in a 0.1 M KH2PO4 solution (pH 4.2).
2.4 Electrode Characterization and Calibration Curves
MEA electrodes were characterized by cyclic voltammetry, chronoamperometry, and differential pulse voltammetry in aqueous solutions containing 1.0 mM FcCO2H in 0.1 M phosphate buffer at pH 7.2 at room temperature.
3 Results and discussion
3.1 Electrode array area
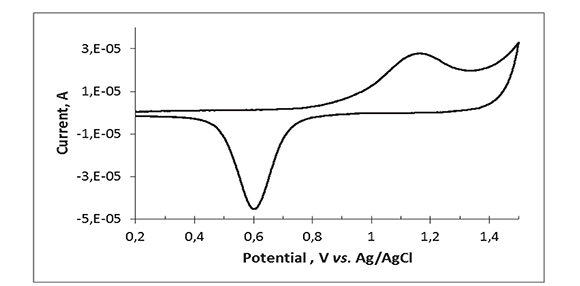
The surface of gold electrodes develops an AuO monolayer when the electrode is oxidized at potentials > 0.9 V in aqueous media (Hoare, 1984). The electrochemically active area of the gold micro-electrode array was estimated by continuously sweeping the potential of the electrode between 0 and 1.5 V in 0.1 M phosphate buffer pH 4.0 until the voltammogram became stable and then integrating the sharp cathodic peak at ca. 0.62 V, which corresponds to the reduction of gold oxide (Figure 2). As the reduction of one monolayer of AuO to Au(111) is known to yield 0.482 mC/cm2 (Oesch, & Janata, 1983), the estimated area of the Au array is 0.089 cm2, closer to but lower than the nominal area of 0.1 cm2, presumably indicating that not all of the disk array area is available for electrochemistry.
Figure 2. Cyclic voltammogram for the Au micro-disk electrode array in aqueous phosphate buffer, pH 4.2 at 20 oC. Scan rate = 100 mV/s
3.2 Mass transport to the electrode array
At regular, recessed disk arrays, voltammetry and chrono-amperometry experiments are characterized by the developing of diffusion regions first within the individual electrode cavities and then outside the external insulating surface of the array. For electrode arrays with disk diameters in the micro- and submicrometer range and sufficiently large electrode separation, the voltammetric/chronoamperometric currents become controlled by radial mass transport as the diffusion region outgrows the disk diameter providing the experiment time scale is not too long as to prevent merging of the individual electrode diffusion zones (Bartlett & Taylor, 1998; Davies et al. 2005).
In our experiments, the Au electrode array is a hexagonal array of 207 recessed disks characterized by individual disk diameter and center-to-center electrode separation = 250 and 500 µm, respectively (confirmed by Electron Scanning Microscopy), and recess depth = 0.5 µm. Thus, the recess-to-disk diameter ratio is only 0.002 and the voltammetric and transient currents at our recess electrode are expected to be very close to those at inlaid disk electrodes of the same area. The length of the diffusion layer, δ, is equivalent to the root mean square displacement, ![]() Einstein's equation:
Einstein's equation:

Where t is the time of displacement and D is the diffusion coefficient of the traveling particle. For ferrocenecarboxylic acid, D = 5x10⁻⁶ cm2/s at 20 oC, thus, the diffusion layer will reach the mouth of the recess in 0.3 ms and δ becomes comparable to the diameter of a single disk in ca. 63 s. This is also the time at which adjacent diffusion layers overlap because the closest electrode edge-to-edge distance is the same as the disk diameter. The issues to be addressed by experiment are the time regimes in which radial diffusion predominates over semi-infinite linear diffusion and how long does it take for the system to reach steady state.
Voltammograms recorded at scan rates higher than ca. 50 mV/s are peak shaped, characteristic of mass transport controlled by semi-infinite linear diffusion. As the scan rate decreases, the peaks become less prominent and the voltammograms show a sigmoidal shape with some hysteresis, indicating partial contribution of radial diffusion to the current. For a single macro disk electrode, a plot of peak currents as a function of the square root of scan rate should be linear following the Randless Sevcik equation. This is not the case for the MEA in this series of experiments as shown in Figure 3B, where white and black squares represent cathode and anodic peak currents, respectively. In this Figure, current peaks are linearly dependent on the square root of the scan rate in the range between 2 and 100 mV/s. As the scan rate increases beyond 100 mV/s, the slope is lower and the data scatter is higher presumably because of charging current and IR drop effects.
Figure 3. Cyclic voltammetry for 1.0 mM FcCO2H at the Au micro-electrode array in aqueous phosphate buffer, pH 7.2 at 20 oC. A. Scan rate in mV/s: 100 (continuous line), 20 (dashed line), and 2 (dotted line). B. Voltammetric peak currents (black squares, anodic; white squares, cathodic) as a function of the square root of the scan rate. Continuous lines represent linear fits; the dashed line represents the calculated anodic-peak current for a single planar electrode of area = 0.089 cm2 under semi-infinite linear diffusion.
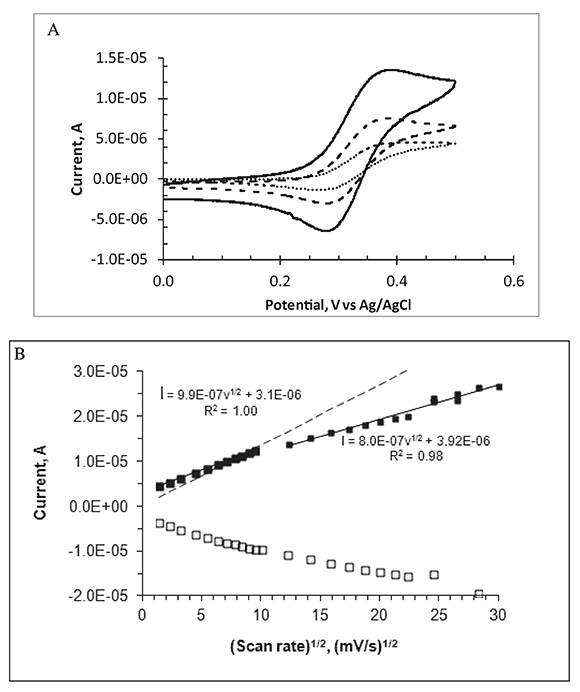
Figure 3B displays the cyclic voltammetric current peaks as a function of scan rate for the FcCO2H/(FcCO2H)+ redox couple, used here as an example of a reversible one-electron redox couple. The dashed line represents the expected peak currents for a one-electron reversible voltammetric oxidation of an electroactive species under semi-infinite linear diffusion conditions, (Randless Sevcik equation). In this calculation, we use electrode area = 0.089 cm2 and D = 4.5x10⁻⁶ cm2/s for FcCO2H as reported values for the diffusion coefficient of this species are in the range 4.4 to 5.7x10⁻⁶ cm2/s at room temperature (Bartlett & Pratt, 1995). It is clear that the experimental peak currents become higher than the Randles-Sevcik currents at scan rates below 60 mV/s.
In summary, these observations indicate a gradual increase in the importance of radial diffusion at low scan rates. They also suggest that IR drops become important at high scan rates making the current peaks smaller than expected by simple linear diffusion standards and the apparent advantage of the micro-disk array is only observed in a limited range of scan rates. An almost true steady state mass flux (of the redox species to and from the electrode array) is achieved in the lowest scan rate zone (2 mV/s). Steady state currents can also be achieved with macro-disk electrodes at very low scan rates.
Because the pKa value for the oxidized FcCO2H is in the range 6.1-6.3, in mixed aqueous solvents, (Little & Eisenthal, 1961) and that of the oxidized acid is ca. 3.4 (Benito, 1997), this redox couple is better represented by (FcCO2-)/(Fc+CO2-) at the pH of the experiment.
The time scale at which steady state is achieved in the MEA upon a potential transient experiment is observed in Figures 4 and 5, which show the chronoamperometric response of the disk array electrode in a FcCO2H solution at pH 7.4 following a potential step from 0 to 0.5 V (continuous, noisy trace). The dashed line represents the theoretical chronoamperogram of an electrode of the same total area subject to a potential step sufficiently high that the transient current is controlled by semi-infinite linear diffusion (Cottrell equation). The continuous soft curve is the analytical solution for the steady state current of a collection of N micro-disk electrodes of radius r = 125 μm:

Figure 4. Experimental chronoamperogram for the Au micro-electrode array in 1.0 mM FcCO2H upon potential step from 0.0 to 0.5 V vs. Ag/AgCl (continuous, noisy trace). Calculated Cottrellian (dashed line) and Shoup-Szabo (continuous line) current transients for 190 disks of r = 125 μm each.
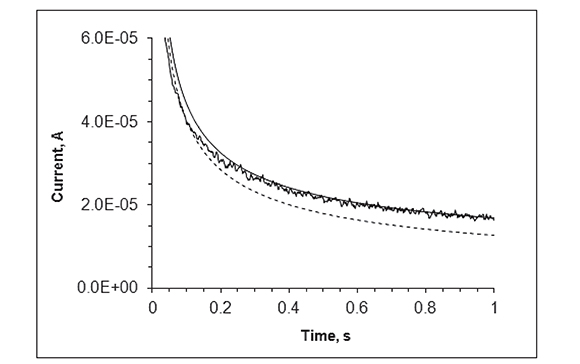
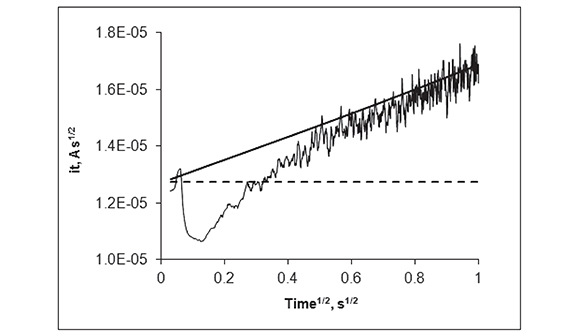
Figure 5. Same data as in Figure 4 plotted as the product of it1/2 as a function of t1/2; continuous trace: Experimental current at the MEA; dashed line: Predicted behavior (Cottrell equation) of a single disk electrode (with the same total area as that of the MEA) under semi-infinite diffusion; continuous straight line: Predicted behavior of 190 individual micro-disk electrodes (Shoup and Szabo equation) of r = 125 μm eachc
where N =190 (the number of electrodes with a collective area of 0.089 cm2). This equation (Aoki & Osteryoung, 1981; Aoki & Osteryoung, 1984), which predicts attainment of steady state, contains a dimensionless parameter, τ, which represents the squared ratio of the diffusion length to the disk radius:

and an empirical function f(t). Here we use the solution to f(t) proposed by Shoup and Szabo (Shoup & Szabo, 1982)

Figure 5 displays the same data as in Figure 4 as a (currentÃt1/2 vs. t1/2) plot. In this kind of plot, a current transient that decays with t-1/2 (perfect Cottrellian behavior) is transformed into a flat line, with slope = 0, and a stationary current is transformed into a straight line with positive slope. This Figure clearly shows that the current at the recessed disk array becomes very close to that of a collection of inlaid disks with individual radial diffusion layers at ca. 0.49 s (0.7s1/2). Although it is strictly for inlaid electrodes, equation (2) still predicts, with a very high accuracy, the maximum response attainable at very shallow disks when the recess height/disk diameter is very small (Davies et al., 2005). In this case, recess height/ disk diameter < 0.1). In Figure 5, the transformed data shows an initial spike that reflects electrode double layer charging. As the experiment proceeds, the data becomes noisy presumably because of convection of the analytical solution.
4. Conclusions
The cyclic voltammetric response of ferrocenecarboxylic acid, at a commercially available micro-disk electrode array (hexagonal array of 207 microdisks, total area = 0.089 cm2), shows an enhanced current signal in the slow scan rate regime (below 60 mV/s). At higher scan rates, the results suggest that IR drops decrease the current response of the electrode array. In chronoamperometric experiments, the current response almost achieves a steady state condition in the time range between 0.49 s and 1 s. This is precisely the time bracket in which analytical measurements should be made in order to achieve high sensitivity.
Acknowledgements
This paper is based on the author's work in the Center for Bioelectronics, Biosensors
References
Albers, J., Grunwald, T., Nebling, E., Piechotta, G., & Hintsche, R. (2003). Electrical Biochip Technology: A Tool for Microarrays and Continuous Monitoring. Analytical and Bioanalytical Chemistry, 377 (3), 521-527. [ Links ]
Amatore, C., Oleinick, A. I., & Svir, I. (2006a). Construction of Optimal Quasi-conformal Mappings for the 2D-numerical Simulation of Diffusion at Microelectrodes. Part 1: Principle of the Method and its Application to the Inlaid Disk Microelectrode. Journal of Electroanalytical Chemistry, 597 (1), 69-76. [ Links ]
Amatore, C., Oleinick, A. I., & Svir, I. (2006b). Construction of Optimal Quasi-conformal Mappings for the 2D Numerical Simulation of Diffusion at Microelectrodes.: Part 2. Application to Recessed or Protruding Electrodes and Their Arrays. Journal of Electroanalytical Chemistry, 597 (1), 77-85. [ Links ]
Aoki, K., & Osteryoung, J. (1981). Diffusion-controlled current at the stationary finite disk electrode: Theory. Journal of Electroanalytical Chemistry and Interfacial Electrochemistry, 122, 19-35. [ Links ]
Aoki, K., & Osteryoung, J. (1984). Formulation of the diffusion-controlled current at very small stationary disk electrodes. Journal of Electroanalytical Chemistry and Interfacial Electrochemistry, 160 (1), 335-339. [ Links ]
Arrigan, D. W. M. (2004). Nanoelectrodes, Nanoelectrode Arrays and Their Application. Analyst, 129 (12), 1157-1165. [ Links ]
Bartlett, P. N., & Pratt, K. F. E. (1995). A Study of the Kinetics of the Reaction Between Ferrocene Monocarboxylic Acid and Glucose Oxidase Using the Rotating-disc Electrode. Journal of Electroanalytical Chemistry, 397 (1), 53-60. [ Links ]
Bartlett, P. N., & Taylor, S. L. (1998). An Accurate Microdisc Simulation Model for Recessed Microdisc Electrodes. Journal of Electroanalytical Chemistry, 453 (1), 49-60. [ Links ]
Benito, A., Martínez-Máñez, R., Soto, J., & Tendero, M. J. L. (1997). Predicting the maximum oxidation potential shift in redox-active pH-responsive molecules in their electrostatic interaction with substrates. Journal of the Chemical Society, Faraday Transactions, 93 (12), 2175-2180. [ Links ]
Berduque, A., Lanyon, Y. H., Beni, V., Herzog, G., Watson, Y. E., Rodgers, K. et al. (2007). Voltammetric Characterisation of Silicon-based Micro-electrode Arrays and their Application to Mercury-free Stripping Voltammetry of Copper Ions. Talanta, 71 (3), 1022-1030. [ Links ]
Chevallier, F. G., & Compton, R. G. (2006). Regular Arrays of Microdisk Electrodes: Numerical Simulation as an Optimizing Tool to Maximize the Current Response and Minimize the Electrode Area Used. Electroanalysis, 18 (23), 2369-2374. [ Links ]
Daniele, S., DelFaveri, E., Kleps, I., & Angelescu, A. (2006). Voltammetric Characterization of Micro- and Submicrometer-Electrode Arrays of Conical Shape for Electroanalytical Use. Electroanalysis, 18 (18), 1749-1756. [ Links ]
Davies, T. J., Ward-Jones, S., Banks, C. E., del Campo, J., Mas, R., Munoz, F. X., & Compton, R. G. (2005). The cyclic and linear sweep voltammetry of regular arrays of microdisc electrodes: fitting of experimental data. Journal of Electroanalytical Chemistry, 585 (1), 51-62. [ Links ]
Freeman, N. J., Sultana, R., Reza, N., Woodvine, H., Terry, J. G., Walton, A. J., et al. (2013). Comparison of the Performance of an Array of Nanoband Electrodes with a Macro Electrode with Similar Overall Area. Physical Chemistry Chemical Physics, 15 (21), 8112-8118. [ Links ]
Guiseppi-Elie, A., Brahim, S., Slaughter, G., & Ward, K. R. (2005). Design of a subcutaneous implantable biochip for monitoring of glucose and lactate. IEEE Sensors Journal, 5 (3), 345-355. [ Links ]
Hoare, J. P. (1984). A Cyclic Voltammetric Study of the Gold-oxygen System. Journal of the Electrochemical Society, 131 (8), 1808-1815. [ Links ]
Justin, G., Rahman, A. R. A., & Guiseppi-Elie, A. (2009). Bioactive hydrogel layers on microdisk electrode arrays: cyclic voltammetry experiments and simulations. Electroanalysis, 21 (10), 1125-1134. [ Links ]
Little, W., & Eisenthal, R. (1961). Acid Constants of Hetero-annular Substituted Ferrocenoic Acids. Journal of Organic Chemistry, 26, 3609-3610. [ Links ]
Morf, W. E., Koudelka-Hep, M., & de Rooij, N. F. (2006). Theoretical Treatment and Computer Simulation of Micro-electrode Arrays. Journal of Electroanalytical Chemistry, 590 (1), 47-56. [ Links ]
Oesch, U., & Janata, J. (1983). Electrochemical Study of Gold Electrodes with Anodic Oxide Films-I: Formation and Reduction Behaviour of Anodic Oxides on Gold. Electrochimica Acta, 28 (9), 1237-1246. [ Links ]
Shoup, D., & Szabo, A. (1982). Chronoamperometric current at finite disk electrodes. Journal of Electroanalytical Chemistry and Interfacial Electrochemistry, 140 (2), 237-245. [ Links ]
Vaddiraju, S., Tomazos, I., Burgess, D. J., Jaind, F. C., & Papadimitrakopoulos, F. (2010). Emerging Synergy Between Nano-technology and Implantable Biosensors: A Review. Biosensors and Bioelectronics, 25 (7), 1553- 1565. [ Links ]

Revista de Ciencias por Universidad del Valle se encuentra bajo una licencia Creative Commons Reconocimiento 4.0.

