


 English (pdf)
 Article in xml format
 Article references
 Send this article by e-mail
 Cited by SciELO
  Cited by Google
  Similars in
SciELO
Similars in
SciELO  Similars in Google
 Permalink
1 Introduction
Microbial fuel cells (MFCs) form part of an emerging technology that makes it possible to deal with two of the major problems facing society today: water availability and energy 1. MFCs are electrochemical devices that convert the energy stored in organic molecules into electricity by means of the metabolism of microorganisms grown in an anaerobic environment 2-4. These devices provide a sustainable way of using biomass as a source of electricity for several applications most of which are being tested under laboratory conditions. One of such applications is the possibility of making wastewater treatment process sustainable, by using part of the energy stored in wastewater for the operation requirements of wastewater treatment plants 1,5,6. Several authors 7-10 have implemented laboratory scale MFCs for the treatment of wastewater of several origins, while evaluating the amount of power produced by them. Efforts have been mainly concentrated in: i) the design of the reactor 11-13; ii) the modification of electrodes or modification of new materials used as electrodes 14-16; and iii) the characterization of the diversity of the microbial community within these devices 17-19.
Different substrates have been tested so far to analyze their effect in MFC performance in terms of the amount of electricity generated and chemical oxygen demand (COD) removal. These can be divided into synthetic substrates, such as solutions with a single compound as a source of carbon, and real substrates, such as hospital wastewater 20, slaughterhouse wastewater 21, brewery wastewater 22 and municipal wastewater 20,23. In terms of diversity studies performed on MFC, Phung, et al. 24 assessed the bacterial diversity in two oligotrophic MFC, one fed with river water and the other with artificial wastewater with acetate. Authors found a shift in microbial communities of the MFC when compared with the river sediment communities used as inoculum. Sequencing of 16S rDNA showed that 80% of bacteria found in the anode belonged to the Proteobacteria (α-Proteobacteria outnumbering other phyla in the acetate fed MFC and β-Proteobacteria outnumbering in the river water fed MFC). Other publications reinforce the predominance of the Proteobacteria in electricity generating bacterial communities 25,26 and the variation in microbial community composition related with variation in carbon sources used to feed the bacteria.
Works on MFC fed with domestic wastewater have evaluated the performance of these devices on the basis of the current produced using a fixed resistance or by means of the elaboration of polarization curves to find the maximum power density at a given time of operation, while a monitoring of this parameter in time following changes in substrate concentration or substrate origin has not been evaluated 22,27,28. Furthermore, examination on the structure of the anode biofilm have been mainly elaborated using molecular approaches while direct observation of the anode surface under changing conditions of operation has been scarce 29. This work aims to evaluate the electrogenic activity of microorganisms from a septic tank of a domestic wastewater treatment plant when fed with domestic wastewater in a MFC by monitoring the evolution of cell voltage and current density. Additionally, this work seeks to characterize the microbial diversity in MFC using molecular and traditional microbiological methods.
2 Material and Methods
2.1 Microbial Fuel Cell Design and Operating Conditions
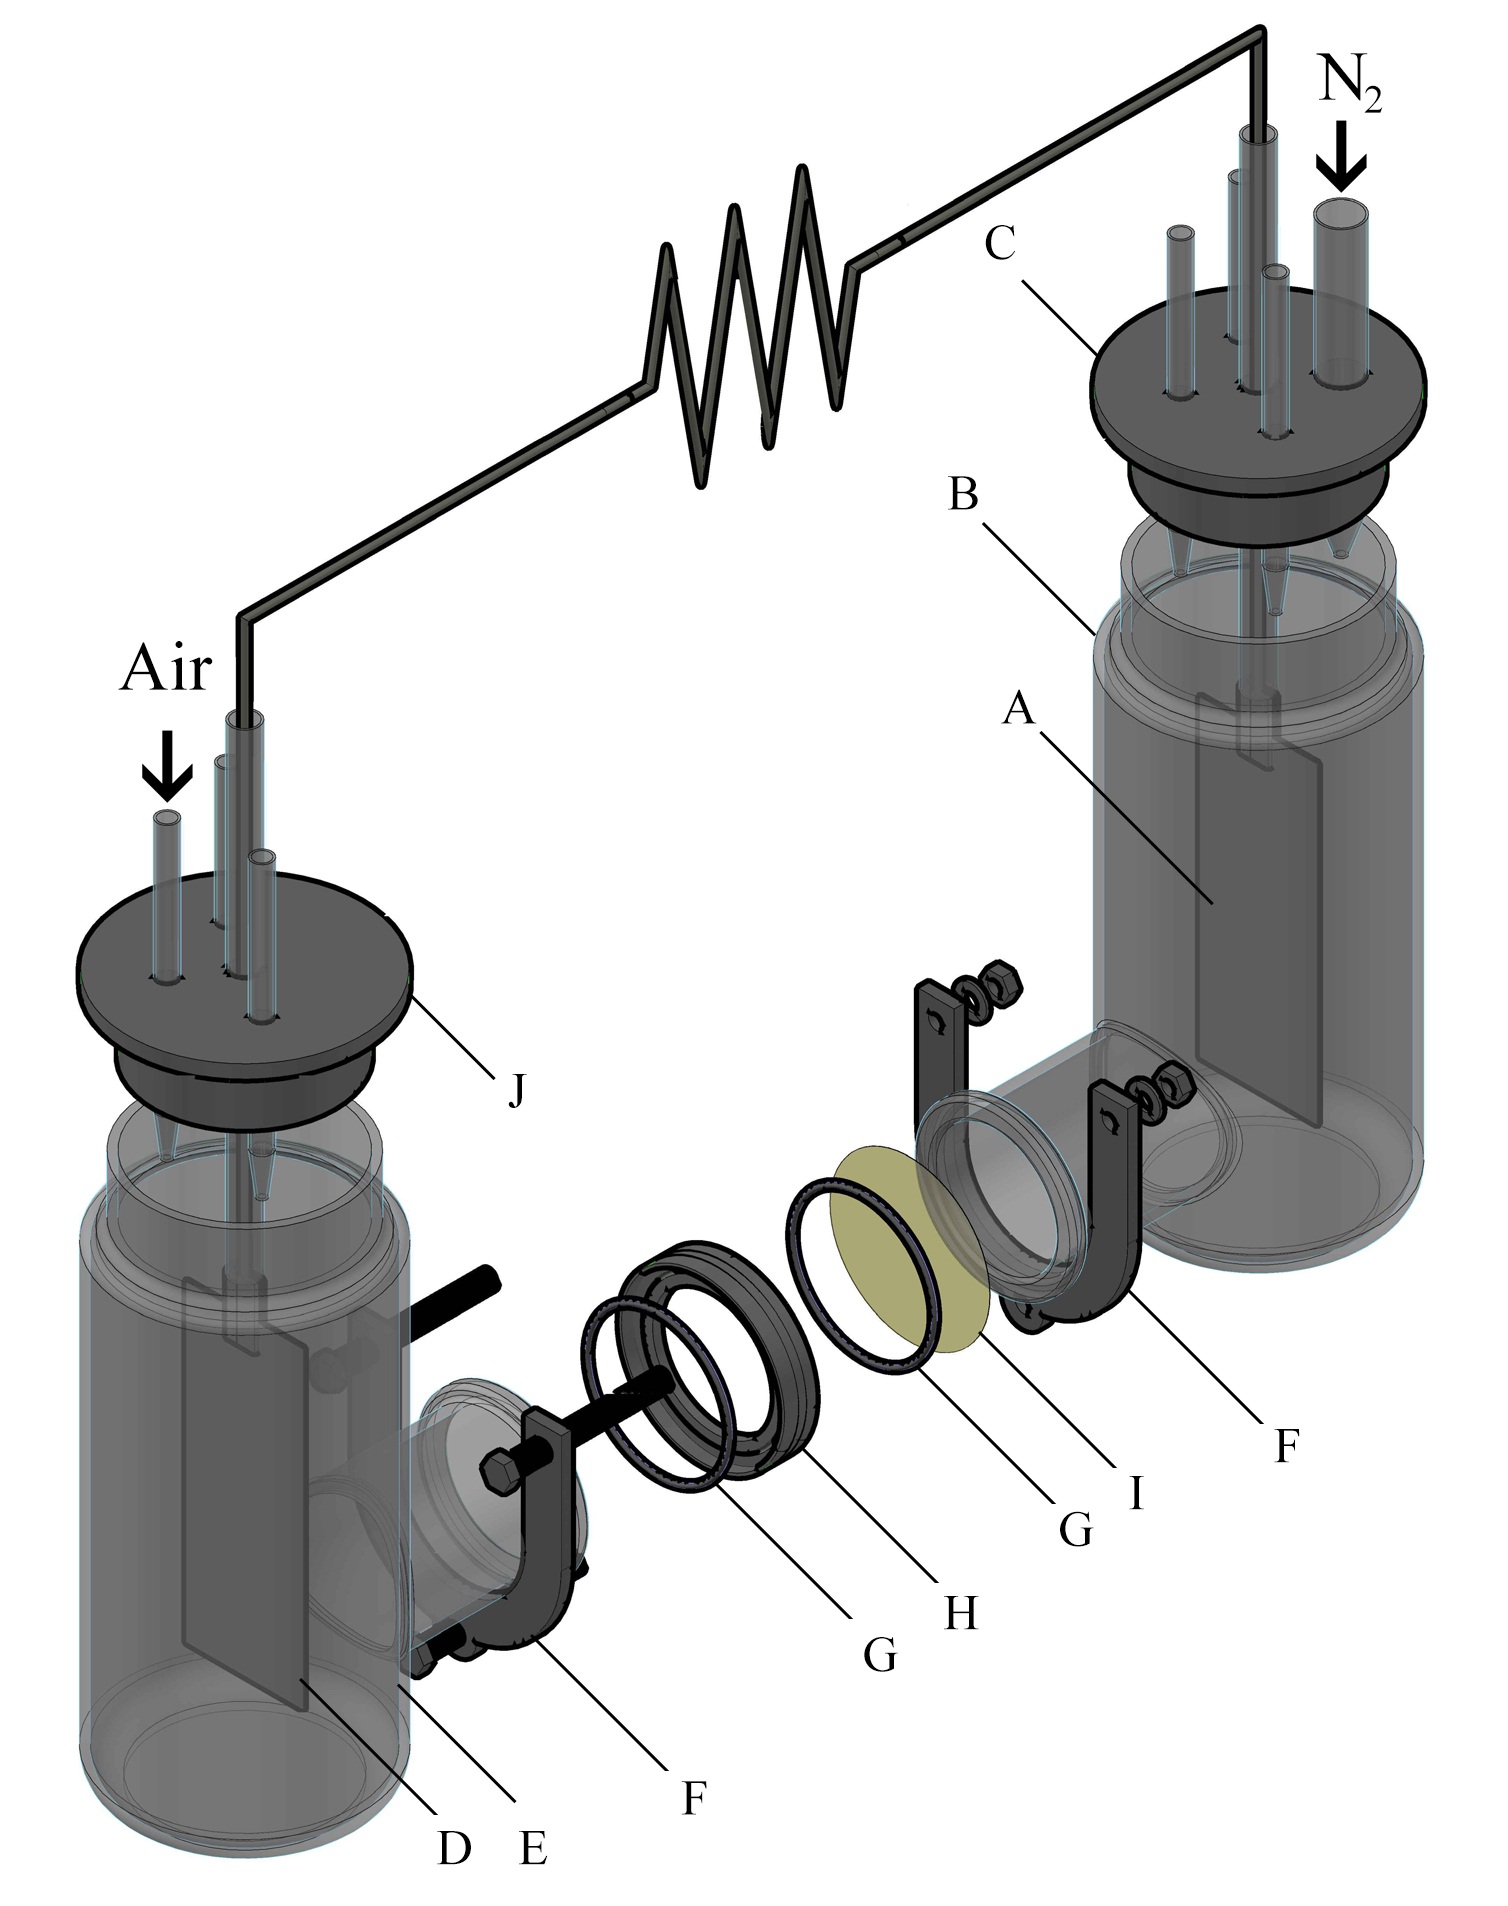
A two chambered MFC was constructed with two cylindrical containers of 250 mL of working volume each. The containers were opened at the sides and connected with glass flanges of 38 mm of length and 32 mm of internal diameter. In the middle of the flanges a Nafion® 117 membrane was located using a Teflon® ring for adjustment. The membrane was fixed using a stainless steel clamp. Two pieces of carbon cloth were treated with heat and nitric acid for organic contamination removal and then used as anode and cathode. The anode had a geometric area of 51.9 cm2 on which the biofilm was later formed. The cathode had 40.8 cm2 of geometric area and it was covered with Pt/C catalyst (0.2 mg cm-2) by painting. The electrodes were connected to an external circuit with a fixed load of 100 Ω in order to set the MFC in operation. The anodic chamber was fed in batch mode using filtrated sterilized synthetic wastewater with the composition suggested by Mathuriya and Sharma 30 with D-glucose as carbon source for the enrichment and acclimation of the microbial community for approximately 2 weeks before feeding with real wastewater for the rest of the experiment. The anodic chamber was maintained with permanent N2 bubbling in order to guarantee anaerobic conditions. The cathode was maintained in a 250 mL volume of milli Q water saturated with air provided by a peristaltic pump. The MFC was kept in a thermostat at a constant temperature of 27 ºC. Figure 1 shows the overall arrangement of the MFC with all the components.
2.2 Substrate and Inoculum Source
Domestic wastewater was obtained at the entrance of the septic tanks of a domestic wastewater treatment plant in La Vorágine, at the outskirts of Cali, Colombia. Wastewater was obtained every 3 days when it was required to feed the MFC, once organic matter was depleted in each batch cycle. A sample of 2.5 grams of bottom sludge of the septic tank was used as a source of microorganisms to inoculate the anode chamber of the MFC at the beginning of the experiment.
2.3 Electrochemical Monitoring and Chemical Analyses
Cell potential vs current density curves were obtained daily using the galvanostatic discharge method 31 using resistances from 1 Ω to 800 kΩ, after voltage stabilization. This information was also used to obtain daily curves of power density vs. current density (normalized to the anode surface area) in order to monitor the evolution of maximum power density as function of time. Electrochemical performance was also evaluated by measuring the current every 12 hours using an external resistance of 100 Ω. During the last batch, anolyte’s COD and dissolved organic carbon (DOC) were determined to quantify the amount of organic matter removed by the system and the coulombic efficiency (CE) was determined for this batch cycle using the resistance producing the maximum power density.
2.4 Secondary Electron Imaging
Pieces of the anode of about 0.25 cm2 were removed at the end of the synthetic wastewater (SW) and real wastewater (RW) feeding stages and they were fixed in a 3% glutaraldehyde solution and dehydrated with increasing concentrations of ethanol solutions and HDMS according to Araujo et al. 32 in order to observe the biofilm on the electrode surface. Samples were sputter coated with gold for 5 minutes using a Denton Vacuum Desk IV coater and secondary electron imaging (SEI) micrographs were obtained in a Jeol JSM 6460 scanning electron microscope at 15kV.
2.5 DNA Analysis
Three sections of approximately 0.5 cm2 of the anode were removed and processed using the DNA extraction kit FastDNA ™ SPIN KIT of MP Biomedicals following manufacturer instructions for total genomic DNA extraction. For amplification of the 16S rDNA gene, primers fD1 (5’- ccgaattc gtcgacaacAGAGTTTGATCCTGGCTCAG-3’) and rD1 (5’- cccgggatccaagcttAAGGAGGTG ATCCAGCC-3’) for eubacteria were used 33. Amplicons were purified using the Wizard® SV Gel and PCR Clean-Up System (Promega) and vector ligation was performed using the pGEM®-T Easy Vector System (Promega). Recombinant plasmids were used to transform cells of Escherichia coli DH5α and a clone library was elaborated. To identify different 16S rDNA fragments from the colonies, digestion with the restriction enzymes KpnI, NdeI, PstI y DraI was carried out. Extraction and purification of the vectors containing the selected fragments were done using the Wizard® Plus SV Minipreps DNA Purification System (Promega) and the purified products were sent for sequencing (Macrogen, Korea). Sequences were edited using the software Geneious 5.6.4 and were compared for homology with 16S rDNA sequences of the GeneBank using the Basic Local Alignment Search Tool (BLAST, National Center for Biotechnology Information) with the Blast-n algorithm to obtain similar sequences of phylogenetically related species.
2.6 Microbiological Characterization
At the end of the experiment, a piece of 0.3 cm x 7.0 cm of the anode was cut off and introduced in a test tube with sodium thioglycolate. The test tube was vortexed to detach the biofilm from the piece of electrode and then, it was incubated for 48 hours in an anaerobic jar (OXOID). After bacterial growth was evident, plating was performed to isolate individual bacterial colonies in sodium thioglycolate - agar medium and anaerobically incubated. Isolated colonies were Gram stained and morphologically characterized. Biochemical characterization of the isolated bacteria was performed using BBL CrystalTM Gram-Positive ID Kit and Enteric/Non-fermenter ID Kit for Gram-positive and Gram-negative bacteria respectively.
3 Results and Discussion
3.1 Microbial Fuel Cell Operation
The MFC was operated for 70 days and electrochemically monitored for 65 days from day five. During the first days of operation the MFC was fed with SW through five batches followed by a cycle of 1:1 SW:RW and ten cycles of RW, with a hydraulic retention time (HRT) of four days. The cycle containing the 1:1 mixture served to diminish the impact of a sudden change in substrate that could negatively affect the biofilm deposition on the anode because of the presence of probable inhibitors of microbial growth in the RW. Figure 2(a) shows the consecutive power density curves taken daily derived from their respective polarization curves, the black ribbons showing curves taken when the cell was fed with SW and the red ribbons when RW was used. Figure 2(b) illustrates the evolution of the maximum power densities obtained in function of time. It can be seen that there is an overall increase in maximum power density in each anolyte replacement (red triangles) when using SW, which was consistent with the concomitant maturation of the biofilm on the anode. It should be pointed out that the decrease in the peak values reached by polarization curves in the measurements immediate to the anolyte replacement are due to substrate depletion by action of microbial metabolism, which was the indicator to make a new batch cycle. During this enrichment phase, SW allowed for a maximum power density of 1.10 μWcm-2 at day 27, while the mixture of SW and RW used prior the transition to RW generated a slightly greater value of 1.14 μWcm-2 at day 29. Figure 3(a) shows the behavior of the current density over time when using a 100 Ω resistance from the beginning of the experiment to day 56, and from day 57 to 65 when the resistance was changed to 2.74 kΩ (hence the sudden drop in current levels) to establish the conditions for maximum power and calculate CE. Current monitoring was essential for the experiment because it allowed the determination of the HRT, which was used to decide when to replace the volume of anolyte and start a new batch. Current density behavior over time, as can be inferred from the graphic, followed a similar pattern as that of maximum power density, reaching a maximum value of 6.30 μA cm-2 with RW at day 42. Figure 3(b) shows three representative polarization curves used to elaborate the ribbon diagram in Figure 2. Data represented in this figure correspond to days 4, 26 and 46 of the experiment, and allow the observation of the increase in the electrochemical performance of the system over time when there are not considerable changes in substrate concentration. Maximum power incremented from 0.13 μWcm-2 (day 4), going through 0.79 μW cm-2 (day 26) up to 1.11 μW cm-2 (day 46), which represents an increase of 850%. This tendency would obey the uniform biofilm structure formation to the conditions offered by the system to the bacteria and the increase in active biomass and decrease of void spaces in the biofilm matrix as it has been suggested by Read et al.29, and Zhang et al. 34 which, at the same time, optimizes the transport of electron donors from the external surface of the biofilm to the interface biofilm-anode resultingin an increment of the electrogenic capacity.
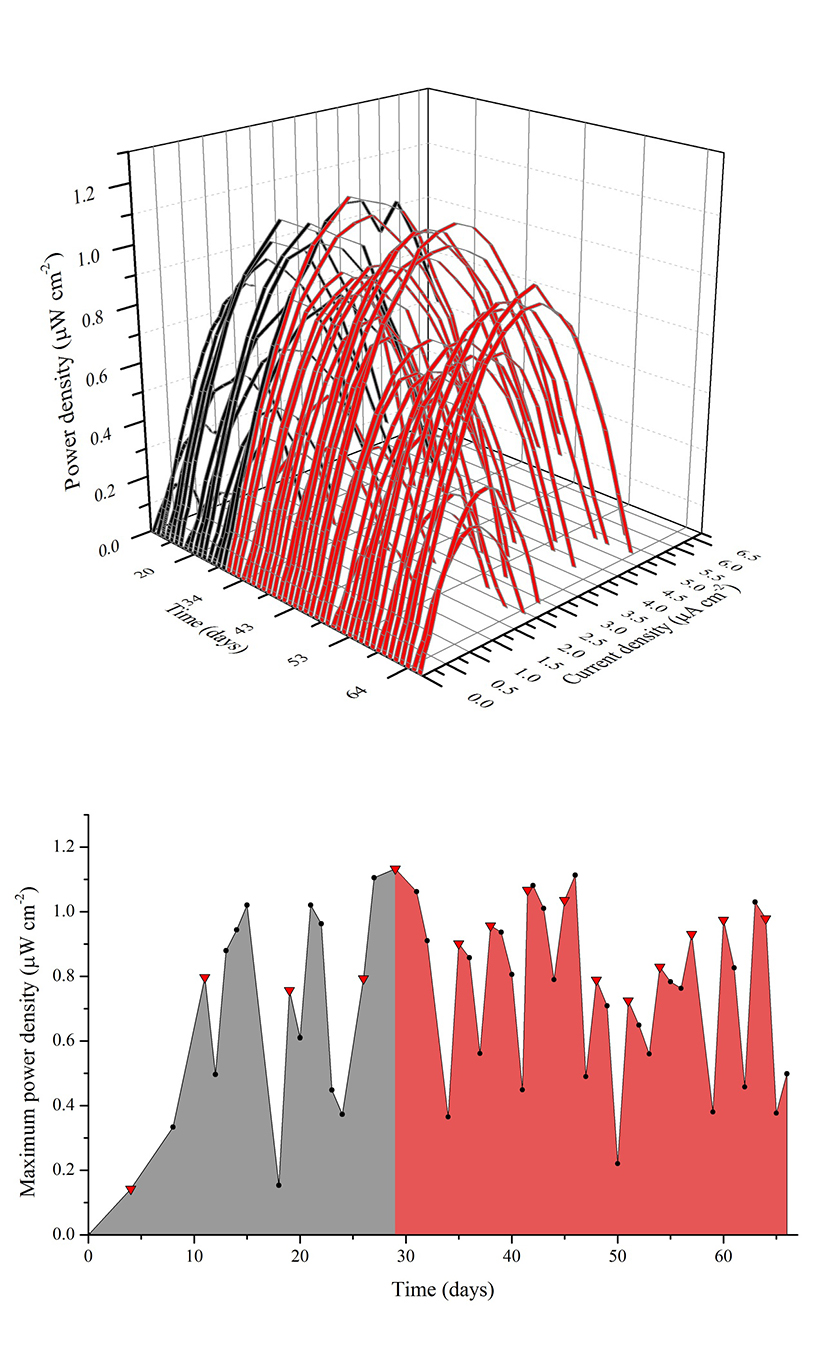
Figure 2 (a) Power density curves over time. Black and red ribbons correspond to curves made when using synthetic and real waste water respectively. (b) Maximum power density over time. The gray shaded area under the line indicates the use of SW as anoylite and the red shaded area the use of RW. The red triangles indicate anolyte replacement.
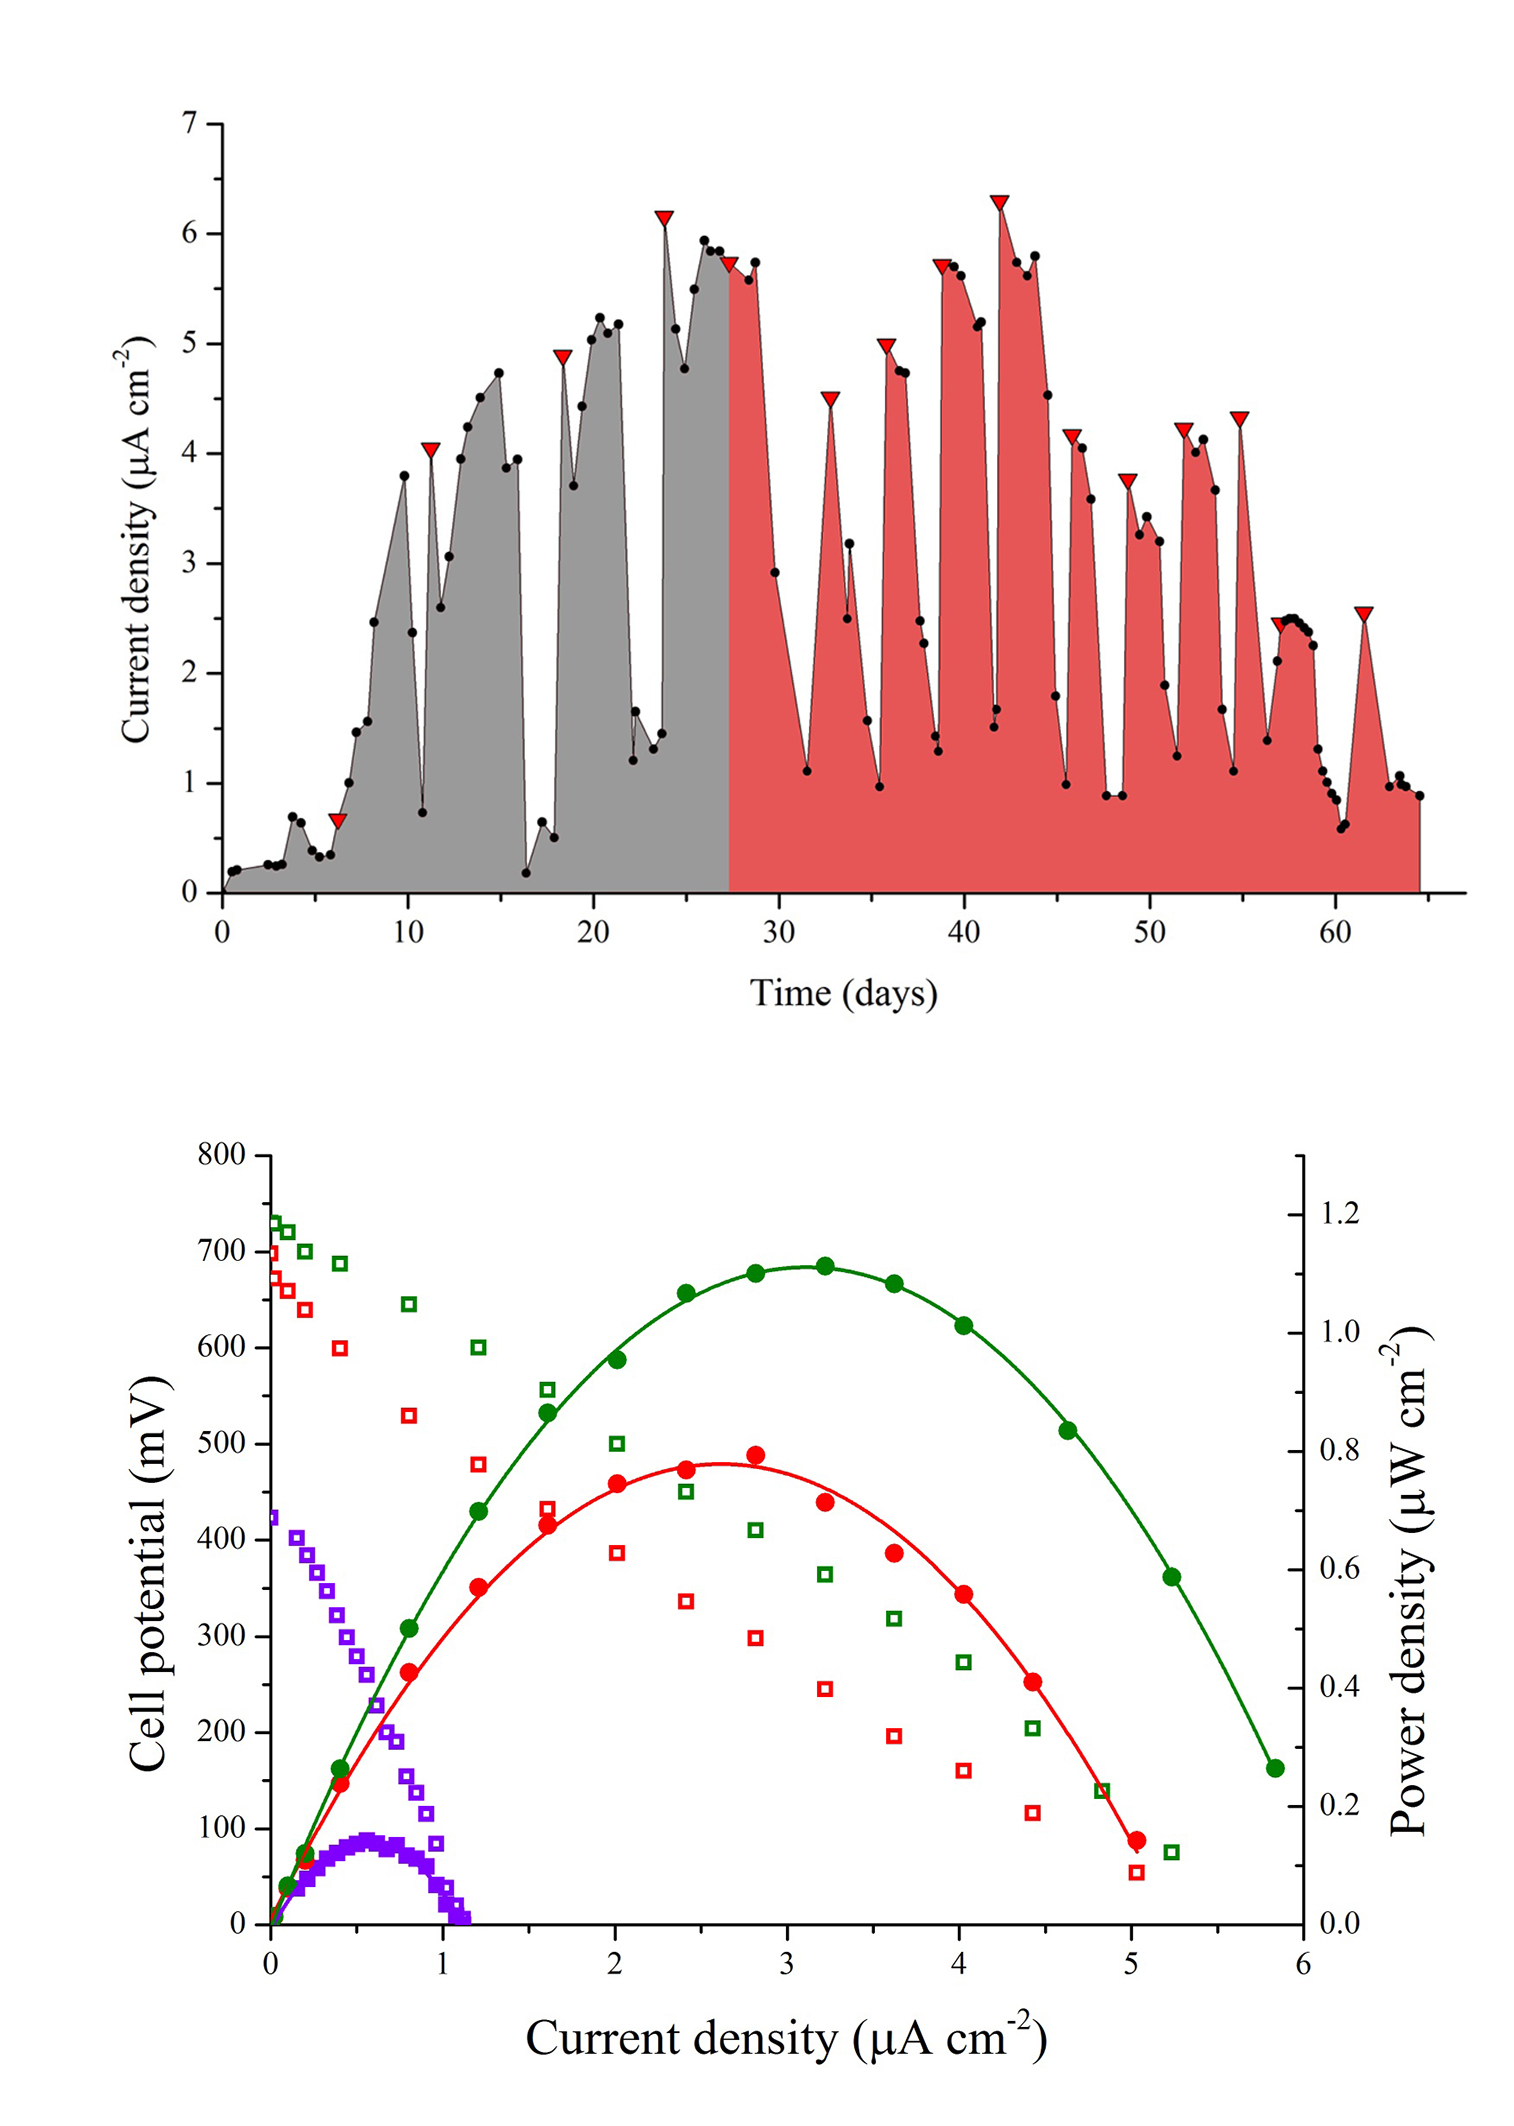
(b) Cell potential vs. current density and power density vs current density curves taken at days 4 (purple), 26 (red) and 46 (green).
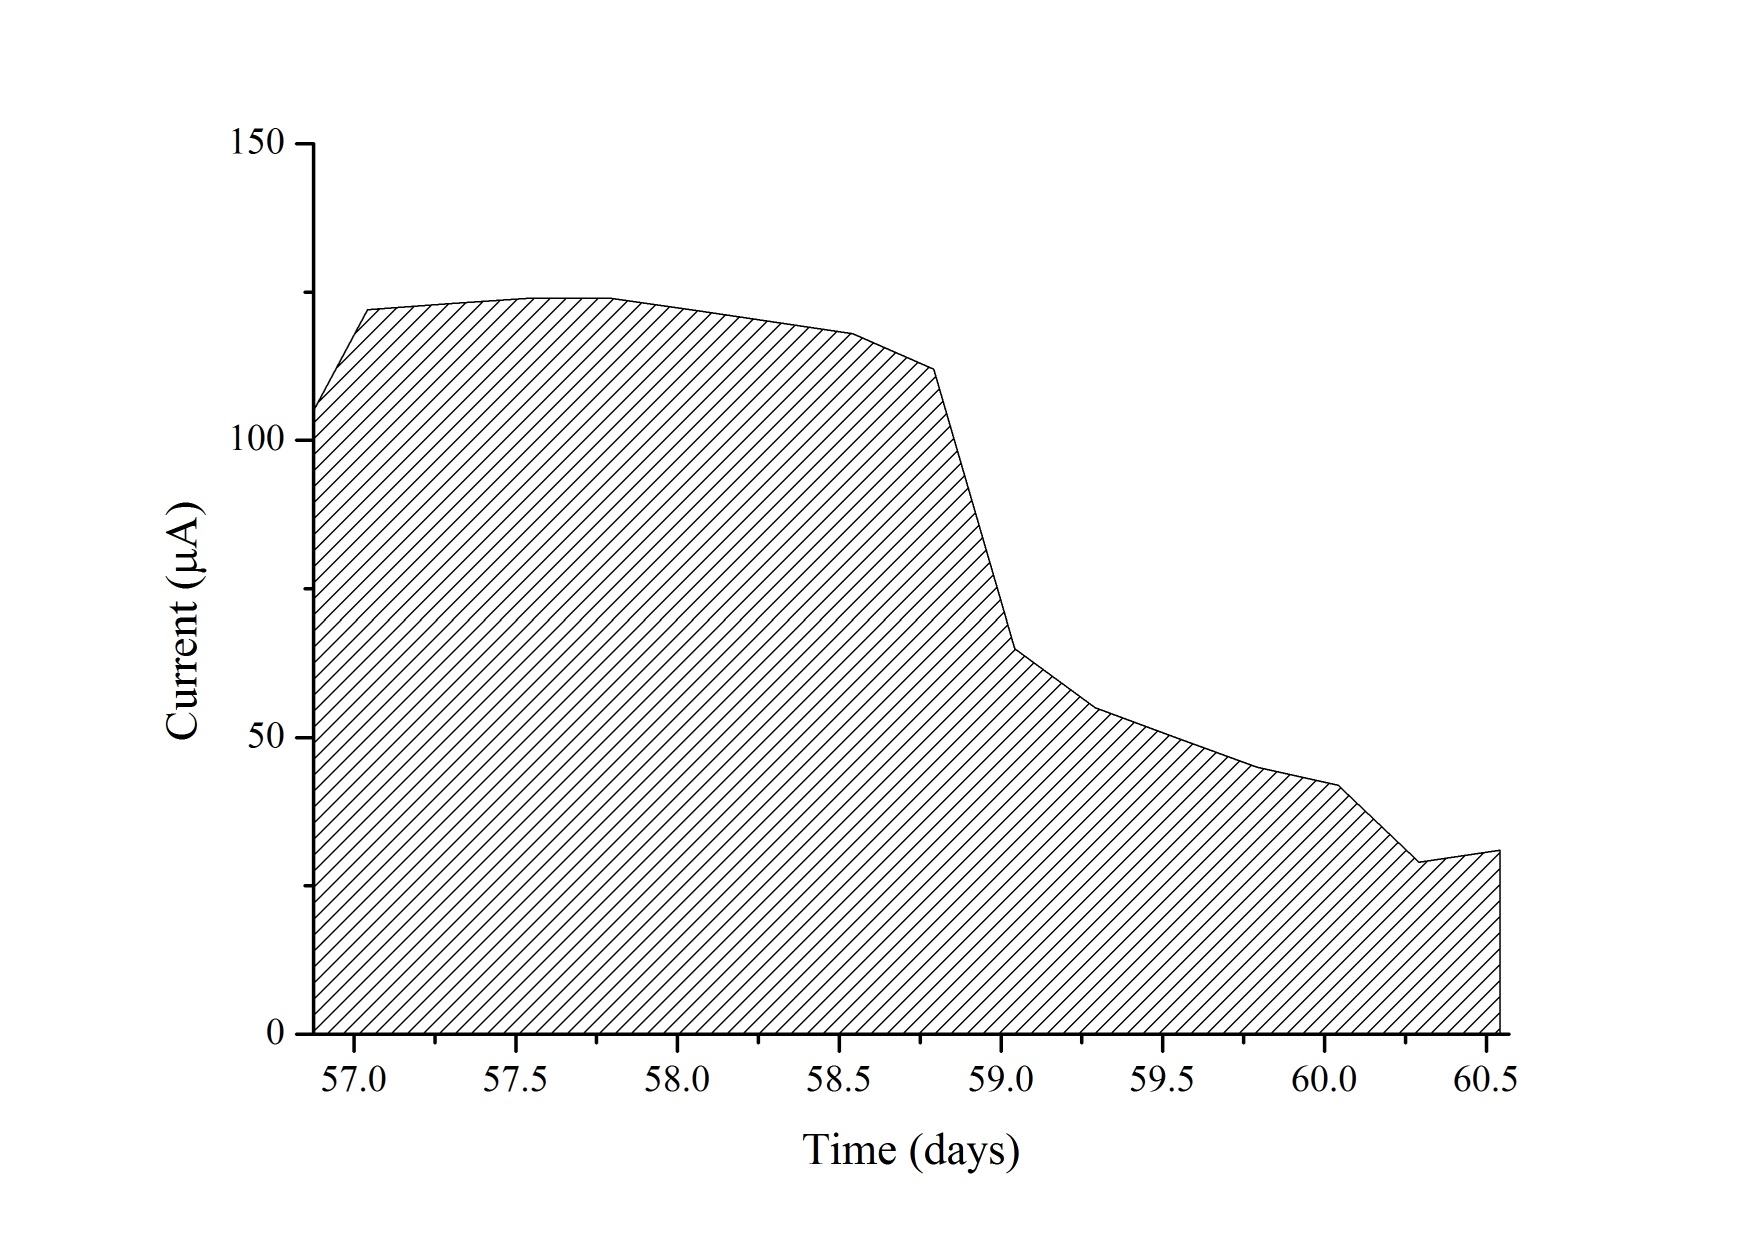
Operation with RW batches was marked at the beginning by a drop in the maximum power density in relation with the mixture of SW and RW, followed by a stepwise increase in successive substrate replacement until a considerable drop was observed at day 48. This drop in power density (as well as in current density, Figure 4) can be attributed to the dilution of the anolyte due to persistent rain in the sampling area diminishing the concentration of substrate (amino acids, sugars, volatile organic acids) and the available carbon sources. As power production in MFC follows saturation kinetics 35, a drop in substrate concentration reduces the magnitude of electron recovery by the system. The wastewater treatment plant from where samples of RW were collected serve 70 rural properties, two of which correspond to watering places that during rainy seasons discharge, irregularly, rainwater to the wastewater channels, causing a sudden increase in diluted water inflow to the wastewater treatment plant. The differences in the lower values of maximum power density of the MFC when using RW in comparison with the value obtained when using the mixture can be attributed to factors inherent to the complex nature of the anolyte, presence of growth inhibitors common in wastewaters (ammonia, sulfide, light metal ions) and introduction of competing bacteria as it has been mentioned by Chen et al.36, and Lee et al.37.The maximum power density value reached when the MFC was fed with RW was 1.11μWcm-2, similar to the value obtained with SW.
As indicated by the proximity of the values of maximum power density when using SW and RW as substrate, the cell configuration could limit power generation and its effect may overlap with those produced by the chemical differences between the substrates. The electrode spacing was probably the factor with the greatest influence on the limitation of power, as it would be expected from a distance of 10 cm between anode and cathode including the ohmic drop due to the Nafion® membrane. In spite of reasonable ohmic drop, the electrogenic activity was considerable. Previous studies have shown that decreasing electrode spacing from 4 to 2 cm can increase by up to a 60% the power density of the system because of a lowering in its ohmic resistance 38,39.
Maximum power densities reported in this work are lower than those reported by Liu et al.8) in a domestic wastewater feed MFC that produced 2.6 μW cm-2. This difference can be explained considering that, the MFC used by them was single-chambered and with a continuous flow of anolyte, which tend to increase power outputs. Our microbial fuel cell, with a significant ohmic drop, also presented a lesser cathodic area, and the PEM was physically separated from the cathode, not hot-pressed against it, which contributed to an increase in mass transport losses (proton exchange is hindered from the anode chamber to the cathode chamber). Higher values in maximum power density of 8.23 μW cm-2 with O2- saturated catholyte and 11.93 μW cm-2 using ferricyanide were obtained by Venkata et al. 10, in a dual-chamber MFC fed with domestic wastewater. They also performed this experiment in continuous feeding mode, which together with the use of catholytes with higher reducing potentials than ours, explain the higher power outputs. In the same way, Min and Logan 23 working with a lab scale MFC reported a maximum power density of 7.2 μW cm-2, value that can be attributed to the reactor design, a flat plate MFC with aerated cathode.
3.2 Coulombic Efficiency and COD Removal Efficiency
Using the last batch to calculate the CE, current was monitored for approximately three days at the fixed load under which power was maximum (2.74 kΩ). A coulombic efficiency of 7% was obtained, and although low, was comparable to those obtained in other studies in which complex mixtures of organic compounds were used: Min and Logan 23 reported a CE of 6%, Antonopoulou et al.40 using cheese whey as substrate obtained 1.9%, whereas Li et al.41 reported a value of 2.7%. These results are attributable to substrate use by competing methanogens or suspended bacteria in the anolyte. Studies where higher CE were obtained, between 60% and 80%, 42-45 used acetate as the sole carbon source from AW, in some instances coupled to ferricyanide in the catholyte. These factors favor higher CE because prevent the entrance of alternative electron acceptors to the anodic chamber and control competing metabolic routes by using a simpler electron donor in the anolyte that is not fermentable. When using RW as anolyte, studies such as those done by Liu et al8 (12%) and Rabaey et al.20 (20%) report the highest CE obtained in a domestic wastewater fed MFC. It should be remarked that in our work we evaluated performance in which voltage and current were maximum which at the same time resulted in greater resistances limiting the flow of current; Moreover, when compared with previous studies which report a higher CE, our measurements differ from those made by other authors in that they made use of lower external resistances allowing larger currents regardless of power at such loads.
Physicochemical analyses of the MFC effluent showed a decrease of 76.15% in COD and 57.7% in SOC (Table 1) after 3 days. This is consistent with previous researches where decontamination capabilities in terms of COD removal fluctuated from 40% to 80% in a single chamber MFC Liu et al. 8 suggesting a high potential for bioremediation of water contaminated with organic compounds using this technology. While the removal of organic matter is notorious, higher values could not be reached probably because of lack of flow of the anolyte inside the anodic chamber that could have contributed for the proper circulation of the nutrients in the anode.
This is obviously a limitation posed by the design of the cell used, and that can be easily overcome with stirring or other circulation methods provided by more sophisticate designs. Nevertheless, it is remarkable the percentage of COD removal in such a HRT when compared with a single chamber MFC with an air cathode that achieved the same removal of COD but at a longer solid retention time of 10 days 28.
Table 1 Physicochemical analysis performed on the real wastewater used as anolyte.
| Sample origin | Analyses | |||
|---|---|---|---|---|
| COD (mgO 2 L-1) | SOC (mgO 2 L-1) | % COD removal | % SOC removal | |
| Treatment plant inffluent | 173.6 | 18.79 | - | - |
| MFC effluent | 41.4 | 7.95 | 76.15 | 57.7 |
| Treatment plant effluent | 41.80 | 11.31 | 75.92 | 39.81 |
It should be noted that electrogenic activity cannot be pointed as the sole responsible for the removal of organic matter, since it has been shown that near 30% of COD removal is not due to electrogenic phenomena but to parallel metabolic processes that use nitrate and sulphate as electron acceptors and that are very common in domestic wastewater 46. Furthermore, direct oxidation of organic matter by oxygen diffusion from the cathode chamber could also contribute to the direct oxidation of carbon sources in the anode chamber, as it could happen in our case where a Nafion® membrane is used. To avoid this O2 diffusion, Choi and Chae 47 used membranes of polydimethylsiloxane (PDMS).
3.3. SEI Analyses of the Biofilm
SEI micrographs from biofilms on the anodic carbon cloth taken after 15 days of operation with AW predominantly showed bacilli of different sizes and some coccobacilli immersed in the gelatinous biofilm matrix (Figure 5). SEI micrographs show individual bacteria making direct contact with the electrode and bacterial clusters of varying thickness. Pili extending from the surface of the cells can also be observed and could be serving as nanocables to transport electrons to the electrode surface. It can be suggested that the bacteria located in the upper layer of the clusters might be fermenting complex sugars to produce simpler volatile organic acids used by bacteria in the lower layer of such clusters (or by those directly attached to the electrode) with direct electrode reducing capability. Nevertheless, bacterial species stratification in the biofilm following electron donor transportation of fermentation products requires further analysis.
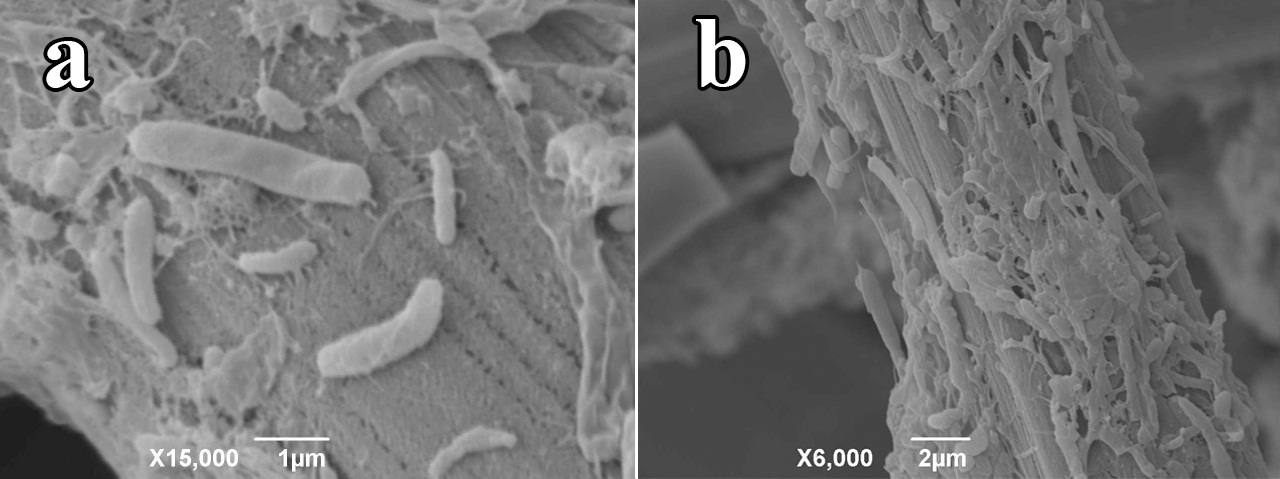
Figure 5 SEI micrographs of bacilli and coccobacilli adhering to anodic carbon cloth surface after 15 days of operation of the MFC. (a) Some of them are shown individually attached to the carbon cloth with visible pili extending out of them (b) others are shown in clusters.
After 60 days of operation, the change in cell diversity was notorious. Operation with RW favored the proliferation of spirilla, cocci and some club-shaped cells as shown in Figure 6. Bacilli and coccobacilli were also observed, but their abundance was much lower than the observed when the cell was operated with AW. The increase in cell diversity is correlated with the increase in substrate types and contributes to explain the decrease in power density levels as pointed out by Chae et al. 48. Highly diverse MFC tend to produce lower power outputs because of the presence of prokaryotic species capable of competing for organic sources against exoelectrogenic bacteria, which are selected with time as the system becomes more efficient with increases in abundance of electrochemically active bacteria.
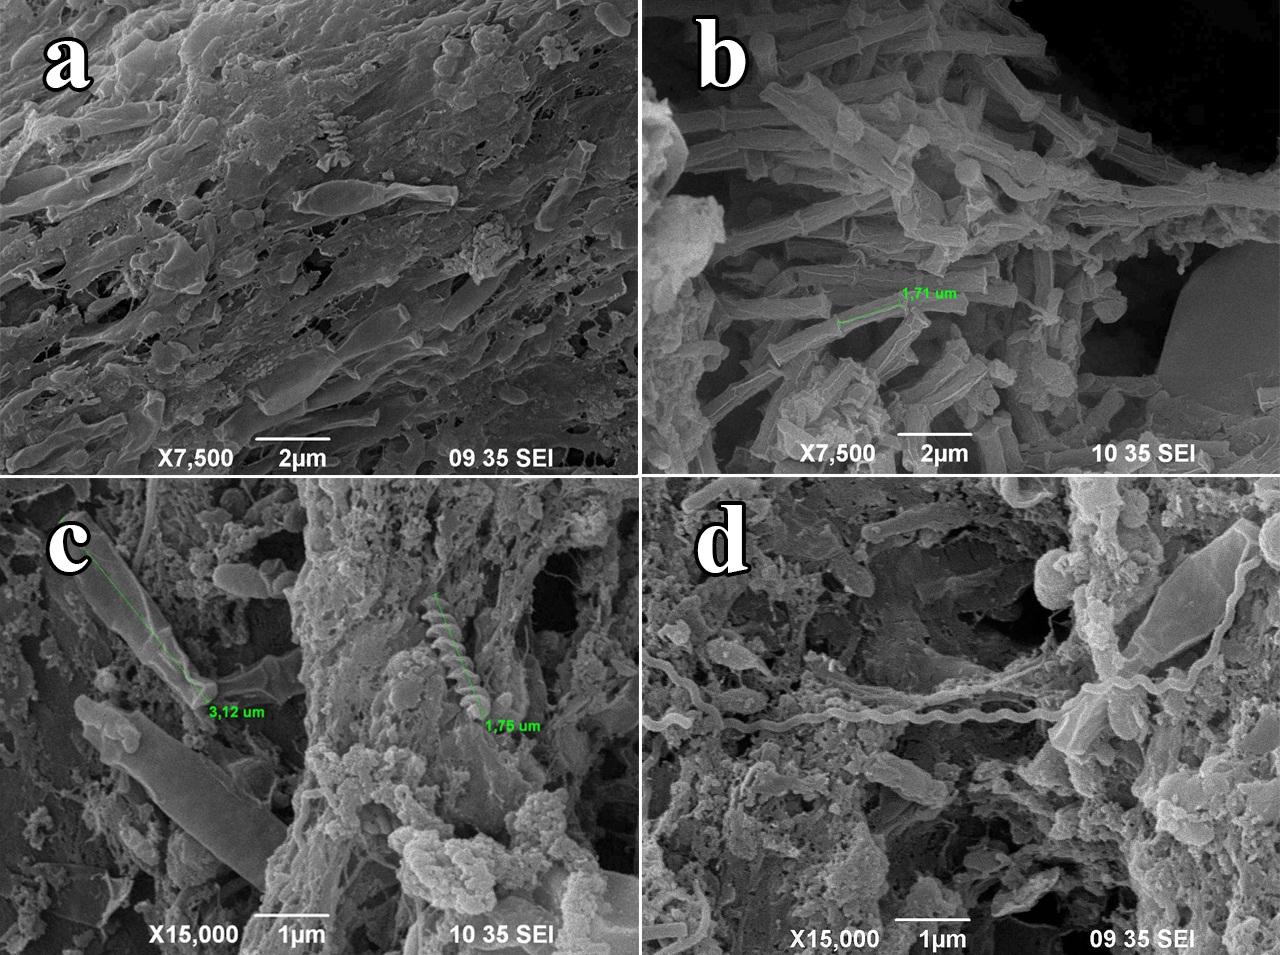
Figure 6 SEI micrographs of prokaryotic cells after feeding the MFC with real wastewater. (a) Groups of
club-shaped bacteria), (b) Archaebacteria of genus Methanosaeta (c and d) spirilli introduced with the change of anolyte.
The presence of at least two morphologically distinct species of spirilli as observed in figure 6 (c and d), belonging to the filum Proteobacteria provides direct observation of electro active bacteria feeding on formic acid as reported by Kiely et al.49. This acid is usually present in relatively high concentrations in wastewater of domestic origin. Furthermore, large clusters of cylinder-shaped cells joined at the ends forming thread-like structures correspond to the morphologically characteristic methanogenic archaebacterial belonging to the genus Methanosaeta as described by Araujo et al.32, which reduces the available lactic acid to produce methane. This can be correlated with the low CE, due to the decrease in organic compounds available for electrogenic metabolism and with the relatively high efficiency in organic matter removal as evidenced by the decrease in COD 7.
3.4 Isolation and Biochemical Characterization of Anodic Bacteria
Four bacterial strains were isolated in a thioglycolate medium, two Gram-positive and two Gram-negative. Growth pattern in test tubes (uniform turbidity from the bottom to the top of the liquid medium in the test tubes) prior plating suggested presence of aerotolerant anaerobic bacteria. Kim et al. 50 isolated anaerobic bacteria from their MFC, and also obtained a low number of isolated bacteria and suggested that uncultivable bacteria might be depending on syntrophic relationships to grow on the anode as seen in SEI analyses. Such relationships are not maintained when growth on nutrient medium is attempted. Table 2 shows the results of sugar fermentation biochemical tests done in three of the four isolated bacteria. It can be seen that the Gram-negative bacteria and one of the two Gram- positive bacteria showed sugar fermentation capabilities, suggesting that these isolates are not directly involved in the electrode reducing pathway and they are rather decomposing complex carbon sources providing non-fermenting bacteria with simpler substrates. The other isolated Gram negative bacteria was not capable of reducing any of the sugars tested, suggesting that this particular isolate may be reducing the electrode directly while oxidizing simpler organic molecules. This is also an indicator of a syntrophic relationship among bacteria in the MFC that contributes to the overall generation of electricity of the system. Kim et al.50 pointed out that electrochemically active bacteria are generally limited to simple organic acids as electron donors such as simple organic acids and are dependent on the fermentation products by fermentative bacteria in the anode biofilm.
Table 2 Biochemical tests on carbohydrate fermentation capabilities on isolated bacteria.
| Gram Positive | Gram Negative | |||
|---|---|---|---|---|
| Substrate | Isolate 1 | Substrate | Isolate 2 | Isolate 3 |
| Arabinose | + | Trehalose | + | - |
| Manose | + | lactose | + | - |
| Sucrose | + | Sucrose | + | - |
| Melobiose | + | Mannitol | + | - |
| Sorbitol | + | Maltotriose | + | - |
| Galactose | + | Arabinose | + | - |
| Ramnose | - | Glycerol | + | - |
| Mannitol | - | Fructose | + | - |
| Adonitol | - | |||
3.5 16S rDNA Analysis
A total of three OTUs were obtained after cloning and sequencing the extracted 16S rDNA from the anodic bacteria. Table 3 shows the list of the clones with the identification of the accessions in GenBank which have the highest identity. Sequences of the bacteria present in the anode showed the greatest identity with sequences of uncultured species only identified by means of molecular biology tools. Identity percentages of clones 2 and 3 (97, 96 and 95%) might be suggesting the microbial enrichment of novel bacteria in our MFC. As it has been reported in most works analyzing the microbial composition of the anodic community of MFC, phyla Firmicutes (Clone 1), δ-Proteobacteria (Clone 2) and α- Proteobacteria (Clone 3) were detected in our MFC.
Table 3 Recombinant clones comparison for identity percentage with NCBI accessions.
| Clone | Most closely related species | Source | Identity % |
|---|---|---|---|
| 1 | Uncultured bacterium clone E- 38 (KC835957) | Bacterial community composition shifts in response to microcystis bloom - an enclosure experiment | 99 |
| Unculturable Firmicutes QEDN3BD0 Clone (CU925891) | Mesophylic anaerobic digester | ||
| 2 | Unculturable bacteria clone N1_3_694 (FJ534955) | Anaerobic sludge digester | 97 |
| Unculturable Smithella sp. Clone wn95 (JQ012317) | Activated sludge (Unpublished data) | ||
| 3 | Unculturable bacteria Clone Ac-2 (HQ602890) | Laboratory scale wastewater treatment reactor | 96 |
| α-Proteobacteria Clone AS-45- 1 (GQ406147) | Sediment sample from benthic ecosystem | 95 |
Predominance of Firmicutes in MFC has been reported when using propionate as substrate and this phylum has been reported as one of the integral members of the anodic community 51,53. On the other hand, identity percentage of the sequence of the clone 2 with Smithella sp. offers support to the observed presence of methanogenic archaea with SEI and their syntrophic association, given the fact that the above mentioned bacteria can only grow syntrophically with methanogenic archaea of the class Methanomicrobia, to which Methanosaeta sp., belongs 54. Proteobacteria has been usually identified as the predominant phylum in anodic communities 17,24,55-57 containing well-characterized electroactive species such as Geobacter and Shewanella45,56-58. Since none of the sequenced OTUs showed identity with these electrochemically active species, it is expected that novel, yet to be characterized bacteria of the same phylum are contributing to the energy generation.
4 Conclusions
The present study showed the ability of bacteria from anaerobic sludge in a domestic wastewater treatment plant, serving a small rural community in Colombia, to produce a maximum power density of 1.11 μW cm-2 and a coulombic efficiency of 7%. These results suggest feasibility of applying MFC technology to the treatment of domestic wastewater in small communities located in temperate climates as suggested by the decrease in COD content. It must be remarked that systems with continuous feeding mode must also be evaluated in order to assess the full potential of the technology for these particular conditions. Biochemical tests on isolated bacteria showed metabolic heterogeneity on the capability to ferment different sugars, which suggests syntrophic relations among the members of the microbial community of the anode. SEI observation showed an increase in cell diversity, which is expected given the fact that substrate diversity also increases when artificial wastewater operation shifts to real wastewater operation. In addition, the presence of methanogenic archaea hinders the overall performance of the MFC, as suggested by SEI and supported by 16S DNA analyses. This factor, along with the decrease in substrate concentration due to a rainy season, contributes to explain the relatively low power outputs and coulombic efficiency. Finally, 16S DNA gene analysis suggests the presence of new species of unidentified bacteria that could be potential electrode reducers. Tests with pure culture inoculated MFCs are being performed with isolated bacteria to assess their individual contribution to electricity generation.

