


 Inglês (pdf)
 Artigo em XML
 Referências do artigo
 Enviar este artigo por email
 Citado por SciELO
  Citado por Google
  Similares em
SciELO
Similares em
SciELO  Similares em Google
 Permalink
1 Introduction
The continuous process of urbanization and economic development based on fossil sources in the last century led to high air quality deterioration, especially in urban areas, due to a particular concentration of vehicular traffic and pollutant emissions at ground level 1. Weather conditions and urban morphology are often parameters to be considered in increasing or mitigating air quality and its effects on human health 2. Estimating the emission factors associated with vehicular traffic in urban areas has been a challenge for the academic world in the last decades, where despite significant improvements in fuel and engine technology, urban environments are still dominated by traffic emissions 3. Particularly, in the frame of study of Colombia, a recent study in Bogotá has shown that emissions of resuspended particulate matter constitute a significant part of the emissions inventory and have considerable impact on air quality 4. In recent years, new approaches based on the indirect estimation of emission factors under real-world conditions have been developed such as the case of top down techniques, the tunnel studies and the inverse application of air quality models at a micro level 5. On the other hand, dispersion models either estimate the pollutant concentrations analytically, by a simplified set of parametric equations, or numerically, by a set of differential equations that describe in detail the wind flow and dispersion of pollutants 6. Physical models, scaled-down wind tunnel can be useful to emulate atmospheric processes that occur in urban canyons and to validate the mathematical models 7 , 8. Most studies assume that the concentrations of pollutants observed, in a single station or a series of permanent measurement stations located within a city can be totally or partially extrapolated as values associated with the exposure of the city inhabitants 6 , 9 , 10. One of these studies undertaken in La Guajira (Colombia) presents the analysis of the emission, dispersion, and concentration of particulate matter with aerodynamic diameter lower than 10 micrometers (PM10), carbon monoxide (CO), nitrogen dioxide (NO2), volatile organic components (VOC), and hazardous air pollutants (HAP), emitted from a modular station of compression, processing and measurement of natural gas located on the area studied. To estimate the concentration of pollutants a Gaussian dispersion WKBK2 model for point source was applied and validated with PM10 and NO2 measured close to an industrial plant (the maximum concentration occurred between 100 and 200 meters from the source). The maximum concentrations of PM10 in this case exceeded the World Health Organization guideline value of 20 μg/m310.
Certain episodes of air pollution originated in industrial processes, being highly toxic, that migrate to the high layers of the atmosphere, causing a deterioration in the ozone layer 11. In an urban scale, as mentioned, the pollution generated by transit of mobile sources prevails, often generating important vehicular flows on the city roads. These episodes have led the different environmental authorities around the world to implement measures of analysis, control and registration such as inventories of automobile fleet emissions or the use of different emission models 9. The emission factors represent the main source of uncertainty at the time of quantifying the emission of gases and particulate matter 12. An important step in the development of the method for estimating emission factors is the selection of the most appropriate dispersion model. Different models have been proposed to simulate the dispersion conditions in urban environments directly affected by vehicular traffic, such as Cash Models, Street, AERMOD, OSPM, CAR, CPBM, ADMS and OND 86, among others 13 , 14.
In the Colombian Caribbean region, most cities, including Cartagena, have not yet estimated the emission factor. Therefore, the objective of this study is to determine the average emission factor of the vehicle fleet of the city of Cartagena, evaluating CO and particulate matter with diameter lower than 2.5 micrometers (PM2.5) considered their high impact on air quality and human health 15, implementing the inverse modelling technique using the AERMOD air quality software.
There are different international experiences in which the inverse method of dispersion models is applied for the estimation of vehicle emission factors (Table 1).
Table 1 Estimation of emission factors from mobile sources that use the inverse method.
| Site | C | Model | Cat. | Ref. |
| Copenhagen (Denmark) | Benzene, NOX, CO, PM10 | OSPM | Cars, vans, trucks, buses | ( 16 ) |
| Copenhagen (Denmark) | NOX, CO, PM10 | OSPM | All vehicles | ( 17 ) |
| Córdoba (Argentina) | CO, NOX | STREET | All vehicles | ( 18 ) |
| St. Petersburg (Rusia) | NOX, Benzene | OSPM OND-86 | Heavy light vehicles | ( 19 ) |
| Brisbane (Australia) | PM10, PM2.5 | CALINE 4 | All vehicles | ( 20 ) |
| United States | PM2.5, CO, NO2 | AERMOD | All vehicles | ( 21 ) |
C=Contaminants; Cat.= Categories; Ref.= Reference
Source: Tarapues, 2003.
2 Material and Methods
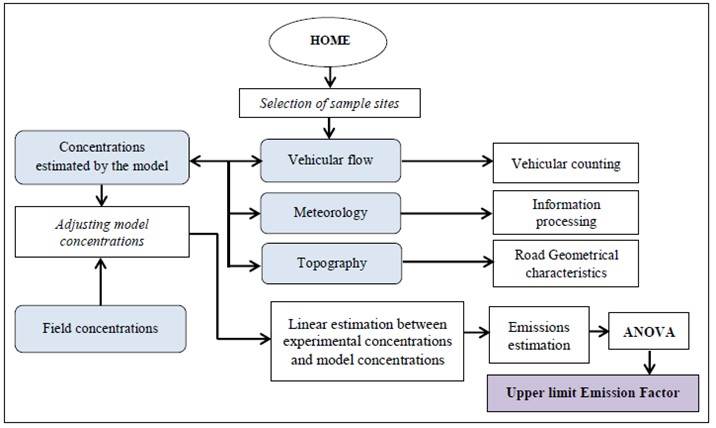
The inverse modelling technique consists of implementing an air quality model that must be calibrated with experimental data recorded through a on field monitoring campaign. The development of the methodology was carried out in three phases: 1) selection of the monitoring sites, 2) on field monitoring campaign and 3) modelling and estimation of the emission factor.
2.1 Description of the study area and pollutants under study
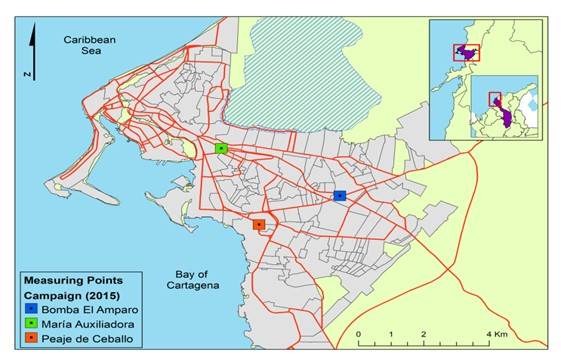
The study was carried out in the urban area of Cartagena de Indias, a city located in the Northwest of Colombia, in the Department of Bolívar 10° 26' North latitude and 75° 33' West longitude. Cartagena is a port city that sits on the Colombian Caribbean Sea, and its territory is constituted by a strip of narrow land on the seafront of 193 km in length, from the borders with Galerazamba in the north to Boca Flamenquito 22. Cartagena has a population in its metropolitan area of approximately 1.036.134 inhabitants, the fifth most populated city in the country 23. As a tropical city, it has a bimodal climate with periods of rain usually in the months between May and November. Along with the measurement of the concentration of pollutant gases and particles, trends of wind speed and direction, temperature, atmospheric pressure, rainfall, and relative humidity (RH) were also recorded. Throughout the year, Cartagena presents an average temperature of 27.7 ºC and an approximate mean value of the rainfall close to 1021 mm year-1. The annual average value of RH is 80 % and the predominant direction of the winds is NE 24.
Knowing the topographical characteristics of the roads under study and the meteorological conditions around them, it is possible to estimate the emissions released over a period of time and determine the spatial representation of the pollutants under study, average concentration and the areas with the highest concentrations, contribution of each pollutant to the total pollution existing in any place of interest 25.
2.2 Selection of measurement sites and recording of pollutants
To carry out a monitoring campaign, it is necessary to previously identify the sites in which the measurement of pollutants originated by emissions from mobile sources will be carried out. The selection of these monitoring points was determined as follows:
a) Identification of the sectors with the highest vehicular flow. The most important roads in the city were identified and the specific points where a large number of vehicles converge (approximate average value of 12.000 vehicles per day) taking into account the gauges previously made (Figure 1).
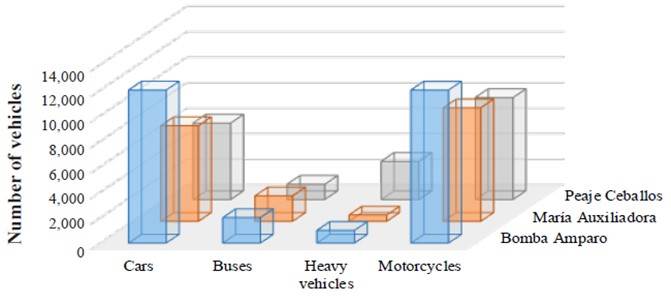
Source: design of the intelligent environmental quality monitoring system for the Cartagena district. Inter-administrative agreement 0133-2015 between the Establecimiento Público Ambiental de Cartagena - EPA and Universidad de Cartagena.
Figure 1 Distribution of the analyzed vehicle fleet. Capacity at the monitoring sites: Bomba del Amparo, María Auxiliadora y Peaje Ceballos 15.
b) Definition of factors or selection criteria of the sampling sites. The sites selected to carry out the sampling were evaluated quantitatively in accordance with the following selection criteria: safety, influence of external sources, site accessibility, identification of barriers and obstacles, historical record of pollution and concentration. The CALINE 3 software was implemented in the process, which is a model of air quality recommended by the US-EPA, which simulates the dispersion of pollutants caused by vehicular traffic on urban roads, highways and bridges 26 , 27.
c) Factors weight. Each of the factors above mentioned was assigned a quantitative assessment that defines its relative weight.
With the implementation of the methodology described, the following sites for the measurement and recording of contaminants were selected: Peaje de Ceballo, El Amparo Pump and the María Auxiliadora Police Station (known in Cartagena respectively as Peaje de Ceballo, Bomba de El Amparo and María Auxiliadora and from now on mentioned by their name in Spanish) (Figure 1).
2.3 Atmospheric pollutants measure campaign
The measurement campaign was carried out for an average period of thirty days per selected site (Figure 2). The concentrations of PM2.5 and CO were recorded with automatic analyzers. In the case of the PM2.5 concentration record, Thermo Electron DataRam 4 equipment was used, which works with nephelometry techniques, and the Thermo Electron model 48i infrared detection equipment was used for the CO. During the measurement and registration campaigns, a portable weather station Oregon Scientific model WMR200/WMR200A was installed, with sensors to estimate barometric pressure, temperature, relative humidity, solar radiation, rainfall, direction and wind speed 28.
The measurement campaign lasted three months, during which the following activities were carried out:
a) Calibration and installation of the equipment to carry out the monitoring campaign. The equipment was installed in the three sectors following the recommendations of the supplier company (THERMO ELECTRON) and the protocols of the EPA which suggest the special considerations for samplings in cities;
b) Vehicle counts. Measuring was carried out by manual method, eight days a month, registering the number of vehicles every five minutes in periods of five hours between normal days, weekends and prohibited days for motorcycles. Buses, trucks, private vehicles, taxis and motorcycles were counted. Environmental factors were recorded.
The parameters measured in this study were vehicle flow, emissions and meteorological parameters of the stations.
2.4 Modelling and estimation of the emission factor
To estimate the emission factor interval, the air quality model AERMOD was implemented, which is a steady-state Gaussian model recommended by the US-EPA to estimate pollutant concentrations. The software consists of a model composed by two pre-processors: AERMET and AERMAP. The first is responsible for processing the meteorological information and AERMAP processes the geographic information required by the AERMOD model.
The meteorological data used for modelling were measured during 24 months in 2014 and 2015. The mobile sources were taken into account as area sources and the geographical information of the environment analyzed was obtained from the geographic information system WebGIS SRTM3 29. To determine the emission factor, the concentrations with AERMOD were estimated and subsequently the values were related to the concentrations measured in the measurement and registration campaigns. With the application of the linear regression method, a global emission factor was determined for mobile sources in the city.
The steady state model generates the emission results of pollutants in a continuous way, or rather; it generates a graphical dispersion output in specific daily conditions with a constant flow of emission. In addition, AERMOD uses the stationary Gaussian plume model, which incorporates factors related to the source as well as meteorological factors, to estimate the concentration of the pollutant emitted.
Due to the vertical component of velocities, the real mass distribution of the pollutants does not turn out to be Gaussian (symmetric) but presents a positive vertical bias. Thus, in convective conditions, AERMOD implements a biased probability density function to characterize the vertical distribution of concentrations.
In AERMOD, the horizontal and vertical dispersion parameters are the result of the combination of two effects: dispersion as a result of ambient turbulence and dispersion induced due to atmospheric phenomena.
2.4.1 Elaboration of the pollutant dispersion model
Taking as reference the AERMET module of the AERMOD VIEW software, a file will be created in which the meteorological data, land use and other properties of the area under study are entered. Subsequently, the project will be created using AERMOD VIEW, which already includes meteorological data. Once the project is created, the base cartography will be imported, which can be obtained on the basis of topographic surveys, IGAC databases (Geographic Institute of Colombia), or "Geographic Information Systems (GIS)" databases. With the base cartography implemented in the software, we proceed to define the pollutants under study and to include the types of emission sources identified in the project area. Subsequently, the sources of immission or receivers were defined, including the different coordinates of the neighborhood, population centers and other residential areas located in areas with the highest vehicular flow. Likewise, a network of receptors must be included, either radially or Cartesian, in order to establish the limits on which it is necessary to generate the map of concentrations of pollutants.
Once the project is created, the characteristics of the dispersion of the pollutants must be defined. To this end, EPA regulations are considered:
The descent from the discharge of the sources (Stack-tip downwash). It is a relevant parameter when considering the convective boundary layer (air layer close to the ground that is affected by convection due to the diurnal exchange of heat, humidity and moment with respect to the ground) since it would take into account the top of the plume dispersion of pollutants;
The induced flotation dispersion (Buoyancy - induced dispersion). This component is necessary to determine the corrected variance for the horizontal components;
Processing routines in calm state (Calms processing routines). In this case, corrections for turbulent flow conditions would not be used;
The exponents of the default wind profile (Default wind profile exponents);
The vertical temperature potential gradients (Default vertical potential temperature gradients).
Furthermore, the type of pollutant and dispersion coefficient to be modelled must be specified. The AERMOD software allows the establishment of weighting times calculated with the data used to perform the dispersion simulation. Weighting times can be hourly, daily, monthly or yearly. In this study, the model was selected based on the times of hourly, daily and annual average weightings for comparison with the current environmental standard.
2.5 Estimation of emission factors using inverse applications of dispersion models
The inverse application of dispersion models is a recently developed tool for obtaining the emission factors of a city's own vehicle fleet under real emission conditions. It is a simple alternative to apply that implements a combination of measurements of pollutants from traffic and models of atmospheric dispersion in urban environments.
In the present study, measurements of atmospheric pollutants, meteorological parameters and the volume and speed of traffic on heavily travelled roads were obtained. Gaussian atmospheric dispersion models developed for urban environments based on known mathematical relationships of emissions from traffic, transmission (meteorology and chemical transformations) and concentrations of pollutants were also implemented.
With the application of the inverse method, it is possible to quantify the combined effect of the variables that have a significant impact on the emissions generated by traffic in the city, such as the driving conditions of the vehicle. However, engine technologies cannot be considered as well as combustion, emission control systems, the type and quality of fuel used, and the condition of the vehicles that make up the city's vehicle fleet. Furthermore, we are not able to consider other relevant variables such as the temperature of the combustion engine and the ambient temperature, which are considered to be very important due to the physical characteristics of fuel volatility since they directly affect the development of combustion processes. The emissions estimated by developing the inverse methodology do not include both emissions from the exhaust pipe and emissions from the vehicle's crankcase, also known as evaporative emissions.
The method is based on the estimation of emissions with the actual pollutant concentration data usually recorded in measurement campaigns. The relationship between emissions and pollutant concentrations might be established with a dispersion model that describes the predominant physical and chemical processes 13.
The concentrations of the pollutants may be related to the phenomena involved in the dispersion and to the amount of pollutant emitted by applying the following general equation 30:
Where E is the Emission in (g s-1 m2), FE Factor Emission (g km-1), N Number of average vehicles per day, A Track width (km) and c Unit conversion factor 86400 (days km2 m-2 s)
If, when comparing the increase of the emission obtained by this general equation with the concentrations obtained in the modelling, a linear behavior is observed, the first order algebraic expression will be applied:
By analogy, transforming the variables, results:
Where, VL are the Light weight vehicles, VP , Heavy weight vehicles and C emission from other sources. Can be established whether they are light or heavy vehicles, following relationships (4) and (5):
Starting from the equation (1) we have:
Being Ac the activity (N A-1 ), consequently:
Therefore, by clearing, the emission factor is calculated as follows:
The methodology for determining the emission factor limit consists in adjusting the concentrations estimated by the model with the concentrations measured in the monitoring campaign using linear regression, taking into account the data of the estimated concentrations of the model and the emissions found with the general equation as a calibration criterion.
Subsequently, the ANOVA statistical analysis was applied for different levels of confidence and the ranges (88 %-95 %) in which there is a greater probability of finding the values of the real FE obtained (Figure 3).
3 Results
To assess the most unfavorable situation against air pollution generated by vehicle traffic, the average concentrations of CO and PM2.5 were analyzed, for periods of 1 hour and 24 hours respectively, in the studied roads and they were compared with the limit values proposed in the Colombian Resolution 610 of 2010 31, observing in the same way the maximum instantaneous values recorded (Figure 4).
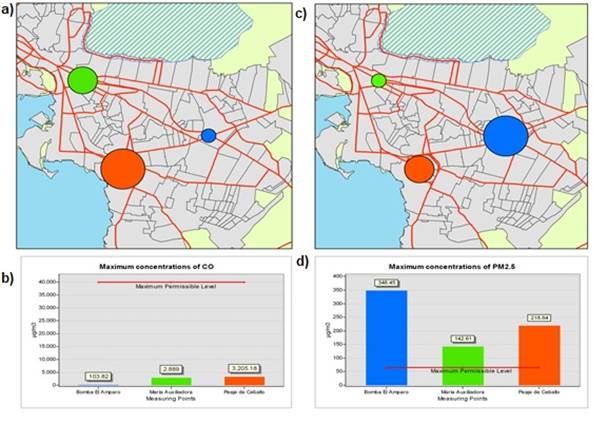
The concentrations of PM2.5 were particularly high, exceeding the limit established by the Colombian standard of air quality in the three measurements and registration sites; while the CO concentrations at all the measurement points were well below the maximum permissible level.
Subsequently, the AERMOD software simulated the spatial distribution of the average monthly concentration of pollutants in the three places under study, observing the area of influence of both pollutants. The upper limits of emission factors were found generally for light and heavy vehicles, not estimated for different vehicle categories. The theoretical emissions were estimated taking into account emission factors referenced in the literature and the geometric characteristics of the roads under study in the three selected sites (Table 2 and 3).
Table 2. Geometric characteristics of the tracks.
| Sector | Track width (m) | Strip length (m) |
|---|---|---|
| Bomba El Amparo | 6.00 | 60.00 |
| María Auxiliadora Police Station | 7.70 | 170.00 |
| Peaje de Ceballos | 13.50 | 45.15 |
Table 3. Estimated theoretical emissions at the three sampling sites.
| Sector | Bomba El Amparo | María Auxiliadora | Peaje de Ceballos |
|---|---|---|---|
| Initial Emission | 2.6818E-05 | 1.1299E-05 | 1.3007 E-04 |
| 10.00% | 2.9500E-05 | 1.2429E-05 | 1.4308 E-04 |
| 30.00% | 3.4864E-05 | 1.4689E-05 | 1.6910 E-04 |
| 50.00% | 4.0228E-05 | 1.6949E-05 | 1.9511 E-04 |
| 70.00% | 4.5591E-05 | 1.9209E-05 | 2.2113 E-04 |
| 100.00% | 5.3637E-05 | 2.2599E-05 | 2.6015 E-04 |
Measurements of air pollutants recorded by measuring stations generally have limitations in spatial and temporal coverage, so in some cases may not be representative to verify that the sources are under the permissible emission limits, highlighting the need for the application of an air quality model. On the other hand, it must be taken into account that the measuring stations record the concentration of a pollutant punctually, while a model predicts the concentration of the pollutant from its point of emission to the site where causes the impact. The results are represented on a grid of receivers, showing the isoconcentration curves for the maximum concentration level of the pollutant considered (Figure 5).
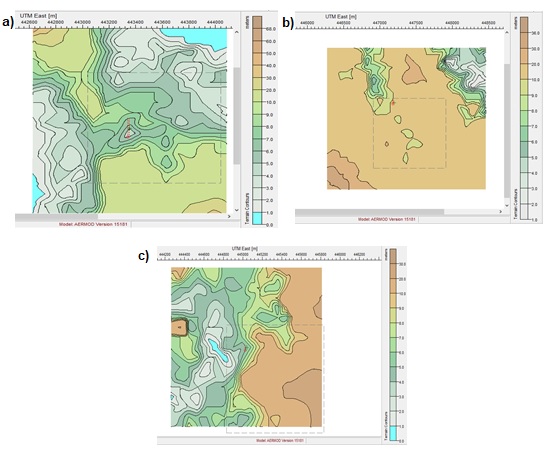
Figure 5 Isoconcentration curves of PM2.5 projected for: a) Bomba El Amparo; b) María Auxiliadora Police Station; c) Peaje de Ceballos; d)Elaborated with the AERMOD View model.
According to the information available for the present investigation, the AERMOD View model was selected, since it is adequate to represent the transport of PM2.5, CO and the concentrations that may occur in the study sites according to the emissions of contaminants from mobile sources. The hourly concentrations estimated by the model were found according to the emissions of each source, taking into account the climate data during the campaign.
The relation between increasing in the theoretical emissions and concentrations estimated with the AERMOD model was found to be linear, resulting in a similar behavior in the three sampling sites (Figure 6).
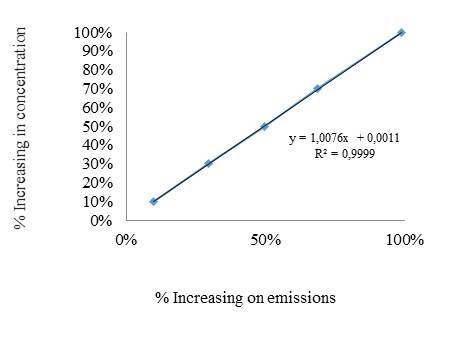
Figure 6 Increasing in concentration proportional to the increase in emissions in Bomba El Amparo Sector.
In accordance with the behavior experienced between the two variables, in the three sampling sites, the daily emission was estimated by applying the linear regression for the theoretical emissions and the concentrations estimated by the model. We proceeded to relate the calculated emissions with the general equation (1) with the average of vehicles per hour and day (Table 4).
Table 4. Emissions obtained by linear regression for Bomba El Amparo sector.
| Emission | Cars | Buses | Trucks | Motorcycles |
|---|---|---|---|---|
| (g seg -1 m 2 ) | (veh h -1 ) | (veh h -1 ) | (veh h -1 ) | (veh h -1 ) |
| 1.43E-03 | 538 | 44 | 57 | 16 |
| 2.09E-03 | 524 | 66 | 36 | 728 |
| 2.09E-03 | 526 | 67 | 41 | 680 |
| 2.78E-03 | 483 | 53 | 18 | 468 |
Due to the scarcity of data, the values were grouped into two categories: light vehicles and heavy vehicles (Table 5). In the category of light vehicles, automobiles and motorcycles were classified and, in the category of heavy weight vehicles, buses and larger displacement vehicles.
Table 5. Emissions obtained in the linear regression for the Bomba El Amparo sector.
| Emission | Lightweight vehicles (veh h -1 ) | Heavy weight vehicles (veh h -1 ) |
|---|---|---|
| (g h -1 ·m 2 ) | ||
| 5.15E+00 | 554 | 101 |
| 7.52E+00 | 1,252 | 102 |
| 7.52E+00 | 1,206 | 108 |
| 1.00E+01 | 951 | 71 |
The upper limits or the maximum values of the emission factors for each of the measurement sites were calculated and proposed in Table 6. It should be taken into account that the values provided by the literature have a certain degree of uncertainty, which is why it is recommended to establish a range of values in which it is most likely to find the real value of the emission factor. It can be inferred that the values differ significantly in each of the sectors, probably due to the influence of different fixed sources close to the measurement stations.
Table 6. Upper limits of the estimated emission factors (g km-1 veh) for PM2.5.
| Categories | Bomba El Amparo Sector | María Auxiliadora Sector | Peaje de Ceballos Sector |
|---|---|---|---|
| Light weight vehicles | 57 | 28 | 102 |
| Heavy weight vehicles | 14 | 77 | 740 |
In the sectors of Bomba de El Amparo and the Peaje de Ceballo, the confidence level established was 88 %, while for the María Auxiliadora sector it was 90 %.
The analysis shows that although the transport by the wind supposes a significant contribution of PM2.5 in the urban roads of the city, the mechanical action of the vehicles contributes, like emission, more importantly because the measurements were realized in paved roads. However, it is observed that the highest values of the emission factor are presented in the Peaje de Ceballo sector, mainly due to the fact that the registered concentrations do not only correspond to vehicular traffic but also to the contribution of pollutants originating the large number of loading docks located in industries close to the measuring station.
Finally, the values of the emission factors of mobile sources obtained for the city of Cartagena were compared with those obtained in other international investigations (Table 7).
Table 7. Estimated emission factors for the city of Cartagena and comparison with other studies (g km-1 veh).
| City | CO | PM 2.5 | Ref. | ||
|---|---|---|---|---|---|
| Lightweight vehicles | Heavy weight vehicles | Lightweight vehicles | Heavy weight vehicles | ||
| Cartagena | ----- | 42.00±1.96 | 57.00±1.96 | 14.00±1.96 | Present Study |
| Bogotá | 8.27±1.96 | 385.20±142.30 | 40.27±0.08 | 2.38±0.08 | ( 13 ) |
| Santiago de Chile | 3.50±3.90 | 28.20±15.20 | ----- | ---- | ( 18 ) |
| Copenhagen | 11.00±2.00 | ----- | ----- | ( 20 ) | |
Source: GIMA
4 Conclusions
The estimation of concentrations of atmospheric pollutants by implementing AERMOD software defined the impact of vehicular traffic on the air quality of areas close to the roads studied, enabling us to estimate the degree of concentration of pollutants emissions made by transport that contribute to the total contamination existing in these areas, demonstrating the effectiveness of the tool in the calculation of concentrations and dispersion of pollutants.
The spatial representation of the monthly average of two important atmospheric pollutants generated mainly by vehicular traffic was carried out, evidencing the areas with the greatest impact in the vicinity of the selected routes, which will allow extrapolation of the application of the inverse methodology in pathways of similar characteristics, in order to assess how residential sectors are affected by the emission of pollutants coming from vehicular traffic.
The values of the emission factors estimated in other cities (Table 7) are quite in the range obtained in the present study. Nevertheless, when estimating the emission factors, it is important to consider extensive measurement and registration campaigns, selecting a representative sample size and identifying the fixed emission sources.
In Cartagena, there is still no emissions inventory that provides detailed information on the fixed sources and the characteristics of the mobile sources. Consequently, it is difficult to know more accurately the amounts of pollutants emitted by the different emitting agents. In this regard, the creation of a single format for the registration of emissions to fill in by all those industries that have sources of pollutants in their different processes, as well as the incorporation of qualified personnel to control the records, is highly recommended. In reference to mobile sources, detailed technical information is required from the different vehicle categories as well as the general characteristics of the vehicle fleet as a whole.
The high estimated value of the emission factor corresponding to Peaje de Ceballo (740 g km-1) might be explained by the numerous loading docks for vehicles and industries surrounding the measuring station and that would contribute significantly to the high values of registered particles. For this reason, this value can be considered invalid.
The particles coming from the combustion of gasoline or diesel are generally fine or ultrafine (PM2.5 and PM0.1), with a core composed of carbon and a large area of its surface that facilitate the union of an infinity of substances such as compounds metallic, allergens, volatile organic compounds and other types of particles with which they can form aggregates with high irritative potential 32. These pollutants, which are highly detrimental to the health of people, presents high concentrations in areas of greater traffic of vehicles in the city, affecting the health of pedestrians and residents, but especially affecting the most vulnerable groups of people such as children, pregnant women or the elderly persons 33. For this reason, a study in the city that relates concentrations of PM2.5 with the different cardiorespiratory diseases caused by the inhalation of this pollutant would be especially indicated.
Acute Respiratory Infections or Diseases (ARI/ARD) is the first cause of illness and hospitalization in children aged until five years, especially in children under six months 34. In addition, Acute Respiratory infections was the third cause of death among the population (rate per 100.000 inhabitants: 29, 24 cases) 35.

