


Services on Demand
Journal
Article
 English (pdf)
 Article in xml format
 Article references
 Send this article by e-mail
Indicators
-
 Cited by SciELO
 -
 Access statistics
Related links
-
 Cited by Google
 -
 Similars in
SciELO
Similars in
SciELO -
 Similars in Google
Share

 Permalink
Cuadernos de Geografía: Revista Colombiana de Geografía
Print version ISSN 0121-215XOn-line version ISSN 2256-5442
Cuad. Geogr. Rev. Colomb. Geogr. vol.26 no.1 Bogotá Jan./June 2017
https://doi.org/10.15446/rcdg.v26n1.56021
DOI: dx.doi.org/10.15446/rcdg.v26n1.56021
Universidad Nacional de Colombia, Bogotá - Colombia
*Professor, Geography Department, Universidad Nacional de Colombia, Geotechnologies Research Group.
Mailing Address: carrera 30 n.° 45-03, edificio 212, ofc. 327, Universidad Nacional de Colombia, Bogotá, Colombia. E-mail: gvargasc@unal.edu.co
RECEIVED: 10 AUGUST 2015. ACCEPTED: 29 MARCH 2016.
Research article about relative sediment concentration in water bodies using remote sensing.
HOW TO CITE THIS ARTICLE: Vargas Cuervo, Germán. 2016. "Determination of the Relative Sediment Concentration in Water Bodies Using Remote Sensing Methodology." Cuadernos de Geografia: Revista Colombiana de Geografia 26 (1): 11-24. doi: 10.15446/rcdg.v26n1.56021.
Abstract
Studies for the determination of the relative concentration of sediments (RCS) in bodies of water such as rivers, marshes and river deltas require specialized equipment, field work and laboratory analyses of samples, all with high economic costs. Remote sensing, in regions of the optical electromagnetic spectrum, particularly in the visible range between 0.4 and 0.6 μm, shows radiometric contrasts associated with the relative concentration of sediments in water bodies. This work presents an analysis of the principal spectral, spatial and radiometric properties or characteristics of remote sensors for the determination of the relative concentration of sediments in bodies of water, a methodological process for its cartography at a given time or an established period of time. This cartography is based on digital processing of images rather than direct measurements in the field. Lastly, applications are presented for the delta coast of the southwestern area of the Colombian Caribbean between Barranquilla and Punta Piedra and in the lacustrine area of the Guajaro Reservoir and the Jobo and Capote Wetlands in the upper Canal del Dique, Colombia.
Keywords: Colombian Caribbean, concentration of sediments, remote sensing.
Resumen
Los estudios para la determinación de la concentración relativa de sedimentos (CRS) en cuerpos de agua como ríos, ciénagas o deltas fluviales requieren equipos especializados, trabajo de campo y análisis de laboratorio de muestras con altos costos económicos. Los sensores remotos, en regiones del espectro electromagnético óptico, particularmente en el rango visible entre 0.4 y 0.6 μm, permiten determinar contrastes radiométricos asociados a la concentración relativa de sedimentos en cuerpos de agua. En este trabajo, se presenta un análisis de las principales propiedades o características espectrales, espaciales y radiométricas de los sensores remotos para la determinación de la concentración relativa de sedimentos en cuerpos de agua, un proceso metodológico para su cartografía en un momento determinado y en un periodo de tiempo establecido. Esta cartografía está basada en el procesamiento digital de las imágenes pero no en mediciones directas en campo. Finalmente se presentan aplicaciones en el litoral costero y deltaico de la parte suroccidental del mar Caribe colombiano entre Barranquilla y Punta Piedra y en la zona lacustre del Embalse del Guájaro y las Ciénagas del Jobo y Capote en la cuenca alta del Canal del Dique, Colombia.
Palabras clave: Caribe colombiano, concentración de sedimentos, sensores remotos.
Resumo
Os estudos para a determinação da concentração relativa de sedimentos (CRS) em corpos d'água como rios, pâ ntanos ou deltas fluviais requerem de equipamentos especializados, trabalho de campo e análise de laboratório de amostras com altos custos econômicos. Os sensores remotos, em regiões do espectro eletromagnético ótico, particularmente na faixa visível entre 0,4 e 0,6 μm, permitem determinar contrastes radiométricos asociados à concentração relativa de sedimentos em corpos d'água. Neste trabalho, apresenta-se uma análise das principais propriedades ou características espectrais, espaciais e radiométricas dos sensores remotos para a determinação da concentração relativa de sedimentos em corpos d'água, um processo metodológico para sua cartografia num momento determinado e num período de tempo estabelecido. Esta cartografia está baseada pelo processamento digital das imagens, mas não por medições diretas em campo. Finalmente, apresentam-se aplicações na costa marítima e deltaica da parte sudoeste do Caribe colombiano entre Barranquilla e Punta Piedra, na área lacustre da barragem do Guajaro e nos pântanos Jobo e Capote na bacia alta do Canal del Dique (Colômbia).
Palavras-chave: Caribe colombiano, concentração de sedimentos, sensores remotos.
Introduction
Remote sensing is a tool with great potential to determine the relative concentration of sediment in water bodies. The most noteworthy studies and work relate to (Ji, Zhang, and Wylie 2009) which show an analysis of the sensitivity of this index through Landsat ETM +, SPOT-5, aster and MODIS sensors resulting in the calculation of the ndwi as: (Green – SWIR) / (Green + SWIR) presents the most stable thresholds for its calculation, without forgetting that it is important to calibrate the index for the different geographical positions carried out. A practical example of the use of this indicator is presented in Tragsatec (2011) in which the levels and area of the Guadalquivir wetlands are established through remote sensing techniques.
Ledesma et al. (2013) perform linear regression models based on images from Landsat 5TM and 25 sampling stations located on the Rio Tercero reservoir. The construction of the regression models was made for parameters of concentration of chlorophyll-a and the depth of the secchi disk with bands 2 and 4 of the sensor; good results were obtained for the evaluation of material deposits and the functional capacity of the reservoir. In 2012, Bonansea et al. carried out a preliminary exercise on the Rio Tercero reservoir with images from the CBERS- 2b sensor and 15 sampling sites to relate chlorophyll-a conditions and the limit of the photic zone with regression models and principal components analysis. These results were compared with the conditions of the first exercise, giving optimal results for the evaluation of the reservoir quality.
Breunig et al. (2007) related total solids in suspension, the components of chlorophyll a, b and c, water transparency and the spectrum of bi-directional reflectance in 21 field points with optical images from CBERS-2/ccd and Landsat 5/TM sensors. The relationships between the different wavelengths were found through linear relationships with low correlations, unlike the work carried out in Argentina, because of the low variability of the reservoir.
Bourgoin et al. (2007) presented an analysis of the temporal dynamics of sediments between the floodplain of Curuai and the Amazon River (Brazil) relating the network of stations of measurement of sediment throughout the Rio. Martinez et al. (2009), assessed the increase in sediments suspended by discharge in the Amazon River using MODIS images in a segment similar to Rio 1 presented by Bourgoin et al. (2007), from which direct relationships were built through the measuring stations on the river and the spectral bands of the sensor with a regression analysis. Finally Park and Latrubesse (2014), modelled the patterns of sediment distribution in the Amazon River with MODIS images, describing the annual behavior of sediments suspended over the main channel and the chain of interconnected lakes in the fluvial system; this was accomplished through the construction of regression relations (exponential and linear) between data of the sensor and stations that monitor the main channel.
Aurin, Mannino and Franz (2013) show an example in different geographical areas (Amazon River, Mississippi River, Yangtzé River and Chesapeake Bay) for the evaluation of the dispersion of sediments in the plume of rivers, coastal systems and continental water through MODIS images, with the establishment of field data regressions and the behavior of the satellite images. A complement to the evaluation of sediment by MODIS sensors is presented by Kava, Philpot and Steenhuis (2014) on historical reproduction of sediment concentration in Lake Tana in Ethiopia; as in previous studies regressions were built between field data and the selected images on the same date of the samplings in the field.
The combination and use of different satellites are also seen during the search for sediment analysis with remote sensing, as shown in (Mantas et al. 2013), which monitored the quality of water in the estuary of the Río Modego in Portugal with Landsat TM images. These were compared with MODIS through regression relations for the different elements of concentration and sediment. Previous research has used sensors other than the currently preferred MODIS sensors, as shown in Doxaran et al. (2002), which quantified the suspended particles from spot images by determining its spectral signature to high turbidity.
Long and Pavelsky (2013) in their study of concentration of suspended sediments in a complex of marshes in Canada, presented the relationships between the MODIS sensor and the behavior evaluated in field. Their greatest contribution is the theoretical review and presentation of the theoretical regression relationships for different sensors currently known under the review of the 31 authors presented.
Currently, alternative solutions are being sought for the establishment of regression relationships from the new methodologies presented by (Ibrahim et al. 2014), in their study of spatial resolution for characterization of sediments based on Geostatistics, which takes into account the spatial behavior of the analyzed variables and their regression relationship with the sensor.
Studies of the distribution of sediments in a same space are presented for the Yellow River in China and the Bohai Bay in Qiao et al. (2010), which shows the distribution and transport of suspended sediment near the mouth of the Bohai Bay, based on regression relationships between field data and selected satellite imagery. Seasonal variation of sediment was considered in the Bi et al. (2011) study for the Strait of the Bohai estuary using MODIS images as in the former. The last monitoring during 2014 for the Yellow River was made by Zhang et al. (2014) from Landsat TM and ETM + images calculating regression relationships with this sensor and compared this with the analysis of previous years.
Contributions and advances in this work show new simple methods for the analysis of satellite images with different spatial, radiometric, spectral and temporal characteristics.
Methodology
The sediments in suspension present in the bodies of water are visibly seen by their coloring, which varies depending on the concentration of the sediments from dark brown to yellowish green, in contrast to water without sediments (figure 1).
The water behaves as an electromagnetic energy absorber (black body), giving to the images dark grey to black tonalities in panchromatic or grey scale mode. The presence of sediments in suspension gives rise to great reflectance of the electromagnetic energy producing different radiometrics among the pixels present. This spectral sensibility is seen in the satellite images, particularly in the optical type in the visible spectral bands (0,4-0,7 μ).
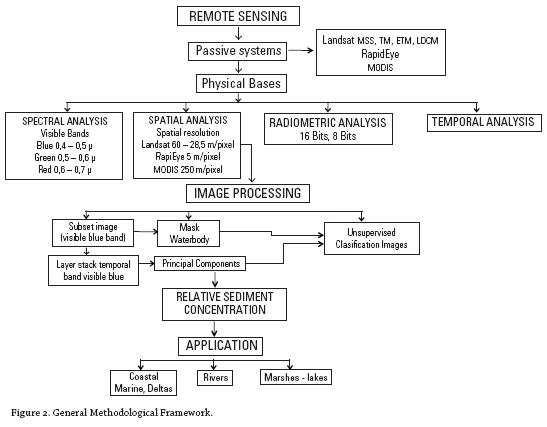
This work presents an analysis of the radiometric, spectral, spatial and temporal characteristics of the satellite images which permit cartographies of the relative concentration of sediments in bodies of water. The methodology presented comprises five main phases: establishing of remote sensors, analysis and evaluation of the physical elements of the images, digital processing, application to bodies of water and zoning of relative concentration of sediments (RCS) (figure 2).
Passive and Active Remote Sensing
Of the types of satellite images that are applied to the study of the natural resources and environment, two important categories exist: the optical images of passive sensors and the radar or microwaves images of the active systems.
The passive systems differentially register the electromagnetic energy (of different wavelengths) originating from the Sun as a product of the interaction (reflection, dispersion, transmission, absorption) with a physical element of the atmosphere, hydrosphere or terrestrial surface. The water presents different contrasts defined by variations of the radiometric values. These images allow discrimination of sediments in the water by specific spectral ranges.
In the radar or microwave systems, the energy is artificially created with wavelengths between 1 cm and 100 meters and the water behaves as anenergy absorbent and its contrasts are determined by the roughness of these (flat or rough surfaces). In active or radar systems, the radiometric contrast by concentration of sediments is not operative and therefore they are not apt for the analysis.
Spectral Analysis
Spectral resolution in remote sensing is the capacity to register bands with diverse wavelength ranges. According to the remote sensing spectrum, wavelengths of optical images of passive sensors range from visible blue (0,4 μ) to the thermal infrared (15 μ). The spectral bands determined by the wavelength display different behaviors when they interact with the terrestrial elements of the atmosphere, hydrosphere, biosphere and the lithosphere.
Taking into account that water with sediments is sensitive to the visible bands (reflection) and in near and medium infrared its behavior is homogeneous (energy is absorbed, behaving as a black body) and in the thermal bands is emissive due to its heat capacity (figure 3).
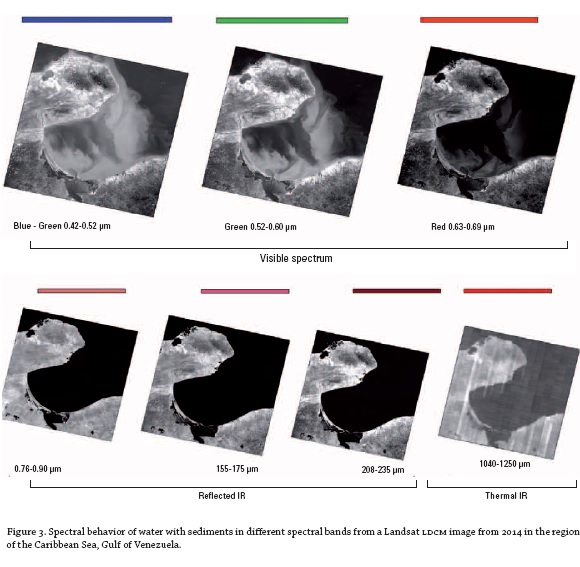
According to this analysis, the spectral bands that best discriminate water with sediments are, in order of decreasing reflectance, the visible blue, green and red bands (0,4-0,7 μ). Therefore, the sensors that include the blue band (0,4-0,5 μ) must carry out the analysis with this and where it is not recorded with the green band (0,5-0,6 μ) (figure 4).
Spatial Analysis
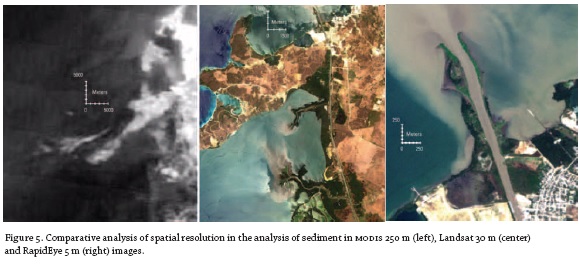
Spatial resolution is the dimensions of the pixels of the image with respect to the ground. Satellite images have different spatial resolutions ranging from centimeters to kilometers and their use depends on the spatial characteristics of the elements to be studied and the availability of the images.
Images used for this analysis, depending on availability, are Landsat images with resolutions between 60 and 28,5 meters and RapidEye 5 m/pixel images. Also evaluated was the use of MODIS images that present good spectral and temporal resolution, but their spatial resolution is very low (250 m/pixel), which limits the study. Landsat Images are free and have a medium resolution of 30 m which permits good spatial reach; high resolution spatial images such as Ikonos, Quickbird, and RapidEye have the advantage of their spatial and spectral resolution, but their greatest limiting factor is cost (figure 5).
Radiometric Analysis
The radiometric resolution of a satellite image is determined by the capacity of the number of possible values that a pixel can have. This value is determined in bits. The radiometric value of Landsat imagery varies from 6 bits for MSS, 8 bits (256 values) for TM and ETM and 16 bits (65.536 values) for LDCM. RapidEye has a radiometric resolution of 16 bits (figure 6).
Temporal Analysis
The temporal resolution of an image is determined by its ability to record images from a same site on its way through the orbit. Landsat has a temporal resolution of 16 days, which facilitates the obtaining of multi-temporal images, RapidEye of 5.5 days and other satellites achieve up to two daily scenes. Another important aspect is the availability of images at a given period of time. Landsat is the best sensor because of its recordings since 1973 which permit monitoring over a large period of time.
Digital Processing
This part presents the methodological procedures to obtain cartography of the relative concentration of sediments in bodies of water in two scenarios: one scenario at a specific time based on a recording of an image and another scenario which integrally shows the behavior of the sediments at a specific time.
The digital processing of the images for the determination of the relative concentration of sediments at a given moment or date from the recording of an image is as follows (figure 7):
- a. Identification of the scene or images to be individually evaluated.
- b. Import: the scenes or images are imported.
- c. Georeferencing: images are ortho-rectified in this step and reprojected to the corresponding mapping system according to their local origin.
- d. Radiometric enhancement: the dynamics of the image are enhanced through radiometrically for greater capacity to discriminate pixels in the 8 bit to 16 bit range. These processes are done through the application of Stretching functions or standard deviation, linear, Gaussian, and dynamic stretching processes.
- e. Extraction of the subscene of the study area: the zone corresponding to the area of interest is extracted from the scene.
- f. Extraction of the blue visible Band: over the zone of interest the blue visible band is extracted.
- g. Extraction of bodies of water: a "mask" is created and solely the zone of the body of the water to be studied is extracted.
- h. Classification: an unsupervised classification process is applied with thirty classes and ten interactions.
- i. Edition and color of classes: a palette of concentration classes is applied from blue (very low) to red (very high).
To obtain a cartography that integrates in an image map the behavior of the concentration of sediments for a specific period, the following steps are carried out (figure 8):
- a. Various multitemporal images to be integrated in the analysis are selected.
- b. All the visible blue multitemporal spectral bands are compiled in an image file.
- c. An application of principal components analysis is done on this image file.
- d. A process of non-supervised classification is made on the results of the first principal component (30 classes and 10 interactions).
- e. Edition and color of classes: a palette of concentration classes is applied from blue (very low) to red (very high).
Applications
As examples of these methodological processes, applications were made in coastal zones, river deltas and wetlands.
Application in coastal areas
The behavior of sediments in coastal areas depends on several factors such as the geometry and depth of the coastal seabed, the presence of beaches, oceanographic conditions, (particularly tides and marine currents), contribution of sediments from river flows or deltas, the morphology and geology of the coast, among others.
The regional application of the relative concentration of sediments by remote sensing in the Caribbean Sea between Barranquilla and Punta Piedra to the south of the Sinu River delta was done using a mosaic of Landsat ETM images from 2001 (figure 9).

From the behavior of the relative concentration of sediments in this area, it can be established that:
- The sediments in the south-western part of the Caribbean coast come from three important sources: the Magdalena River at its delta (Bocas de Ceniz), the river system of the Canal del Dique and the Sinu River delta.
- There is a significant migration of a sediment bar in the coastal zone descending towards the SW from Barranquilla to Puerto Velero.
- The high concentration of sediments contributed by the river system of the Canal de Dique notably affects the Cartagena and Barbacoas Bays, at times reaching the Islas del Rosario.
Direct field measurement references for the concentration of sediments show values of 144 mg/l in the Bay of Cartagena near the plume of sediments of the Canal del Dique, of 51 mg/l in the northern part of the island of Tierrabomba, of 35 mg/l in the Bay of Barbacoas, in the Bocachica sector, of 43 mg/l in the plume of the Caño Matunilla and of 32 mg/l in the distal part of its plume toward the sw. Between Peninsula of Barbacoas and the Island of Rosario, total sediment concentration registers 34 mg/l.
Application in Wetlands
This process of multitemporal analysis was applied to the system of wetlands of the upper basin of the Canal del Dique corresponding to the Guajaro Wetlands or Reservoir, the Jobo Wetlands and the Capote Wetlands (figure 10). The behavior of sediments in the floodplains of the Canal del Dique is variable and depends on several factors such as: contributions from mountain areas by diffuse and laminar runoff, exchange of water with the Canal del Dique, air contributions due to wind effects and anthropogenic activities, among others.
The influence of the contribution of sediments from the mountain ranges of the Sinú and San Jacinto that border these wetlands is determined by the morphology of the land, the type of lithological materials, the density of the hydrographic network, the type and density of vegetation cover and the presence of stripping processes such as erosion and mass removal. Some other specific observations of the relative concentration of sediments in these bodies of water are:
- In general there is an increase in the concentration of sediment from 1978 to 2014.
- Sedimentation in the wetlands and the Reservoir is spatially and temporally dynamic.
- In 1989, there was a decrease in the concentration of sediment in the wetlands of Capote and El Jobo, an evident increase in the Guajaro Reservoir and the wetlands of the right bank of the Canal del Dique in the middle part. The highest concentration was in the Palotal and Juan Gomez delta.
- In 1998, the El Niño phenomenon, in general, decreased the concentration of sediment in the wetlands. Capote, El Jobo and Guajaro Reservoir showed a predominantly moderate concentration.
- In 2002, there was a notable increase in the concentration of sediment in the wetlands of Capote, El Jobo and the sw part of the Guajaro Reservoir (very high). In the middle and the delta there was a slight reduction in sediments.
- In 2013, there was a slight decrease in the concentration of sediment in the wetlands of Capote, El Jobo and the Guajaro Reservoir (moderate to high). In the middle and the delta the concentration went from generally very low to nil.
- In May 2013 the concentration of sediments in the El Jobo wetlands went from low to high, in the Capote wetlands it continued moderate to high with more predominant sediment on its western side. In the Guajaro Reservoir the concentration diminished in the northern part and there was a greater concentration of sediments in the sw area.
- On February 25, 2014, a significant increase in the concentration of sediments in the El Jobo wetlands was seen, going from high to very high. There was a slight lessening of sediments in the Capote wetlands and a high concentration in the nw part of the Guajaro Reservoir.
- On March 13, 2014, there was a decrease in the concentration of sediment in the El Jobo (from very high to high) and Capote (high to moderate) wetlands and the Guajaro Reservoir (very high to high-moderate). In the delta there was a slight increase in sediments.
- On March 29, 2014, there was an increase in the concentration of sediment in the Capote and El Jobo wetlands and the Guajaro Reservoir (in the sw part from high to very high).
- On April 1, 2014, there was a slight decrease in the concentration of sediment in the Capote and El Jobo wetlands and the Guajaro Reservoir (in the northern part from moderate to high).
- Field measurements between 1996 and 1997 (Corredor and Castro 2008) in this sector show total sediment transport values between 0,340 to 4,904 kg/m3.
Application in Rivers
The larger rivers mainly in the zones of confluence with other fluvial channels show important differences in sediment loads in suspension and depth. This methodological process obtains relative reflectance values in water bodies to determine the relative concentration of sediments suspended on the surface. For this case, an application was carried out in the confluence of the Cauca River with the lower Magdalena River in the Momposina Depression (figure 11).
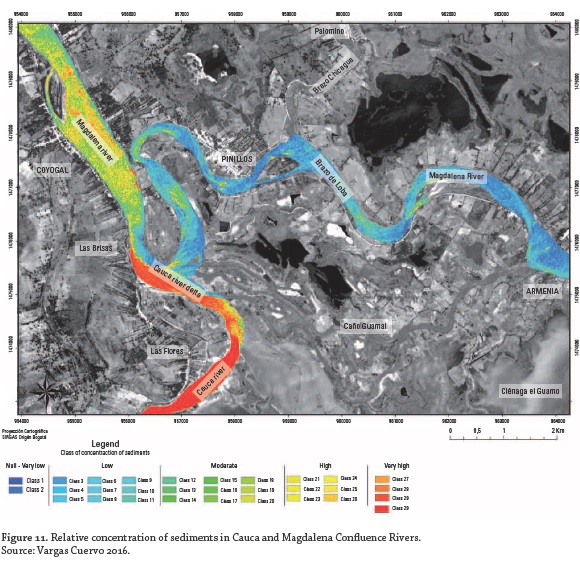
In this case, the radiometric values of the water measured on the 16 bit RapidEye image from 2015 showed ranges between 2.869 and 18.972, with an average value of 4.873. Spatially, the relative concentrations of sediments are very high in the Cauca River which affects the lower Magdalena River. Field measurements between 1998 and 2002 (Corredor and Castro 2008) in this sector show total sediment transport values in the Armenia sector before the confluence of the Cauca River between 0,255 to 1,14 kg/m3, in the Cauca River at the confluence with the Magdalena between 0,275 to 1,678 kg/m3, and at Coyongal after the confluence of the Cauca River between 0,235 to 1,48 kg/m3.
Conclusions
The methodologic work presented here permits a rapid diagnostic and monitoring of the relative concentration of sediments in water bodies. It satisfactorily applies to images with medium (30 m/pixel) to high (50 cm) spatial resolutions and over visible blue, green or red spectral bands, with best results in the first band (0,4 a 0,5 μm).
The ease of acquiring Landsat images every 16 days, their free cost, and their spectral characteristics make monitoring of these processes over time and space quite accessible. The digital processing of the images presented here is simple and can be replicated by professionals and technicians without need for significant knowledge of remote sensing.
The ease of cartographic observation of the relative concentration of sediments permits establishment of zones, focal points or sources contributing sediments to bodies of water. As well, it is useful in the environmental monitoring and diagnostic of coral areas or fragile ecosystems.
References
Aurin, Dirk, Antonio Mannino, and Bryan Franz. 2013. "Spatially Resolving Ocean Color and Sediment Dispersion in River Plumes, Coastal Systems, and Continental Shelf Waters." Remote Sensing of Environment 137:212-225. doi: 10.1016/j.rse.2013.06.018. [ Links ]
Bi, Naishuang, Zuosheng Yang, Houjie Wang, Fan Dejiang, Xiaoxia Sun, and Kun Lei. 2011. "Seasonal Variation of Duspended-sediment Transport Through the Southern Bohai Strait." Estuarine, Coastal and Shelf Science 93 (3): 239-247. doi: 10.1016/j.ecss.2011.03.007. [ Links ]
Bonansea, Matias, Claudia Ledesma, Claudia Rodríguez, and Angel Ramon Sánchez. 2012. "Concentración de clorofila-a y límite de zona fótica en el embalse Rio Tercero (Argentina) utilizando imágenes de satélite CBERS-2B." Revista Ambiente & Agua-An Interdisciplinary Journal of Applied Science 7 (3): 61-71. doi: 10.4136/ambi-agua.847. [ Links ]
Bourgoin, Laurence M., Marie-Paule Bonnet, Jean-Michel Martinez, Pascal Kosuth, Gerard Cochonneau, Patricia Moreira-Turcq, Jean-Loup Guyot, Philippe Vauchel, Naziano Filizola, and Patrick Seyler. 2007. "Temporal Dynamics of Water and Sediment Exchange Between the Curuaí Floodplain and the Amazon River, Brazil." Journal of Hydrology 335 (1-2): 140-156. doi: 10.1016/j.jhydrol.2006.11.023. [ Links ]
Breunig, Fábio M., Flávio Wachholz, Waterloo Pereira, and Conrado de Moraes Rudorff. 2007. "Análise das propriedades ópticas da agua do reservatorio Rodolfo Costa e Silva: Itaara, rs, Brasil, usando dados espectrais de campo e imagens orbitais multiespectrais." Revista Ambiente & Agua: An Interdisciplinary Journal of Applied Science 2 (2): 88-102. [ Links ]
Corredor, Holbert, and Gabriel Castro. 2008. "Caracterización hidráulica, sedimentológica y morfológica del río Magdalena entre la Gloria (K459) y el Puente Pumarejo (K 1)." En Río Magdalena Navegación Marítima y fluvial (1986-2008), editado por Manuel Alvarado, 15-56. Barranquilla: Uninorte. [ Links ]
Doxaran, David, Jean-Marie Froidefond, Samantha Lavender, and Patrice Castaing. 2002. "Spectral Signature of Highly Turbid Waters Application with spot Data to Quantify Suspended Particulate Matter Concentrations." Remote Sensing of Environment 81 (1): 149-161. doi: 10.1016/S00344257(01)00341-8. [ Links ]
Ibrahim, Elsy, Stefanie Adam, Aaike de Wever, Annelies Govaerts, Andre Vervoort, and Jaak Monbaliu. 2014. "Investigating Spatial Resolutions of Imagery for Intertidal Sediment Characterization Using Geostatistics." Continental Shelf Research 85 (15): 117-125. doi: 10.1016/j.csr.2014.05.012. [ Links ]
Ji, Lei, Li Zhang, and Wylie Bruce. 2009. "Analysis of Dynamic Thresholds for the Normalized Difference Water Index." Photogrammetric Engineering & Remote Sensing 75 (11): 1307-1317. [ Links ]
Kaba, Essayas, William Philpot, and Tammo Steenhuis. 2014. "Evaluating Suitability of MODIS-Terra Images for Reproducing Historic Sediment Concentrations in Water Bodies: Lake Tana, Ethiopia." International Journal of Applied Earth Observation and Geoinformation 26:286-297. doi: 10.1016/j.jag.2013.08.001. [ Links ]
Ledesma, Claudia, Matías Bonansea, Claudia Rodríguez, and Ángel R. Sánchez. 2013. "Calidad del agua en el embalse Rio Tercero (Argentina) utilizando sistemas de información geográfica y modelos lineales de regresión." Revista Ambiente & Agua: An Interdisciplinary Journal of Applied Science 8 (2): 67-76. doi: 10.4136/ambi-agua.1113. [ Links ]
Long, Colleen M., and Tamlin M. Pavelsky. 2013. "Remote Sensing of Suspended Sediment Concentration and Hydrologic Connectivity in a Complex Wetland Environment." Remote Sensing of Environment 129 (15): 197-209. doi: 10.1016/j.rse.2012.10.019. [ Links ]
Mantas, V. M., A. J. S. C. Pereira, J. Neto, J. Patrício, and J. C. Marques. 2013. "Monitoring Estuarine Water Quality Using Satellite Imagery: The Mondego River Estuary (Portugal) as a Case Study." Ocean & Coastal Management 72:13-21. doi: 10.1016/j.ocecoaman.2011.06.013. [ Links ]
Martinez, J. M., J. L. Guyot, N. Filizola, and F. Sondag. 2009. "Increase in Suspended Sediment Discharge of the Amazon River Assessed by Monitoring Network and Satellite Data." Catena 79 (3): 257-264. doi: 10.1016/j.catena.2009.05.011. [ Links ]
Park, Edward, and Edgardo M. Latrubesse. 2014. "Modeling Suspended Sediment Distribution Patterns of the Amazon River Using MODIS Data." Remote Sensing of Environment 147 (5): 232-242. doi: 10.1016/j.rse.2014.03.013. [ Links ]
Qiao, Shuqing, Xuefa Shi, Aimei Zhu, Yanguang Liu, Naishuang Bi, Xisheng Fang, and Gang Yang. 2010. "Distribution and Transport of Suspended Sediments off the Yellow River (Huanghe) Mouth and the Nearby Bohai Sea." Estuarine, Coastal and Shelf Science 86 (3): 337-344. doi: 10.1016/j.ecss.2009.07.019. [ Links ]
Tragsatec. 2011. Determinación mediante técnicas de teledetección de niveles y superficie inundada de humedales incluidos en la demarcación hidrográfica del Guadalquivir. Madrid: Dirección General del agua, Ministerio de Medio Ambiente y Medio Rural y Marino, Gobierno de España. [ Links ]
Vargas Cuervo, Germán. 2016. Proyecto Susceptibilidad al cierre del Meandro de Pinillos en el río Magdalena: componente geología, geomorfología, morfodinámica y sedimentos. Informe técnico Barranquilla: Uninorte y Cirmag. [ Links ]
Zhang, Minwei, Qing Dong, Tingwei Cui, Cunjin Xue, and Songli Zhang. 2014. "Suspended Sediment Monitoring and Assessment for Yellow River Estuary from Landsat TM and ETM + imagery." Remote Sensing of Environment 146 (25): 136-147. doi: 10.1016/j.rse.2013.09.033. [ Links ]
Recommended reading
Consorcio Dique. 2014. Proyecto de Restauración del Sistema del Canal del Dique. Cartagena: Consorcio Dique. [ Links ]
Corredor, Holbert. 2008. "Caracterización hidráulica, sedimentológica y morfológica del río Magdalena entre Calamar (K0) y Pasacaballos (K 117)." En Río Magdalena Navegación Marítima y fluvial (1986-2008), editado por Manuel Alvarado, 114-183. Barranquilla: Uninorte. [ Links ]
Guttler, Fabio, Simona Niculescu, and Francis Gohin. 2013. "Turbidity Retrieval and Monitoring of Danube Delta Waters Using Multi-sensor Optical Remote Sensing Data: An Integrated View from the Delta Plain Lakes to the Western-northwestern Black Sea Coastal Zone." Remote Sensing of Environment 132:86-101. doi: 10.1016/j.rse.2013.01.009. [ Links ]
Vargas Cuervo, Germán. 2014. "Componente geología, geomorfología, morfodinámica y sedimentos." En Proyecto de Restauración del Sistema del Canal del Dique. Cartagena: Consorcio Dique. [ Links ]

