


Serviços Personalizados
Journal
Artigo
 texto em
  Espanhol (pdf)
 Artigo em XML
 Referências do artigo
 Enviar este artigo por email
Indicadores
-
 Citado por SciELO
 -
 Acessos
Links relacionados
-
 Citado por Google
 -
 Similares em
SciELO
Similares em
SciELO -
 Similares em Google
Compartilhar

 Permalink
Revista Facultad de Odontología Universidad de Antioquia
versão impressa ISSN 0121-246X
Rev Fac Odontol Univ Antioq vol.25 no.1 Medellín jul./dez. 2013
ORIGINAL ARTICLES DERIVED FROM RESEARCH
TERMINING FACIAL BIOTYPE BASED UPON PHENOTYPIC FEATURES THROUGH STRUCTURAL EQUATION MODELING: A STUDY OF THREE ETHNIC
Antonio Bedoya Rodríguez1; Julio César Osorio Patiño2; Julián Andrés Tamayo Cardona3
1 Or thodontist. Sc.D. Specialization in Or thodontics and Maxillary Or- thopedics. Institución Universitaria Colegios de Colombia (Unicoc) at Cali. E-mail address: nbedoya@unicoc.edu.co
2 Biologist. Msc. Specialization in Or thodontics and Maxillary Or thope- dics. Institución Universitaria Colegios de Colombia (Unicoc) at Cali. E-mail address: jcosorio@unicoc.edu.co
3 Statistician. Specialization in Or thodontics and Maxillary Or thopedics. Institución Universitaria Colegios de Colombia (Unicoc) at Cali. E-mail address: jtamayo@unicoc.edu.co
SUMBITTED: MARCH 5/2012-ACCEPTED: JULY 30/2013
Bedoya A, Osorio JC, Tamayo JA. Determining facial biotype based upon phenotypic features through structural equation modeling: a study of three ethnic groups. Rev Fac Odontol Univ Antioq 2013; 25(1): 132-146.
ABSTRACT
INTRODUCTION: the various phenotypic characteristics may be grouped; also, their individual and collective influence may be determined when defining a biotype. Structural equation modeling (SEM) is based on causal relations so that the change in a variable is supposed to produce a change in another variable. This model was used to validate causal relations using different types of mediating variables: masticatory force, transverse measures, dental arches, bizygomatic width, and morphological face height. METHODS: this study included 197 preteens between 12 and 14 years of age with dental neutroclusion, distributed like this: 33% mestizos, 35% of African descent, and 32% indigenous. The hypothetical model was statistically tested through structural equation modeling. RESULTS: the model is well fitted to the data since goodness of fit indicators such as RMSEA = 0.078, RMR index magnitude = 0.061, and CIF = 0.988 were within the expected limits. The parameters were significant to a 5%, except for facial index with masticatory force. Factor loads ranged from 0.55 to 0.92 and negative factor loads between the facial index and dental arch transverse measures (—0.60). CONCLUSIONS: this model shows that the variable that best correlates with facial biotype is masticatory force (0.82), followed by dental arches relation (0.73), this being a moderate correlation.
Key words: anthropometry, odontometry, dental arches, masticatory force, facial height, facial width.
INTRODUCTION
Human biotypes should be considered as a model to describe phenotypic variations of individuals within a population or among populations. Medical anthropology is now part of this field as it has established morphological patterns of populations that have been used as tools for clinical decision- making. Through history, many authors have proved the importance of facial biotype for treatment planning and prognosis.1-6 In 1957, Martin and Saller described facial biotype as the facial height from nasion to gnation (N-Gn) multiplied by one hundred, divided by the width measured from the zygomatic point on the right to the one on the left.7 Many studies have used this index to determine facial biotype but there are few descriptions on how ancestry influence facial biotype or is related to it. In the past 10 years, some evidence has been provided on the effect of ethnicity on facial variations in different biotypes.8-10
The craniofacial skeleton morphology and the skull- cervical relationship are both influenced by masticatory and respiratory functions. 11 It has been reported that masticatory force in adults with rectangular craniofacial morphology and skeletal deep bite is higher than in individuals with long-face morphology and open bite.12 Other studies have evaluated masticatory force among different population groups providing valuable information for assessing occlusal function and post- orthodontic treatment.13 The relationship between masticatory function and craniofacial morphology has also been reported.14
Transverse measurements of dental arches have also been used for classifying arch shapes,15 using variables such as gender, teeth size, and age. Furthermore, other studies have evaluated the way facial length tends to increase as interdental width tends to decrease.16 It has been shown that the transverse dimensions and the sagittal measurements of dental arches are influenced by the type of ancestry of population groups.17 The craniofacial skeleton morphology and the skull- cervical relationship are both influenced by masticatory and respiratory functions.11 It has been reported that masticatory force in adults with rectangular craniofacial morphology and skeletal deep bite is higher than in individuals with long-face morphology and open bite.12 Other studies have evaluated masticatory force among different population groups providing valuable information for assessing occlusal function and post- orthodontic treatment.13 The relationship between masticatory function and craniofacial morphology has also been reported.14
Transverse measurements of dental arches have also been used for classifying arch shapes,15 using variables such as gender, teeth size, and age. Furthermore, other studies have evaluated the way facial length tends to increase as interdental width tends to decrease.16 It has been shown that the transverse dimensions and the sagittal measurements of dental arches are influenced by the type of ancestry of population groups.17
A recent analysis used the fuzzy clustering statistical technique to classify morphological facial biotypes, finding out that, depending on the population ances- try, various categories and number of facial biotype categories are generated. It also pointed out the defi- ciencies of the facial morphological index proposed by Martin and Saller (1957) when classifying indi- viduals without taking ancestry into consideration.18
Another study claims that masticatory force and dental arch shape form a biotype typology and that facial index is related to these two variables, that is, that in conjunction they can determine facial biotype due to certain relationship between them (unpublished data). Based on this evidence, we can conclude that a single variable is not sufficient to determine a facial biotype, but rather there are other variables such as masticatory force and dental arch shape which can define it. Therefore, the goal of this study is to validate the cause (morphological feature)-effect (biotype post-application of the suggested model) relations from different types of mediating variables (causes): masticatory force, transverse measurements of dental arches, bizygomatic width, and morphological face height. This variables contribute in determining an individual's facial biotype (effect) in a preadolescent population belonging to three ethnic groups (mestizos, African descent, and indigenous).
It should be noted that, although a correlation between two variables does not imply a causal relationship between them, a causal relationship does imply correlation between variables. Structural equation modeling (SEM) assumes the existence of an underlying mechanism leading to a theoretical covariance structure among the variables, that is to say, there is a causal relationship by which a change in a variable is supposed to produce a change in other variables.19 The term causality comes from the possibility of SEM allowing comparisons of cause- effect theoretical propositions without manipulating variables, but if such propositions are supported, this does not prove that causal assumptions are correct.
METHODS
A total of 196 preteens from three ethnic groups (mestizo, African descent and indigenous) between 12 and 14 years of age provided information on clinical measurements such as masticatory force, transverse measurements of dental arches, nasion (N) to gnation (Gn) measurements, and measurements from right zygomatic point (rZ) to left zygomatic point (lZ). The final sample consisted of 65 preteens from a mestizo population of the municipality of Santiago de Cali (Valle del Cauca), 69 kids belonging to a population of African descent from the municipality of Puerto Tejada (Cauca), and 62 from a ticuna indigenous community located in Leticia (Amazonas). The sample was intentionally selected from three schools representing the three ethnic groups under study; in each school, all preteens between 12 and 14 years of age were examined and evaluated with clinical observations.
Informed consents were obtained from parents or guardians of the children under study, as well as from the schools' directors. This research pro- ject was approved by the Ethics Committee of In- stitución Universitaria Colegios de Colombia and it was considered to have no risk for the participants.
inclusion and exclusion criteria
All the participants had to prove three generations of ancestors, confirmed by direct communication with the subjects before starting the study. The basic information requested included the existence of relatives in the third degree of consanguinity belonging to that community. These requirements were also confirmed: a healthy dental condition, with no previous treatment of maxillary orthopedics or orthodontics, molar relation Angle class I, and canine I bilateral relationship, with all erupted teeth in occlusal contact with their opponent and with no congenital anomalies. The sample included only preteens with a body mass index (BMI) between 18.5 and 24.99.
Measurements analyzed
Facial morphology
Two clinical measurements of each child's face were obtained. For this purpose, a Bull-tools digital caliper was used (up to 0.01 mm accuracy). Measurements were taken from nasion (N) to gnation (Gn) and from right zygomatic (rZ) to left zygomatic (lZ). These are the measurements used in calculating facial morphological index (FMI) which is obtained from the relationship between morphological face height (from N to Gn) and bizygomatic width (rZ - lZ).
Maximum masticatory force
To measure masticatory force, we used a gnatodynamometer (GM10 Nagano Keiky Japan) with a measurement range of 0-1000 N with an accuracy of ± 1 N.20
Masticatory force was recorded
To measure masticatory force, we used a gnatodynamometer (GM10 Nagano Keiky Japan) with a measurement range of 0-1000 N with an accuracy of ± 1 N.20 Masticatory force was recorded in Newtons (1 kgf = 9, 81 N) in three areas of the dental arches: incisors, premolars and molars. Three masticatory force measurements were taken in each of the areas evaluated, recording the maximum number only (greater masticatory force) of the three measurements in each of these areas for information analysis. Masticatory force measurements were taken with five-minute intervals each time there was a change in zone, in order to avoid muscle fatigue.
Transverse dimensions of the dental arches
Alginate impressions were taken and type III plas- ter models were obtained. A Bull-tools digital cali- per (up to 0.01 mm accuracy) was used to record the distance in both the upper and lower maxilla. In the upper maxilla, the distances were taken from the bottom of the central sulcus of the first right premolar to the bottom of the central sulcus of the first left premolar. The molars' transverse width was measured between the central mesial fossae of the first right and left permanent molars. For the lower maxilla, these measurements were taken from the buccal cusp tips of the first left and right premolars.
Finally, the molars were measured using the tips of the half-buccal cusps of the right and left first molars. Final evaluation was followed by standardization of the measurements of facial morphology, masti- catory force and transverse dimensions, with two evaluators, on a pilot sample of 20 patients treated at Unicoc Orthodontic Clinic (Cali), obtaining an intraclass correlation index greater than 0.85 for all the measurements under study; this means that the obtained value shows good inter-observer agree- ment. Two evaluators were needed to complete the measurements in less time.
Hypothesized model
Figure 1 shows the facial biotype hypothesized model used to test predictor variables (masticatory force, transverse measurements of dental arches, and facial index with N-Gn and rZ-lZ measurements) and their ability to explain the proposed facial biotype model. This model shows that masticatory force, dental arch shape, and facial index biotype all form a biotype typology, the latter being associated with masticatory force and dental arch transverse measurements. It can be seen that these two facial biotype components are therefore latent variables, each measured by several indicators or by their respective measurements.

This model shows how masticatory force expresses the importance of masticatory function, which, by involving masticatory muscles and bony structures, induce skeletal changes. This may directly influence craniofacial development affecting the transverse dimensions of dental arches and mandible functions; it has been observed that patients with wide dental arches have broad faces and greater masticatory force, while patients with narrow dental arches have lower masticatory force and long faces.17, 20
Statistical analysis
For statistical analysis we used SEM from "R language and environment for statistical computing"21 under lavaan library version 0.3-1, to analyze the facial biotype of this group of individuals considering three different types of mediating variables: masticatory force, dental arches, and measurements from N to Gn and rZ to lZ. Unlike the multiple regression model, SEM allows including unobserved latent variables (facial biotype) inferred from observable variables—which are their indicators.21
The model was created as a way to obtain a measurement of the specified model's latent variables; it was therefore necessary to specify the equations to relate each of these concepts with their indicators, i.e., a measurement model and a structural one were developed to form the facial biotype. The equation that links the latent variables to the observed ones or Χ indicators is shown below in a matrix, where Ξ is the exogenous latent variable, Λx is the matrix of coefficients of exogenous variable indicators, and d are measurement errors.
Χ= Λx Ξ+δ
The structural model specified causal linear equations between the model's latent variables, using the following equation, where Ξ is the exogenous variable, +υ is the coefficient matrix of the exogenous variable, and ? is the random disturbance term.
Ξ=Τ Ξ+υ
Thus, the resulting structural equation for the mod- el was as follows.21, 22
Masticatory force = force of incisors area + right premolar force + right molar force + left premolar force + left molar force + facial index.
Dental arch = upper front transverse diameter + upper posterior transverse diameter + lower front transverse diameter + lower posterior transverse diameter facial + facial index.
Biotype = masticatory force + dental arch.
Calculating the model's parameters implied determin- ing unknown parameter values and their respective measurement error. To this end, we obtained the var- iance-covariance matrix for the ten variables, which previously failed the multivariate normality test. Therefore, we used the method of maximum robust likelihood as an alternative estimation technique.
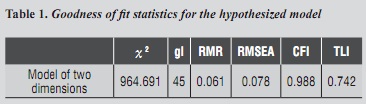
The SEM estimation method used was maximum robust likelihood due to non-data multivariate normality (Mardia = 112.5 p-value <5%). Goodness of fit was evaluated by Χ2 statistics, but Χ2 is sensitive to sample size and non-normal data distribution, so this indicator was complemented with other fitting indices such as Root Mean Square Error of Approximation (RMSEA and RMR), Comparative Fit Index (CFI) and Tucker-Lewis Index (TLI).23, 24 The level of significance for all the tests was 0.05. results
RESULTS
The model's goodness of fit was assessed through several indices such as RMSEA, RMR, CFI, TLI, and Χ2 statistics. Table 1 shows goodness of fit statistics for the hypothesized model (table 1). According to these indicators, the model is well fitted to the data; however, the Χ2 value was very high (Χ2 = 964,691), which may be due to data not meeting multivariate normal distribution standards, so no conclusion can be drawn from this statistic model. RMSEA = 0.078 did not exceed the critical limit of 0.10, the magnitude of standardized RMR = 0.061 was not excessive, and CIF = 0.988 was higher than 0.95, so the model hypothesis was not rejected.
All of the parameters of this model were significant at a 5% level, except for the parameter of facial index with masticatory force. Figure 2 shows the estimates of all the model's significant parameters (except the parameter of facial index with mastica- tory force). In order to facilitate model interpreta- tion, the estimates were standardized.
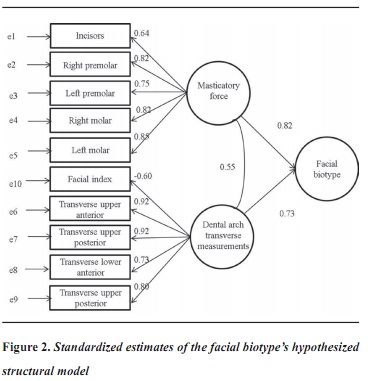
The values next to the arrows, which go from the constructs to measure variables, indicate the "load factor" of the indicator variables or those directly observable in the common factor. These loads represent standardized estimates that measure the degree of correlation with the construct. Within the positive values, these factor loads ranged between 0.55 and 0.92; and there was only one negative factor load between the facial index and the dental arch transverse measurements (—0.60). The two latent variables were well defined in terms of both masticatory force and forces of the right premolar and molar, and they were the ones showing the greatest effect (0.82 in both cases). Regarding dental arches, the variable with the lowest correlation was lower front transverse diameter (0.73) and the ones with the highest correlation were upper posterior and anterior transverse diameter (0.92 in both cases). Facial index was the measurement showing the least correlation with dental arch measurement (—0.60).
DISCUSSION
The hypothesized model for determining facial biotype was statistically tested through structural equation modeling, which allowed testing and estimating causal relationships coupled with theoretical assumptions about facial biotype determination.25 The results showed that all the coefficients of the model initially proposed, composed of ten variables (face width, face height, facial index, distance between upper premolars, distance between lower molars, distance between lower premolars, distance between upper molars, maximum masticatory force between incisors, premolars and molars) were not significant; however, the model was well fitted, which means that it reproduced the behavior of the observed data in a reasonably good manner in all the three ethnic groups. The non-significant parameter referred to the relationship between masticatory force and facial index, suggesting the absence of shared features between them.
The resulting model describes a well-fitted facial biotype of mestizo, Afro Colombian, and indigenous preteens from a Colombian population. This helps to explain, through masticatory force, dental arch, and facial index, the morphological patterns of patients' face, taking into account each individual's ancestry. Although the Χ2 value was significant—perhaps due to variable distribution (not normal)—, the practical indicators yielded appropriate values (within acceptable ranges), which indicated that the theoretical relationship model was supported by the data and that these two groups of variables (masticatory force and transverse diameters) suggested for facial biotype assessment are appropriate. Another important aspect this study sought to explain was verifying the existence of a relationship between masticatory force, dental arch shape, and facial index. Scientific evidence shows that these variables have certain relationship. It has been determined that occlusal force influences maxillofacial morphology and mandibular condyle morphology.26
Another study found out that patients with muscular dystrophy have a long- face facial structure, characterized by increased height of the lower facial third and open bite.25 Studies that stimulate the masticatory function of children with long-face syndrome showed that occlusal force increased by stimulating mandibular growth.26 Furthermore, it should be noted that individuals with large masticatory volume tend to be called "short face". This shows that the vertical dimensions are closely related to occlusal force.27-32 Measurements in Amazonian populations have shown that masticatory force increases from childhood to adolescence and is related to facial index.33 The present study proved a strong relationship among the variables under study, which account for the latent variables, and a strong relationship among the latent variables determined by the model, confirming the relevance of these variables to define the assessed construct.
This model allows for an estimate of individuals' fa cial biotype and therefore for a consideration of each individual's ancestry when determining facial biotyp —as well as for the other variables taken into accoun in this study—. It is not the same assuming (withou proving) that certain measurements determine facia biotype than having elements to support this assump tion, as the results of the present study demonstrate.
Facial biotype estimation seems to be explained mostly by individuals' masticatory force. Thi shows that masticatory force influences facial bio type determination, confirming the role of the influ ence of extra-skeletal tissue and bone growth.16, 33-36
This study seems to indicate the usefulness o modeling facial biotype because it contextualize biotypes considering ethnicity and the shown differences between individuals from differen populations.18
Homo sapiens' face inevitably shows different ethnic phenotypes (ethnic appearances) as a product of micro-evolutionary processes, gene flow, and continental migrations. By studying Amazonian populations belonging to ethnic groups (ticuna, huitoto, and cocama), Aragon et al (2008) have described the presence of winging, central and lateral shoveled incisors, high frequency Carabelli's cusp sulcus and fossae, Y6 or Y7 cusp pattern, deflecting wrinkle, protostylid, and cuspid 6. All of these morphological features are part of a Mongoloid dental complex, specifically of the sinodonts, which agrees with the theory of the Mongoloid origin of South American indigenous populations.37 The influence of muscle forces and external stimuli in shaping facial biotype as well as genetic and environmental factors expressing external features of each individual's phenotype must be considered.38 In the Amazonian population, this is expressed in a greater bizygomatic width which makes the face look wider and shorter (euriprosope). By comparing these characteristics with the population of Santiago de Cali, which presents different micro-evolutionary processes and population dynamics, facial biotype changes and therefore the face turns out to be long and narrow (leptoprosope). Finally, the African descend population has intermediate values between the tall thin faces of the mestizo population of Santiago de Cali and the short wide faces of the Amazonian indigenous. This model contextualizes facial biotype by considering the individual itself instead of comparisons and foreign standardized averages. It also allows the practitioner to produce individualized diagnosis in sub-specializations such as maxillofacial surgery, facial aesthetics, and orthodontics. Finally, it should be noted that considering these models through statistical tools does not replace the methodological and theoretical effort required to determine facial biotype; these tools help to formally identify hypothesized constructs or theories from clinical practice.
CONCLUSIONS
Among the ten variables studied, the model showed that the latent variable that best correlates with fa- cial biotype is masticatory force (0.82), followed by the relationship with dental arches (0.73).
It is necessary to consider ancestry and to evaluate masticatory force, facial index, and the transverse dimensions of dental arches in order to accurately determine each patient's facial biotype.
Determining our patients' facial biotype is essential for establishing diagnosis and suggesting a treat- ment plan. Interest conflict: the authors declare having no conflict of interest in the present study.
REFERENCES
1. Broadbent B. The face of the normal child. Angle Orthod 1937; 7: 183-208. [ Links ]
2. Brodie AG. On the growth pattern of the human head. From the third month to the eighth year of life. Am J Anat 1941; 68(2): 209-262. [ Links ]
3. Björk A. The face in profile. An anthropological X-ray investigation on Swedish children and conscripts. Sven Tandlak Tidskr 1947; 40(suppl 5B): 58. [ Links ]
4. Ricketts RM. Cephalometric synthesis: an exercise in stating objectives and planning treatment with tracings of the head roentgenogram. Am J Orthod 1960; 46(9): 647- 673. [ Links ]
5. Downs W. Analysis of the dentofacial profile. Angle Orthod 1956; 26: 191-212. [ Links ]
6. Chang JY, McNamara Jr. JA, Herberger TA. A longitudinal study of skeletal side effects induced by rapid maxillary expansion. Am J Orthod Dentofacial Orthop 1997; 112(3): 330-337. [ Links ]
7. Martin R, Saller K. Lehrbuch der Anthropologie in Systematischer Darstellung. 3.a ed. Stuttgart: Verlag GF, ed.; 1957. [ Links ]
8. Lu X, Chen H, Jain A. multimodal facial gender and ethnicity identification. En: Zhang D, Jain A, eds. Advances in biometrics: Heidelberg: Springer; 2005. p. 554-561. [ Links ]
9. Lee JJ, Ramirez SG, Will MJ. Gender and racial variations in cephalometric analysis. Arch Otolaryngol Head Neck Surg 1997;117(4): 326-329. [ Links ]
10. Ramanathan N, Chellappa R, Biswas S. Computational methods for modeling facial aging: a survey. J Vis Langua Comput 2009; 20(3): 131-144. [ Links ]
11. Kiliaridis S, Engström C, Thilander B. The relationship between masticatory function and craniofacial morphology. Eur J Orthod 1985; 1985; 7(4): 273-283. [ Links ]
12. Ingervall B, Thilander B. Relation between facial morphology and activity of the masticatory muscles. J Oral Rehabil 1974; 1(2) :131-147. [ Links ]
13. Shinogaya T, Bakke M, Thomsen CE, Vilmann A, Sodeyama A, Matsumoto M. Effects of ethnicity, gender and age on clenching force and load distribution. Clin Oral Investig 2001; 5(1): 63-68. [ Links ]
14. Sondang P, Kumagai H, Tanaka E, Ozaki H, Nikawa H, Tanne K et al. Correlation between maximum bite force and craniofacial morphology of young adults in Indonesia. J Oral Rehabil 2003; 30(11): 1109-1117. [ Links ]
15. Nakatsuka M, Iwai Y, Jue SS, Oh SH, Guo L, Tominaga Y et al. A morphological study on the classification of maxillary dental arches. Okajimas Folia Anat Jpn 2004; 81(1): 5-13. [ Links ]
16. Forster CM, Sunga E, Chung CH. Relationship between dental arch width and vertical facial morphology in untreated adults. Eur J Orthod 2008; 30(3): 288-294. [ Links ]
17. Padilla M, Tello L, Moreno F, Osorio J, Bedoya A. Analysis of dental arch dimensions in three colombian ethnic groups. Int J Morphol 2013; 31(1): 100-106. [ Links ]
18. Bedoya A, Osorio J, Tamayo J. Biotipo morfológico facial en tres grupos étnicos colombianos: una nueva clasificación por medio del índice facial. Int J Morphol 2012; 30(2): 677-682. [ Links ]
19. Heise D. Causal Analysis. New York: Wiley Interscience; 1975. [ Links ]
20. Varga S, Spalj S, Lapter Varga M, Anic Milosevic S, Mestrovic S, Slaj M. Maximum voluntary molar bite force in subjects with normal occlusion. Eur J Orthod 2011; 33(4): 427-433. [ Links ]
21. R Development Core Team. R. A language and environment for statistical computing Austria: R Foundation for Statistical Computing; 2010. [ Links ]
22. Hair J, Anderson Jr R, Tathman R, Black W. Análisis multivariante. Madrid: Prentice Hall; 1999. [ Links ]
23. Rosseel Y. lavaan: an R package for structural equation modeling. Belgium: Ghent University; 2011. [ Links ]
24. Bagozzi R, Yi Y. Specification, evaluation, and interpretation of structural equation models. J Acad Market Sci 2012; 40(1): 8-34. [ Links ]
25. Kreiborg S, Jensen BL, Møller E, Björk A. Craniofacial growth in a case of congenital muscular dystrophy: a roentgencephalometric and electromyographic investigation. Am J Orthod Dentofacial Ortop 1978; 74(2): 207-215. [ Links ]
26. Ingervall B, Bitsanis E. A pilot study of the effect of masticatory muscle training on facial growth in long-face children. Eur J Orthod 1987; 9(1): 15-23. [ Links ]
27. Weijs WA, Hillen B. Relationships between masticatory muscle cross-section and skull shape. J Dent Res 1984; 63(9): 1154-1157. [ Links ]
28. Gionhaku N, Lowe AA. Relationship between jaw muscle volume and craniofacial form. J Dent Res 1989; 68(5): 805-809. [ Links ]
29. Sassouni V. A classification of skeletal facial types. Am J Orthod 1969; 55(2): 109-123. [ Links ]
30. Ringqvist M. Isometric bite force and its relation to dimensions of the facial skeleton. Acta Odontol Scand 1973; 31(1): 35-42. [ Links ]
31. Throckmorton GS, Finn RA, Bell WH. Biomechanics of differences in lower facial height. Am J Orthod Dentofacial Orthop 1980; 77(4) :410-420. [ Links ]
32. Proffit WR, Fields HW. Occlusal forces in normal and long-face children. J Dent Res 1983; 62(5): 571-574. [ Links ]
33. Bedoya A, Revelo G, Betancurt J, Tamayo M, Ramirez G. Association between maximum bite force and craniofacial morphology in an Amazonian population with normal dental occlusion. Orthod Sci Pract 2013; 6(22): 158-163. [ Links ]
34. Kiliaridis S. Masticatory muscle influence on craniofacial growth. Acta Odont Scand 1995; 53(3): 196-202. [ Links ]
35. Corruccini RS, Henderson AM, Kaul SS. Bite-force variation related to occlusal variation in rural and urban Punjabis (North India). Arch Oral Biol 1985; 30(1): 65-69. [ Links ]
36. Kamegay T, Tatsuki T, Nagano H, Mitsuhashi H, Kumeta J, Tatsuki Y et al. A determination of bite force in northern Japanese children. Eur J Orthod 2005; 27: 53-57. [ Links ]
37. Aragón N, Bastidas C, Bedón L, Duque P, Sánchez M, Rivera S et al. Rasgos morfológicos dentales coronales en dentición temporal y permanente: distancia biológica entre tres grupos indígenas del Amazonas colombiano. Rev Odont Mex 2008; 121: 13-28. [ Links ]
38. Mao J, Nah H.Growth and development: Hereditary and mechanical modulations. Am J Orthod Dentofacial Orthop 2004;125: 676-689. [ Links ]
