


Services on Demand
Journal
Article
 text in
  Spanish (pdf)
 Article in xml format
 Article references
 Send this article by e-mail
Indicators
-
 Cited by SciELO
 -
 Access statistics
Related links
-
 Cited by Google
 -
 Similars in
SciELO
Similars in
SciELO -
 Similars in Google
Share

 Permalink
Revista Facultad de Odontología Universidad de Antioquia
Print version ISSN 0121-246X
Rev Fac Odontol Univ Antioq vol.25 no.2 Medellín Jan./June 2014
ORIGINAL ARTICLES DERIVED FROM RESEARCH
ASSESSMENT OF MOYERS AND TANAKA-JOHNSTON MIXED DENTITION ANALYSES FOR THE PREDICTION OF MESIODISTAL DIAMETERS OF UNERUPTED CANINES AND PREMOLARS1
Paola María Botero1; Diana P. Cuesta2; Sandra Agudelo3; Catalina Hincapie3; Carolina Ramírez3
1 Research project funded by Comité para el Desarrollo de la Investigación (CONADI), of Universidad Cooperativa de Colombia 2 Orthodontist, Universidad CES, Assistant Professor, Universidad Cooperativa de Colombia and Universidad CES, Medellín, Colombia. Email: pboterom@gmail.com
3 MD., MSc in Epidemiology, Ph(c) Epidemiology, Universidad de Antioquia. Professor, researcher, School of Medicine, Universidad Pontificia Bolivariana, Medellín, Colombia
4 Orthodontists, Universidad Cooperativa de Colombia. Medellín, Colombia. Research project to earn the title of Specialist
SUBMITTED: JANUARY 22/2011-APPROVED: OCTOBER 22/2013
Botero PM, Cuesta DP, Agudelo S, Hincapié C, Ramírez C. Assessment of Moyers and Tanaka-Johnston mixed dentition analyses for the prediction of mesiodistal diameters of unerupted canines and premolars. Rev Fac Odontol Univ Antioq 2014; 25 (2):.
ABSTRACT
INTRODUCTION: the objective of this study was to determine whether the methods of Moyers (M) percentile (p) 75, p85, p95 and Tanaka-Johnston (TJ), used in the prediction of the mesiodistal diameter of unerupted canines and premolars, either overestimate or underestimate their respective succedaneous diameter. METHODS: diagnostic technology assessment in 56 plaster models of schoolchildren from Medellin, with class I skeletal and permanent erupted incisors, canines, and bicuspids, with follow-ups from 6 to 12 years of age. The teeth mesiodistal diameter was measured by the predictive methods of Tanaka-Johnston and Moyers p75, p85, p95. The predicted and actual values were evaluated by means of related Student's t test and Wilcoxon test. These methods' reproducibility was calculated by intraclass correlation coefficient (ICC) (95% CI), and their level was calculated using Bland-Altman 95% limits. RESULTS: : in the upper arch, significant actual value differences were observed with the T-J and Mp95 measurements. In the lower arch, the values of all the methods were different to the actual value (p > 0.05), except Mp75. Reproducibility was higher in the upper arch with T-J, followed by Mp85; in the lower arch, Mp75 was the method with the best reproducibility, followed by Mp85. In the upper arch, T-J overestimates the actual measurement by 0,333 mm in average (95% CI 2,100;1,434), and in the lower arch Mp75 overestimates by 2,14 (95% CI-2,020;1,592). CONCLUSSION: the best predictive method for the upper arch is Tanaka-Johnston, and for the lower arch, Moyers at the 75th percentile; although both methods overestimate the actual value, they show adequate reproducibility.
Key words: prediction; reproducibility, unerupted tooth.
INTRODUCTION
Dental crowding is one of the most frequent problems in the general population. It is described as the discrepancy between tooth size and arch perimeter.1 This discrepancy is characterized by a lack of coincidence in the anatomical interproximal contact points of erupted teeth, by teeth being unable to erupt, or by doing so in an ectopic manner.1
Adequate diagnosis of dentoalveolar discrepancy and early treatment are pivotal in preventing occlusal alterations that complicate future treatments in permanent dentition. Besides clinical analysis, patients with mixed dentition require model analysis as part of the necessary data to establish a diagnosis. The method of mixed dentition analysis predicts the mesiodistal size of permanent canines and premolars and is a diagnostic tool that allows to quantify crowding and to predict dentoalveolar discrepancy by identifying the available and necessary space for teeth not yet erupted.2
There are several prediction methods based on models, x-rays, and a combination of both. Radiographic methods based on lateral periapical and 45° cephalic x-rays are the most accurate3-5 but they require more time and special equipment and are therefore less practical.6, 7 On the contrary, non-radiographic methods are based on correlations and linear regression equations with prediction tables.8, 9 The accuracy of these methods has been questioned when applied to racial or ethnic groups other than the population in which they originated.2, 3, 10, 11
Moyers analysis,10 a non-radiographic method, uses mesiodistal diameter of four permanent lower incisors, measured in plaster models, and a prediction table for non-erupted canines and premolars, with percentiles ranging from 50 to 95 for American children. Percentile 75 is recommended when applying the analysis in different populations, while percentiles 85 and 95 may overestimate the actual value, since they have more accurate ranges.11, 12 On the other hand, the Tanaka-Johnston analysis7 uses the same reference from the four permanent incisors but establishes a constant and a formula based on a predictive model of an equation to be applied on each arch.
Recognizing the estimation error of each method, as well as biological and environmental factors associated with the impact of the various socio-cultural customs, inevitably decreases the theoretical accuracy of Moyers and Tanaka-Johnston prediction methods in Colombian populations.13-15 Several authors have conducted studies to compare prediction methods and actual results in different populations, in order to determine if the methods really work and which the most accurate is.8, 16-22 Some of these studies have shown, for example, that the Tanaka-Johnston method underestimates actual tooth size, while the Moyers method can be effectively used in different percentiles for both sexes, with a certain degree of overestimation.
Several studies have shown coefficients of correlation differences among diverse ethnic groups,10, 22 with results ranging from –0.01 to 3 mm.16, 17, 19, 23, 24 Clinically, overestimation in each arch may generate serial extractions in patients with skeletal class I, adequate profile and moderate crowding (4 to 7 mm).17, 22 Finally, the combination of both methods has been proven to be more accurate.5, 13, 18
The objective of this study is to determine whether the methods of Tanaka-Johnston and Moyers, applying the 75, 85 and 95 percentiles to predict the mesiodistal diameter of unerupted canines and premolars, either overestimate or underestimate the diameter of their respective succedaneous.
METHODS
This was a diagnostic technology assessment on 139 schoolchildren from Medellin, presenting skeletal class I, with permanent incisors and erupted canines and bicuspids. The students were monitored since they were 6 until the age of 12 years by another study conducted at Universidad de Antioquia, for which a signed informed consent was obtained from each participant.21 The patients' models were made annually (by a single operator, with a standardized technique, using an irreversible hydrocolloid and plaster stone type III, according to the manufacturer's instructions). Patients participated in promotion, prevention, and restorative procedures to help them remain healthy, and were not subjected to orthodontic treatment during the time of the study.21
A convenience sample of 56 kids (112 pairs of models, 2 pairs per patient) was chosen from the group of 139 schoolchildren, as they met the following inclusion criteria: good plaster model conditions, absence of air bubbles or broken teeth, the first model, obtained from each patient at initial, mixed, or intertransitional dentition stages, should have at least two central and one lower lateral incisor fully erupted, and for the second model the patient should be in the early permanent dentition stage, with canines and bicuspids fully erupted in one of the two sides of each arch (upper and lower).
Models were used to measure the mesiodistal diameter of the following teeth: upper canine, first upper premolar, second upper premolar, lower central incisor, lower lateral incisor, lower canine, first lower premolar, and second lower premolar, at the point of maximum mesiodistal diameter, using a digital electron microscope with an accuracy of 0.001 mm (Leitz, Germany) at Universidad EAFIT metrology laboratory (Medellín, Colombia), according to the international system of units (SI). Three replicates per measurement were performed in order to provide validity to the study, and the average of the three measures was used. The measurements were performed by a single standardized skilled operator. Only the teeth on the right side of each arch were measured and their values were duplicated for both sides, since previous studies have shown that there are no significant statistical differences in terms of size of the right and left sides in the same patient.20, 25
Prediction of canines and bicuspids was performed by means of the analyses of Tanaka-Johnston and Moyers, with 75, 85, 95 percentile, based on the measurements obtained from the first model of each patient, carefully following the steps suggested by the creators of each method.7, 9
Statistical analysis
Univariate analysis was conducted in order to describe the measures of frequency of predicted and actual values and their variation after applying the methods of Moyers (75, 85 and 95 percentiles) and Tanaka-Johnston.
The Kolmogorov-Smirnov test with Lilliefors' correction was used to evaluate the normal distribution of continuous variables. A bivariate analysis was performed to compare predicted and actual values with each method, using the related Student's t test or Wilcoxon test, according to the distribution of the variable.
Intraclass correlation coefficient (ICC) and its confidence interval of 95% were calculated in order to assess reproducibility, and Lin's coefficient (concordance) was also calculated between each of the predictive methods (Tanaka-Johnston and Moyers) and the actual value in permanent dentition. The limit of agreement between the methods was calculated with Bland-Altman 95% limits.26 To interpret reproducibility, Altman's criterion was used as follows: poor (≤ 0.20), acceptable (0.21-0.40), moderate (0.41 and 0.60), good (between 0.61 and 0.80), and excellent values were those higher than 0.80 up to 1.00.27 Negative values were those equal to 0.0. The STATA v.9.0 software was used for statistical analysis.
RESULTS
Of the 56 chosen models, 39 were of female patients (68%) and 17 of male patients (32%). In comparing prediction values and actual values of permanent teeth in the upper arch, statistically significant differences were found in Moyers p95 prediction (p = 0.004, magnitude of difference: 22.10-23.10) and Tanaka-Johnston prediction (p = 0.008, magnitude of difference: 21.99-22.97). In terms of the lower arch, no method showed statistically significant differences, with the exception of Moyers p75 (p = 0.090, magnitude of difference: 21.00-22.30) (table 1).
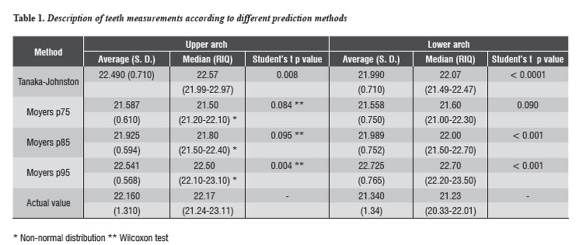
The Tanaka-Johnston method showed greater reproducibility in the maxillary, with an ICC of 0,611 (95% CI 0,402; 0,758), followed by Moyers p85, with an ICC of 0,543 (95% CI 0,330; 0,705) (table 2). The percentage of concordance was calculated using Lin's coefficient, with higher values for Tanaka-Johnston (60.7%) and Moyers p85 (53.9%). The highest reproducibility between the actual value and the predicted value occurred in the lower arch using Moyers p75 (ICC = 0,634; 95% CI 0,447-0,768, Lin's percentage = 63) and Moyers p85 (ICC = 0,558; 95% CI 0,185-0,760, Lin's percentage = 55,4) tabla 2.

Moyers method underestimates the actual value, with a difference of 0,576 mm and 0,238 mm for p85 in the upper arch. On the contrary, Tanaka-Johnston and Moyers p95 overestimate the actual value, with differences of –0,333 mm and –0,379 mm respectively (table 2). Intraclass correlation coefficients and 95% limits of agreement of the difference between the actual erupted size and the predicted value of the size of non-erupted canines and premolars.
In the lower arch, both methods overestimated the actual value of permanent teeth, and Tanaka-Johnston showed the greatest amount of overestimation, with a difference in tooth size of –0,652 mm, followed by Moyers p85, with an average difference of –0,645 mm (tabla 2).
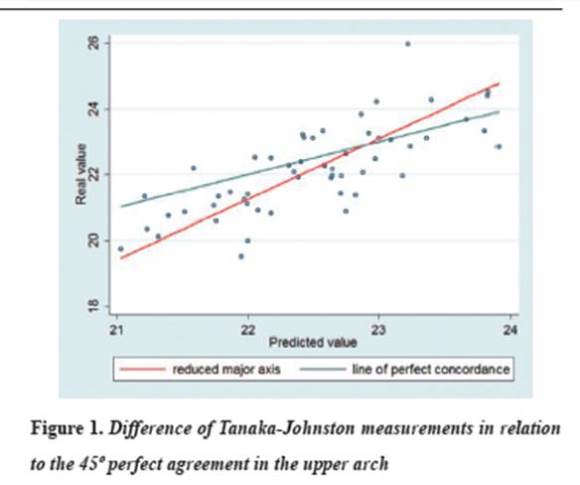
When the predicted value obtained in the maxilla using the Tanaka-Johnston method is close to 23 mm, there is perfect concordance with the actual value. If the predicted value is above 23 mm, the method is considered to overestimate the actual value; by contrast, if the value is lower, underestimation is considered (figure 1). Moyers p75 shows a similar tendency when the predicted value is 22 mm in the mandible (figure 2).

DISCUSSION
The results of this study show that Moyers and Tanaka-Johnston mixed dentition analyses overestimate the actual value of permanent teeth. The best tooth size prediction method for the upper arch is Tanaka-Johnston, while Moyers p75 is the best for the lower arch; even though they overestimate actual values, they show high reproducibility (table 2).
Results of the original Tanaka-Johnston study show that lower central incisors have a correlation of r2 = 0,625 for upper canines and premolars, and r2 = 0,648 for lower canines and premolars. These results agree with those of Ballard and Willye (r2 = 0,64).
Linear correlation coefficients, used to compare predictions and actual values, only estimate the associations between them but do not evaluate reproducibility. In this study, correlations of r2 = 0,603 and r2 = 0,468 were obtained with the Tanaka-Johnston method in the upper and lower arch, respectively. This correlation is lower than that of the original study.7
The degree of underestimation and overestimation reported in the literature may be statistically significant but clinically irrelevant. However, a difference of 2 mm can be clinically significant in cases in which the decision for a serial extraction in patients with moderate crowding extraction must be taken.17, 28 29 In the present study, the most reproducible method for the upper arch showed an overestimation of 2,10 mm and an underestimation of 1,43 mm on the right side. In the lower arch, the method with the highest reproducibility showed 2,02 mm overestimation and 1,59 mm underestimation on each side.
Previous studies applying the methods of Moyers and Tanaka-Johnston in different populations have compared their results by using Pearson's coefficient of linear correlation6, 16, 20, 29-31 and their results have determined the degree of association between two quantitative variables without defining dependence between them. This method is not suitable to determine reproducibility or the correlation among measures22 like the ones taken in the present study.
There are differences among the tooth size measurement instruments within the models used in the reported studies, making it difficult to compare them. In his original project, Moyers used an optical microscope (Optocom).10 Tanaka-Johnston used a Vernier scale with 0,05 mm precision.7 Bishara used a double bar compass22 and Ingervall a slide gauge;23 other researchers used digital calipers with varying precision ranging from 0,01, 0,02 to 0,03 mm.17, 25, 31, 32 In the present study, we used a digital microscope with 0,001 mm precision in order to avoid model wear during the repeated measurements and to obtain better accuracy. Differences among the instruments can produce variations when comparing the different studies, and therefore variability in the results.
When different methods are used in most studies, a variety of results are obtained. Underestimation of teeth actual size occurred when applying the Moyers p75 method,7, 10, 20 but overestimation23 and underestimation2 were found using the Tanaka-Johnston method.
Dental morphology and teeth size are genetically determined;14, 15, 23, 29 therefore, it is necessary to establish application and reproducibility of mixed dentition analyses in different populations.3, 6, 17, 20 In the study by Pardo et al, they found out that applying foreign analyses in Colombian population increases error analysis from 13 to 42%.31 Racial characteristics create heterogeneity among individuals and can influence tooth size.14, 17, 20, 33-35 Variations occur when applying mixed dentition analyses in populations with different ethnic backgrounds.15, 33, 36 However, it should be noted that this study's sample was selected for convenience, which limits the comparison with other studies. Therefore, the results among this group of schoolchildren show over- and underestimations that may generate tooth size prediction errors and discrepancies with the existing space.
CONCLUSIONS
It can be concluded that using a single method during clinical practice may induce large variations in tooth size prediction; it is therefore recommended to combine Moyers and Tanaka-Johnston methods in the studied population in order to obtain better reproducibility, taking into account that both methods overestimate actual values. Tanaka-Johnston is suggested for the upper arch and Moyers p75 for the lower arch.
CONFLICTS OF INTEREST
The authors declare that the manuscript is original, has not been previously published and is not under evaluation in any other journal. The study was funded by Comité para el Desarrollo de la Investigación (CONADI), of Universidad Cooperativa de Colombia, and met all the requirements for such funding.
ACKNOWLEDGMENTST
We thank Dr. Libbe Mariaca and collaborators, who conducted the study at Universidad de Antioquia and whose sample was used in the present study.
REFERENCES
1. Van der Linden FP. Theoretical and practical aspects of crowding in the human dentition. J Am Dent Assoc 1974; 89(1): 139-153. [ Links ]
2. Nourallah AW, Gesch D, Khordaji MN, Splieth C. New regression equations for predicting the size of unerupted canines and premolars in a contemporary population. Angle Orthod 2002; 72(3): 216-221. [ Links ]
3. De Paula S, Almeida MA, Lee PC. Prediction of mesiodistal diameter of unerupted lower canines and premolars using 45 degrees cephalometric radiography. Am J Orthod Dentofacial Orthop 1995; 107 (3): 309-314. [ Links ]
4. Fisk RO, Markin S. Limitations of the mixed dentition analysis. Ont Dent 1979; 56(6): 16-20. [ Links ]
5. Hixon HE, Oldfather RE. Estimation of the sizes of unerupted cuspid and bicuspid teeth. Angle Orthod 1958; 28(4): 236-240. [ Links ]
6. Diagne F, Diop-Ba K, Ngom PI, Mbow K. Mixed dentition analysis in a Senegalese population: elaboration of prediction tables. Am J Orthod Dentofacial Orthop 2003; 124(2): 178-183. [ Links ]
7. Tanaka MM, Johnston LE. The prediction of the size of unerupted canines and premolars in a contemporary orthodontic population. J Am Dent Assoc 1974; 88(4): 798-801. [ Links ]
8. Bernabé E, Flores-Mir C. Are the lower incisors the best predictors for the unerupted canine and premolars sums? an analysis of a Peruvian sample. Angle Orthod 2005; 75(2): 202-207. [ Links ]
9. Moyers RE. Handbook of orthodontics. 4.a ed. Londres: Year Book Medical Pub; 1988. [ Links ]
10. Moyers RE, van der Linden FP, Riolo M, McNammara J. Standards of human occlusal development. Craneofacial Growth series. Ann Arbor: University of Michigan; 1976. [ Links ]
11. Nance HN. The limitations of orthodontic treatment; diagnosis and treatment in the permanent dentition. Am J Orthod 1947; 33(5): 253-301. [ Links ]
12. Schirmer UR, Wiltshire WA. Orthodontic probability tables for black patients of African descent: mixed dentition analysis. Am J Orthod Dentofacial Orthop 1997; 112(5): 545-551. [ Links ]
13. Sayin MO, Turkkahraman H. Factors contributing to mandibular anterior crowding in the early mixed dentition. Angle Orthod 2004; 74(6): 754-758. [ Links ]
14. Abu Alhaija ES, Qudeimat MA. Mixed dentition space analysis in a Jordanian population: comparison of two methods. Int J Paediatr Dent 2006; 16 (2): 104-110. [ Links ]
15. Altherr ER, Koroluk LD, Phillips C. Influence of sex and ethnic tooth-size differences on mixed-dentition space analysis. Am J Orthod Dentofacial Orthop 2007; 132 (3): 332-339. [ Links ]
16. Endo T, Abe R, Kuroki H, Oka K, Shimooka S. Tooth size discrepancies among different malocclusions in a Japanese orthodontic population. Angle Orthod 2008; 78(6): 994-999. [ Links ]
17. Jaroontham J, Godfrey K. Mixed dentition space analysis in a Thai population. Eur J Orthod 2000; 22(2): 127-134. [ Links ]
18. Kaplan RG, Smith CC, Kanarek PH. An analysis of three mixed dentition analyses. J Dent Res 1977; 56(11): 1337-1343. [ Links ]
19. Legovic M, Novosel A, Legovic A. Regression equations for determining mesiodistal crown diameters of canines and premolars. Angle Orthod 2003; 73(3): 314-318. [ Links ]
20. Melgaco CA, Araujo MT, Ruellas AC. Applicability of three tooth size prediction methods for white Brazilians. Angle Orthod 2006; 76(4): 644-649. [ Links ]
21. Mariaca L, Téllez Y, Mejía J, Giraldo G. Cambios dimensionales de los arcos dentales en niños de 3 a 12 años de edad de la ciudad de Medellín (Estudio Longitudinal). Rev Fac Odontol Univ Antioq 1997; 8(2): 4-12. [ Links ]
22. Bishara SE, Fernandez Garcia A, Jakobsen JR, Fahl JA. Mesiodistal crown dimensions in Mexico and the United States. Angle Orthod 1986; 56(4): 315-323. [ Links ]
23. Ingervall B, Lennartsson B. Prediction of breath of permanent canines and premolars in the mixed dentition. Angle Orthod 1978; 48(1): 62-69. [ Links ]
24. Paredes V, Gandia JL, Cibrian R. A new, accurate and fast digital method to predict unerupted tooth size. Angle Orthod 2006; 76(1): 14-19. [ Links ]
25. Cattaneo C, Butti AC, Bernini S, Biagi R, Salvato A. Comparative evaluation of the group of teeth with the best prediction value in the mixed dentition analysis. Eur J Paediatr Dent 2010; 11(1): 23-26. [ Links ]
26. Bland JM, Altman DG. Statistical methods for assessing agreement between two methods of clinical measurement. Lancet 1986; 1(8476): 307-310. [ Links ]
27. Altman DG. Practical statistics for medical research. London: Chapman and Hall; 1991. [ Links ]
28. Al- Khadra BH. Prediction of the size of unerupted canines and premolars in a Saudi Arab population. Am J Orthod Dentofacial Orthop 1993; 104(4): 369-372. [ Links ]
29. Yuen KK, Tang EL, So LL. Mixed dentition analysis for Hong Kong Chinese. Angle Orthod 1998; 68(1): 21-28. [ Links ]
30. Boboc A, Dibbets J. Prediciton of the mesiodistal width of unerupted permanent canines and premolars: a statistical approach. Am J Orthod Dentofacial Orthop 2010; 137(4): 503-507. [ Links ]
31. Pardo A, Parra M, Yezioro S. Aplicación de cinco análisis de dentición mixta en una muestra de niños Colombianos. Presentado en el 1er Encuentro Latino Americano de Investigación en Ortodoncia SCO; 1998; Bogotá, Colombia. [ Links ]
32. Legovic M, Novosel A, Skrinjaric T, Legovic A, Mady B, Ivancic N. A comparison of methods for predicting the size of unerupted permanent canines and premolars. Eur J Orthod 2006; 28(5): 485-490. [ Links ]
33. Buwembo W, Lubuga S. Moyers method of mixed dentition analysis: a meta-analysis. Afri Health Sci 2004; 4(1): 63-66. [ Links ]
34. Martinelli FL, Lima EM, Rocha R, Araujo MST. Prediction of lower permanent canine and premolars width by correlation methods. Angle Orthod 2005; 75(3): 236-240. [ Links ]
34. Philip NI, Prabhakar M, Arora D, Chopra S. Applicability of the Moyers mixed dentition probability tables and new prediction aids for a contemporary population in India. Am J Orthod Dentofacial Orthop 2010; 138(3): 339-345. [ Links ]
35. Jaiswal AK, Paudel KR, Shrestha SL, Jaiswal S. Prediciton of space available for unerupted permanent canine and premolars in a Nepalese population. J Orthod 2009; 36(4): 253-259. [ Links ]
