


Serviços Personalizados
Journal
Artigo
 texto em
  Espanhol (pdf)
 Artigo em XML
 Referências do artigo
 Enviar este artigo por email
Indicadores
-
 Citado por SciELO
 -
 Acessos
Links relacionados
-
 Citado por Google
 -
 Similares em
SciELO
Similares em
SciELO -
 Similares em Google
Compartilhar

 Permalink
Revista Facultad de Odontología Universidad de Antioquia
versão impressa ISSN 0121-246X
Rev Fac Odontol Univ Antioq vol.26 no.1 Medellín jul./dez. 2014
ORIGINAL ARTICLES DERIVED FROM RESEARCH
HEAD CIRCUMFERENCE GROWTH CURVES IN CHILDREN 0 TO 3 YEARS OF AGE. A NEW APPROACH1
Laila Yaned González Bejarano2; Fabio Hernán Tejedor3; Luis Alberto López Pérez4; Clementina Infante Contreras5
1 Thesis of Master's Degree in Dentistry, par tial requirement for the Master`s Degree in Dentistry. Research project funded by the Research and Outreach Center, School of Dentistry, Universidad Nacional de Colombia. Emails: lygonzalezb@unal.edu.co, lygonzalez29@ gmail.com
2 Candidate to MSc. in Dentistry, School of Dentistry, Universidad Nacional de Colombia. DMD, Specialist in Pediatric Stomatology. Part time Assis- tant Professor, School of Dentistry, Universidad Nacional de Colombia
3 Candidate to MSc. in Statistics, School of Sciences, Universidad Nacional de Colombia
4 Ph.D in Statistics. Full time Professor, School of Sciences, Universidad Nacional de Colombia
5 DMD, Specialist in Or thodontics, Specialist in Statistics. Full time Professor, School of Dentistry, Universidad Nacional de Colombia
SUBMITTED: AUGUST 13/2013-ACCEPTED: MARCH 18/2014
González LY, Tejedor FH, López LA, Infante C. Head circumference growth curves in children 0 to 3 years of age. A new approach. Rev Fac Odontol Univ Antioq 2014; 26 (1): 13-32.
ABSTRACT
INTRODUCTION: head circumference is an indicator of health and global cranial growth in early childhood, so it must be monitored. Usually,
the WHO reference patterns use the Box Cox Power exponential model and the LMS method to model the behavior of head circumference growth. These
methods are limited because they compare each individual against the median of a population, which prevents characterizing individual growth, while
mixed-effect longitudinal models allow assessing individual growth patterns and controlling variability among subjects. The objective of this study was
to use mixed-effect longitudinal models to characterize growth patterns based on head circumference in children 0 to 3 years of age.
METHODS: being
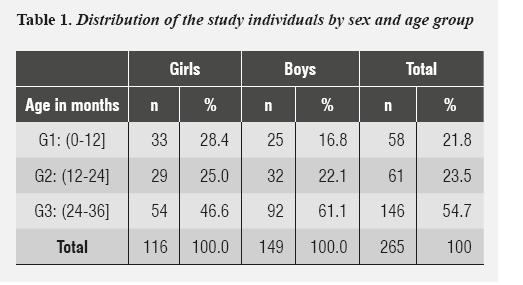
a prospective longitudinal study, the criteria for children eligibility considered inclusion and exclusion factors (WHO); 265 Colombian children (116
girls, 149 boys) living in Bogotá were distributed in 3 groups: G1: (0-12], G2: (12-24], G3: (24-36] months. They were measured every 3 months for 1
year. Two examiners were trained and continuously standardized, and they were monitored on adherence to data quality and data collection procedures.
Random and systematic errors were calculated. Growth curves were constructed using mixed longitudinal models. The model was estimated through
the method of estimation of restricted maximum likelihood (REML), free R statistical software, version 2.15. To adjust the models, we used the lme4
package.
RESULTS: 6 models were adjusted, with maximum gradient of growth from 0 to 12 months. The model showed a growth pattern by age group
and sex, in groups G1 and G2, confidence bands allowed identifying atypical data, better adjustment, and distribution of residuals, contrary to the
behavior in group G3, which showed more atypical data outside the bands.
CONCLUSIONS: : this methodology allowed understanding the behavior of
head circumference by age group and sex, and analyzing data with unbalanced structures. .
Key words: anthropometry, growth curves, craniofacial, growth and development, standards of reference, childhood, longitudinal studies, regression models, mixed longitudinal models.
INTRODUCTION
Head circumference is the best predictor of childhood neurodevelopment and provides a dynamic view of the global growth of the brain and internal structures,1, 2 so it must be monitored in the early prenatal and postnatal stage. During the fetal period, some changes occur in terms of growth speed and craniofacial dimensions and shape;3-5 these last changes are attributed to the pressure exerted by the growing brain on the shape of the cranial vault, with little influence on the shape of the cranial base, as shown by some geometric morphometric studies.6, 7 At birth, the sutures between bones are separated by the fontanelles.8-10 Cephalometric studies on children aged 0-3 years show a greater growth pattern in the anterior cranial base than in the posterior one,10 as well as greater cranial vault growth in width and depth, with greater differences in girls than in boys. 11-15 Regarding the behavior of the head circumference growth, there is more progress during the first year, with an increase of up to 7 cm during the first six months and a total growth of 12 cm up to month12, 15, 16 attributed to early brain development,15-18 so that by age 5 its growth is virtually completed—a 92% growth has been reported—.11, 12 In terms of sexual dimorphism, studies on kids between 1 and 5 years of age show greater head circumference measurements in boys than in girls,11, 12 with a difference of 5 to 10 mm approximately. There is not an absolute definition of head circumference normality as to properly assess size or growth; it is necessary to compare the means of each patient's head circumference with the means of a population reference, taking into account age and sex.15, 18, 19-22
Head size has been associated with genetic and environmental factors, as well as with anatomical factors related to the thickness, size and shape of the structures that comprise it.23-28 Although head circumference is correlated with neural development, it is necessary to consider the influence of prenatal factors such as fetal growth retardation, fetal and maternal malnutrition, multiple pregnancy, weight at birth, and gender. Since these factors have been found to be influential on craniofacial and overall growth (length/weight), a high association between fetal malnutrition and a decrease in craniofacial dimensions has been reported.24-25 Other factors directly associated with the nutritional status and conditions of an individual's health and well-being are educational level and eco-geographical, socio- demographic, and socio-economic conditions,27, 28 which may influence the dimensions of brachial and cephalic perimeter, as reported by a cross-sectional study in children under 6 years in Bogota.29 These findings suggest the importance of early pre- and postnatal craniofacial diagnosis. Growth studies use cross-sectional and longitudinal designs and anthropometric measurements of length, height, weight, and head circumference as health indicators for each age and gender, and are graphed using growth charts.30-34 The WHO's growth charts are constructed with the statistical model Box Cox Power Exponential and the LMS method, which summarizes the changing distribution of anthropometric measurements as a function of age by curves L, M and S, which represent asymmetry, median and variability respectively.33 Three reference standards have been used in Colombia: those of the National Center for Health Statistics (NCHS),21 the WHO's growth references,19, 20 and Colombian growth charts, which were prepared in 2011 by a group of researchers22 and are not available in a full version yet.
In order to evaluate the behavior of overall growth and head circumference in children, the correlation between cephalic perimeter and body size (weight, length/size) has been studied.17, 18, 28, 30 A low correlation has been found between body weight and head circumference (HC) and a higher correlation between head circumference and body length/size. Usually, the percentile is the same for the two measurements (head circumference and body length/size) and any negative or positive discrepancy corresponding to 2 standard deviations (2SD) must be taken into account because it may indicate the presence of craniosynostosis, microcephaly, or a syndrome.15-19 The term microcephaly is used when cephalic perimeter is below –2.5 (SD) and macrocephaly when it is +2.5 (SD) above the average of the reference population for a given age and gender.28, 29, 31 However, its usefulness is limited since the relationship between body length and head size may be normal and yet it might not mean proper head size. Traditionally, head circumference is shown in percentiles and standard deviations (SD) (Z score).20, 31, 32 Each Z score represents the difference between a child's head circumference and the median head circumference of a population (by age and sex) divided by the standard deviation of the reference population.3, 20, 31, 32 This Z score criterion allows sorting out children into a percentile-based classification, but it does not establish a growth model that can be used to make a prognosis, which impedes characterizing each child's growth pattern. But by using mixed longitudinal models, our proposal allows characterizing each child's growth curve on time, or a standard curve in certain age and sex group.
METHODS
Ethical considerations: this study was approved by the Ethics Committee of Universidad Nacional de Colombia School of Dentistry, according to meeting agreement minutes 05 of 05/03/2011. It followed regulations included in national and international standards (Declaration of Helsinki 1975, amended in Edinburgh in 2000, and Resolution 8430 of 1993 of the Ministry of Health of Colombia). The authors declare that they have no conflict of interest. The objective population were groups of children of both sexes, from 0 to 3 years, attending kinder gardens of Secretaría de Integración Social D. C. at the locality of Usaquén, the kinder garden of Universidad Nacional de Colombia, Unisalud EPS, and the HOMI Clínica del Bebé of Fundación Hospital de la Misericordia. As this was a prospective longitudinal study, the criteria of children eligibility considered inclusion and exclusion factors, thus fulfilling, on the one hand, the WHO recommendations to create a prescriptive sample to ensure adequate conditions of care, protection, health, and welfare, 19, 20, 31, 32 and on the other hand, that eco-geographically parents, grandparents, and children had been born in Colombia. Similarly, the children entered the study at different ages and were measured every three months for one year. Only those children whose parents signed informed consent were measured. Each participant was assigned a consecutive number in order to identify them and to protect their identity. The sample consisted of 265 children (116 females and 149 males) who were born in any Colombian population but were living Bogotá. They were sorted out in age groups like this: G1 (0- 12], G2 (12 to 24], G3 (24 to 36] months (table 1), based on the biological behavior of children growth and development during the first 3 years of life, as reported in the literature.10-15, 19, 20
Two examiners were trained and the instruments were calibrated in accordance with WHO's recommendations.19, 20, 31, 32
Method error: two examiners were trained on a data collection form and an instructions sheet. They were constantly standardized and monitored for adherence to the data quality and collection procedures.
Cephalic perimeter (occipital-frontal circumference) was measured in each child with a standard 12 mm wide tape, with increments of 1 mm. Method error was evaluated on 30 children randomly chosen, and two examiners made the measurements two times with 1-month interval; to calculate intra- and inter-examiner method error, an analysis of variance (ANOVA) test was conducted with two factors (time and observer), as well as the test of ratios of mean squares (F test) with a p-value < 0.05. Conclusions were drawn from this assessment. Growth curves were constructed by using mixed longitudinal models. The R statistical software was used to adjust models, which were obtained through estimation by restricted maximum likelihood (REML), by the lme4 program (Bates et al, 2011).35
Statistical analysis
The models proposed in this study follow the standards of mixed longitudinal models. 36, 37 These models include both fixed effects and random effects. They adapt well to common situations of longitudinal studies on craniofacial growth, when time intervals are not equal for all the individuals or when individuals begin measurements at different ages, producing data imbalance, as in this case. These models were introduced by Laird and Ware in 1982. 38
According to Singer et al,36 the model can be written as follows:
- yi=Xi β+Zi bi+ei (1,1)
Where yi and ei are respectively the vectors of responses and the errors of measurement for the i -th subject, Β and bi are respectively the vectors of fixed effects (population parameters) and random effects (individual parameters), and Xi and Zi are the design matrices associated with fixed effects and random effects.36
In model (1.1), (1.1) yi=(yi1, … …1yipi )t is a response vector associated to the ith sample unit and has a multivariate normal distribution (see Singer et al),36 with mean vector and covariance matrix respectively given by:
- E ( yi )=Xi β (1,2)
V (yi )=Vi= Zi GZi t + Ri (1,3)
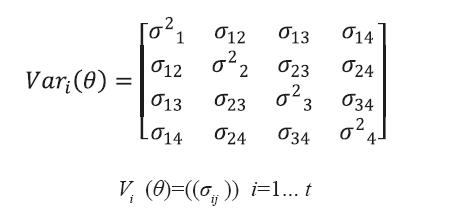
In this study we used an unstructured (NE) variance- covariance matrix, which has the following structure, in the case of individuals evaluated using the 4 different measurements.
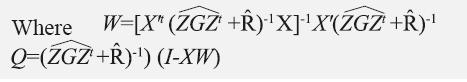
Estimation of the model's parameters was done by the method of restricted maximum likelihood (REML) and evaluation of the model was done by taking into account two estimators: BLUE (best linear unbiased estimator) and BLUP (best linear unbiased predictor).36, 37 Parameters Β and bi are obtained from these expressions:
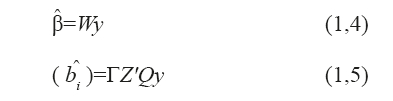
b^i is known as the best predictor P and contains the random components of model (1,1) (see López et al).39
Using (AIC) Akaike as a goodness of fit criterion.
RESULTS
There was not enough statistical evidence to suggest a significant difference in inter-examiner measurements—a finding that resulted from the ANOVA test and the p-value < 0.05—. The sample description showed that 97.7% of the children were born in Bogotá, and 80.2% of parents and 75.2% of grandparents were born in the Cundinamarca- Boyacá region.
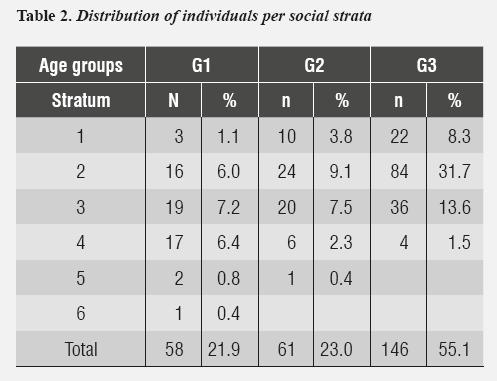
With regard to breastfeeding (a variable taken into account as an inclusion criterion to ensure a prescriptive sample), it happened to be an exclusive practice until month six in 98.2% of cases, and a prolonged practice until months 12 and 18 (38.8% and 33.3% respectively). In terms of socio-economic conditions, social strata E3 and E4 were predominant in G1 (7.2% and 6.4%, respectively). In groups G2 and G3, the predominant social strata were E2 (9.1%, 31.7%) and E3 (7.5%, 13.6%) respectively (table 2).
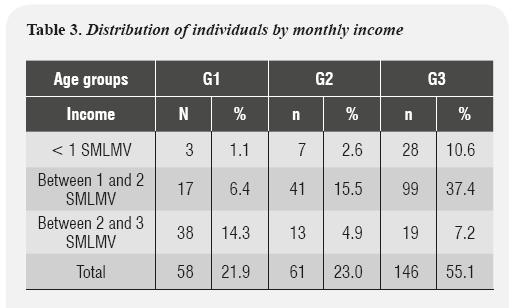
In relation to distribution by income, G1 showed a prevalence of 2 to 3 SMLMV (Legal Minimum Current Monthly Wage per its Spanish initials) (14.3%), while G2 and G3 showed a prevalence of 1 to 2 SMLMV, with 15.5% and 37.4%, respectively (tabla 3).
With regard to parents' education, G1 showed more education among mothers, with 10.2% with higher education studies, and in groups G2 and G3 complete high school was predominant in both parents (9.6% and 26.8%, respectively).
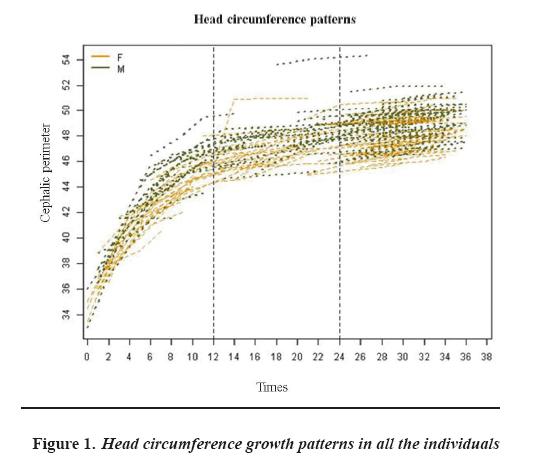
Figure 1 shows that head circumference growth patterns for all the individuals showed a maximum gradient of growth in group G1 (0 to 12], while in groups G2 and G3 the slope tends to decrease, so growth pattern is not displayed in a global manner for children from G2 and G3. This result led us to propose growth models over time for each of the characterized groups.
Taking into account these findings table 4, this information was modeled from equation (1.1), finding out 6 linear growth models by age group G1, G2 and G3 and by sex. In addition, it was observed that in group G1 the quadratic or cubic growth models can be adjusted in time (AIC low values, AKAIKE information criteria),35, 37 which shows a greater growth variability in children from group G1 (in their first year), while growth is more stable in groups G2 and G3 (second and third year).
The results of the estimation of parameters and the adjustment of models by groups are shown in table 4.

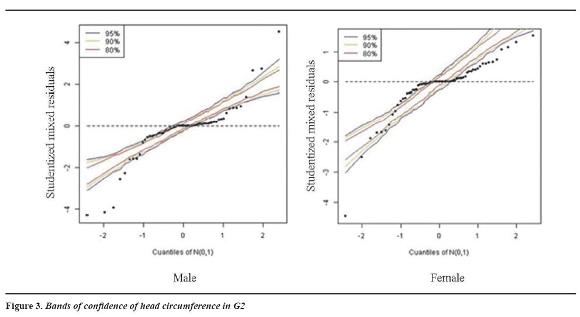
The information in table 4 is represented in the confidence bands or envelopes, which allow observing how much the model was adjusted to the data and how residuals were distributed.
In groups G1 and G2 (figures 2 and 3), the confidence bands show that the proposed models are appropriate for describing the population growth pattern. Nearly all the individuals are included in the confidence bands, showing a better adjustment in males than in females, although the growth pattern is not uniform as some atypical behaviors appear, mainly in G2. It is important to note that while the level of confidence (represented by percentiles 80%, 90% and 95%) grows, the residuals remain within the confidence band, ensuring a good fit of the models proposed to evaluate head circumference development in different age groups.
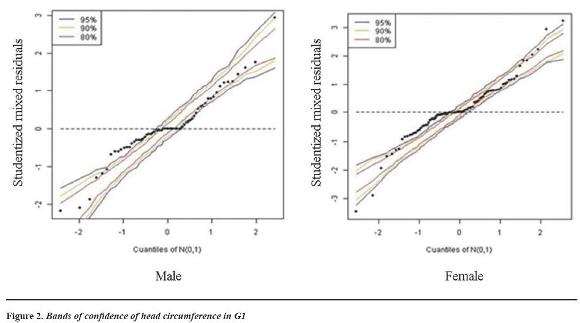
In figure 2, the envelopes or confidence bands for G1 showed a better fit for boys, as no atypical data are present; by comparing with G2 and G3, there is symmetrical distribution of data, and the residuals are distributed within the confidence bands. Narrower confidence bands appear in females, as well as two atypical data located at the right and left tails.
Figura 3 shows atypical data in the left and right light tails. Females show asymmetry in distribution, with the presence of atypical data in the heavy tail at the top right area of the figure.
Figure 4 shows narrow bands, atypical data in left and right light tails in both sexes, and minor fit of the residuals in relation to G1 and G2. In this case, the rhythms of development are more variable and this strong variability is not observed with the proposed models.
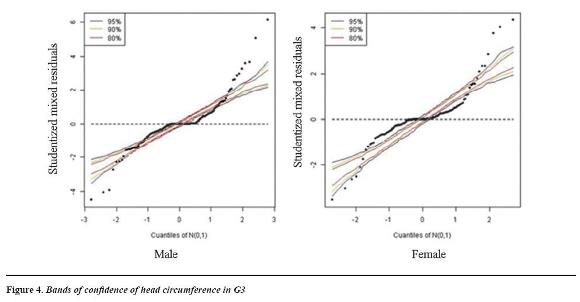
Figure 5 shows the difference of behavior for each age and sex group (sexual dimorphism) for the head circumference variable, suggesting a different growth model for each sex.
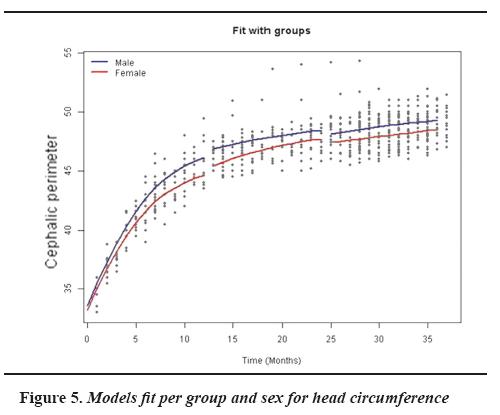
G1 shows a greater growth increase (from 0 to 12 months) in boys than girls, and a greater curve slope compared to groups G2 and G3, showing lower growth increase. However, this was also greater in boys than girls, showing sexual dimorphism.
DISCUSSION
Being a prospective longitudinal study, the criteria for children eligibility considered inclusion and exclusion factors, following the WHO's recommendations to gather a prescriptive sample ''How children should grow''in ideal conditions of health, reflecting an ''idea'' WHO growth.19, 20, 31, 32 In this context, mixed longitudinal models proved to be a useful tool for modeling the behavior of head circumference growth in children aged 0 to 3 years, since they were modeled by age and sex groups, allowing to observe the distribution of residuals, identify atypical data and assess interindividual variability.36 These features provide comparative advantages over current proposals31-34 to construct growth curves of head circumference as an indicator of craniofacial and neurodevelopmental health— an aspect considered in Colombian regulations (Resolution 0412 of 2000), in programs of promotion and prevention of growth and development in early childhood.22
These findings showed a greater gradient of growth from 0 to 12 months, agreeing with what is currently proposed as growth pattern, based on the methodology proposed by the WHO31, 32 and in Farkas' descriptive studies. 11, 12 By modeling the data by age groups, the envelopes or bands of confidence showed a better distribution of residuals in groups G1 and G2, indicating that the model offered a better fit for these groups, contrary to the behavior of group G3, which showed more atypical data outside the bands of confidence or envelopes. This finding explains why children grow more uniformly during their first months of life, 40-42 while variability increases with age as a response to environmental influences and to the increase of variables that can influence growth behavior and craniofacial variability, such as eco-geographical factors,43-47 health status and well-being,1, 2, 29, 34 food habits, customs, nutrition, socio-economic
conditions,47-51 and the practice of breastfeeding. 49-55 Furthermore, some studies have reported associations between deficiencies in health conditions and socio- economic needs with alterations in head circumference dimensions.27, 29, 50, 51
Characterization of the sample showed predominance of social strata 2 and 3 and income between 1 and 2 SMLMV; however, children are offered programs committed to welfare and early childhood development, breastfeeding promotion (which was reflected in a 98.2% of exclusive breastfeeding up to six months and prolonged breastfeeding until 12 to 18 months in a 38.8% and 33.3%, respectively), welfare, sanitation and food security. These conditions may have favorably influenced the behavior of head circumference growth and children neurodevelopment. 1, 2 Another important aspect was the predominance of parents and grandparents migration from the Cundinamarca- Boyacá region in 75.2% and 85.2%, respectively. It has been reported that migration and gene flow influence craniometrical distances during the development of cranial features, and variability of craniofacial dimensions are influenced by heredity and processes of biological adaptability, in response to food type, customs, and upbringing habits.46, 49, 56 These factors may explain the presence of children with larger or smaller cephalic perimeters for their age, which were identified in this model as atypical, despite fulfilling the inclusion criteria defined in the methodology.
With regard to sexual dimorphism, a greater head circumference was observed in boys than in girls in the three age groups; however, a clear sexual dimorphism was not evidenced at birth, as reported in craniofacial studies and in international reference patterns (WHO).31
Describing head circumference growth patterns during the first years of life based on mixed longitudinal models allowed to characterize growth patterns in three age groups (G1, G2, and G3) and at the same time to identify the presence of non- uniform behavior within these groups (atypical data in the confidence bands)—something that is not possible with the Box Cox and LMS methods—. Therefore, the methodology proposed in this article becomes a new approach to the construction of children growth patterns based on the head circumference, as a key indicator of children growth.
CONCLUSIONS
The methodology used in this study allowed characterizing growth based on knowledge of the head circumference and analyzing data with imbalanced structures (not all children are measured at the same instant), thus establishing a good approach to modeling craniofacial growth. Similarly, this methodology permitted to assess interindividual variability and to identify atypical data, leading to a more accurate analysis of the presence of normality or alterations. For future research, we suggest to introduce covariates in order to improve model fit and to implement easy-to-access software to popularize the proposed methodology among the medical and dental community, so that it can be implemented in clinical practice as a diagnostic support and in public policy promotion and prevention programs.
CONFLICTS OF INTEREST
The authors declare having no conflicts of interest.
REFERENCES
1. Bartholomeusz HH, Courchesne E, Karns CM. Relationship between head circumference and brain volume in healthy normal toddlers, children, and adults. Neuropediatrics 2002; 33: 239-241. [ Links ]
2. Ivanovic DM, Leiva BP, Pérez HT, Olivares MG, Díaz NS et al. Head size and intelligence, learning, nutritional status and brain development. Head, learning, nutrition and brain. Neuropsychologia 2004; 42: 1118-1131. [ Links ]
3. Kelly A, Kevany J, De Onis M, Shah PM. A Who collaborative study of maternal anthropometry and pregnancy outcomes. Int J Gynaecol Obstet 1996; 53(3): 219-233. [ Links ]
4. Kjaer I. Prenatal skeletal maturation of the human maxilla. J Craniofac Genet Dev Biol 1989; 9: 257-264. [ Links ]
5. Enlow DH. Handbook of Facial Growth. Philadelphia: W.B. Saunders; 1982. [ Links ]
6. Sardi ML, Ramírez FV. A cross sectional study of human craniofacial growth. Ann Hum Biol 2005; 32(3): 390-396. [ Links ]
7. Morimoto N, Ogihara N, Katayama K, Shiota K. Threedimensional ontogenetic shape changes in the human cranium during the fetal period. J Anat 2008; 212: 627- 635. [ Links ]
8. Staley NR. Ortodoncia. Editores: Samir E. Bishara. Crecimiento postnatal humano. México: McGraw-Hill Interamericana; 2003. [ Links ]
9. Sgouros S, Natarajan K, Hockley AD, Goldin JH, Wake M. Skull Base Growth in in Childhood. Pediatr Neurosurg 1999; 31: 259-268. [ Links ]
10. Brodie AG. On the growth pattern of the human head from the third month to the eighth year of life. Am J Anat 1941; 68: 723-724. [ Links ]
11. Farkas L, Ponick J, Reczko T. Growth patterns of the head and face: a morphometric study measurements in the regions Craniofacial. J Cran Surg 1992; 29(4):308-315. [ Links ]
12. Farkas LG, Hrecsko TM, Katic MJ, Forrest C. Proportion indice in the craniofacial regions of 284 healthy North American white children between 1 and 5 years of age. J Cran Surg 2003; 14(1): 13-28. [ Links ]
13. Bathia SN, Leighton BC. A manual of facial growth. A Computer Analysis of Longitudinal Cephalometric Growth Data. Oxford: University Press Oxford; 1993. [ Links ]
14. Dekaban AS. Tables of cranial and orbital measurements, cranial volume, and derived indexes in males and females from 7 days to 20 years of age. Ann Neurol 1977; 2: 485- 491. [ Links ]
15. Roche AF, Mukherjee D, Guo SM, Moore WM. Head circumference reference data: birth to 18 years. Pediatrics 1987; 79: 706-712. [ Links ]
16. Fujimura M, Seryu JI. Velocity of head growth during the perinatal period. Arch Dis Child 1977; 52: 105 -112. [ Links ]
17. Nishi M, Miyake H, Akashi H, Shimizu H, Tateyama H, Chaki R et al. An index for proportion of head size to body mass during infancy. J Child Neurol 1992; 400-403. [ Links ]
18. Feingold M, Bossert WH. Normal values for selected physical parameters: an aid to syndrome delineation. Birth Defects Orig Artic Ser 1974; 10(13): 1-16. [ Links ]
19. Garza C, de Onis M. Justificación para la elaboración de una nueva referencia internacional del crecimiento. Food Nut Bull 2004; 25(1): S5-S14. [ Links ]
20. De Onis M, Habicht J. Anthropometric reference data for international use: recommendations from a World Health Organization Expert Committee. Am J Clin Nutr l996; 64: 650-658. [ Links ]
21. NCHS. Growth curves for children. Birth - 18 years. United States DHEW Pub. Dept of Health, Education and Welfare. Public Health Service. National Center for Health Statistics. USA: Hyattsville, MD; 1977. [ Links ]
22. Hagenas L, Colón E, Merker A, Soder O, Chanin S, Del Toro K et al. Estándares normativos de crecimiento en Colombia. [Internet] FCI, Karolinska Institute, ACEP. [Consultado 2012 nov 24]. Disponible en: https://www.google.com.co/#q=fundacion+cardioinfantil+curvas+de+bogota [ Links ]
23. Williams CA, Dagli A, Battaglia A. Genetic disorders associated with macrocephaly. Am J Med Genet A 2008; 146A: 2023-2037. [ Links ]
24. Olusanya BO. Maternal antecedents of infants with abnormal head sizes in southwest Nigeria: A communitybased study. J Family Community Med 2012; 19(2): 113- 118. [ Links ]
25. Bello PA, Machado M, Castillo R, Barreto E. Relación entre las dimensiones Craneofaciales y la malnutrición fetal. Rev Cubana Ortod 1988; 13(2): 99-106. [ Links ]
26. Pickett KE, Rathouz PJ, Dukic V, Kasza K, Niessner M, Wright RJ et al. The complex enterprise of modelling prenatal exposure to cigarettes: what is 'enough'? Paediatr Perinat Epidemiol 2009; 23: 160-170. [ Links ]
27. Weaver DD, Christian JC. Familial variation of head size and adjustment for parental head circumference. J Pediatr 1980; 96: 990-994. [ Links ]
28. Lllingworth RS. The head circumference in infants and other measurements to which it may be related. Acta Paediatr Scand 1971; 60: 333-337. [ Links ]
29. Sánchez R, Echeverri J, Pardo R. Perímetros braquial y cefálico como indicadores de pobreza y enfermedad diarreica aguda en niños menores de 5 años, en Bogotá. Rev Salud Pública 2004; 6(2): 167-182. [ Links ]
30. Schienkiewitz A, Schaffrath AR, Dortschy R, Ellert U, Neuhauser H. German head circumference references for infants, children and adolescents in comparison with currently used national and international references. Acta Paediatr 2011; 100: e28-e33. [ Links ]
31. Cordero VD, Mejía SM. Patrones de crecimiento. La Paz: OPS/OMS; 2007. [ Links ]
32. WHO Multicentre Growth Reference Study Group. WHO child growth standards: head circumference-for-age, arm circumference for-age, triceps skinfold-for-age and subscapular skinfold-for-age: methods and development. Geneva: WHO; 2007. [ Links ]
33. Cole TJ, Williams AF, Wright CM. Revised birth centiles for weight, length and head circumference in the UKWHO growth charts. Ann Hum Biol 2011; 38(1): 7-11. [ Links ]
34. Daymont C, Zabel M, Feudtner C, Rubin D. The test characteristics of head circumference measurements for pathology associated with head enlargement: a retrospective cohort study. BMC Pediatrics 2012; 12: 9. [ Links ]
35. Bates DM. lme4: Mixed-effects modeling with R. [Internet]. [Consultado 2014 Abr 26]. Disponible en: http://lme4.r-forge.r-project.org/lMMwR/lrgprt.pdf [ Links ]
36. Singer JM, Nobre JS, Rocha FS. Análisis de datos longitudinales. Departamento de Estadística. São Paulo: Universidad de São Paulo; 2012. [ Links ]
37. Schneiderman ED, Kowalski CJ. Analysis of longitudinal data in craniofacial research: some strategies. Crit Rev Oral Biol Med 1994; 5(3-4): 187-202. [ Links ]
38. Laird NM, Ware JH. Random effects models for longitudinal data. Biometrics 1982; 38: 963-974. [ Links ]
39. López L, Franco D, Barreto S. Sobre la construcción del mejor predictor lineal insesgado (BLUP) y restricciones asociadas. Revista Colombiana de Estadística 2007; 30(1): 13-36. [ Links ]
40. Bayley N. Bayley scales of infant development. 2.a ed. San Antonio: Harcourt Brace and Company; 1993. [ Links ]
41. Griffiths R. The abilities of babies. New York: McGraw- Hill Book; 1954. [ Links ]
42. Ortiz PN. Escala abreviada del desarrollo. Bogotá: Ministerio de Salud; 1999. [ Links ]
43. Bogin B. Evolutionary perspective on human growth. Ann Rev Antroph 1999; 28: 109-153. [ Links ]
44. Eveleth PB. The effects of climate on growth. Ann NY Acad Sci 1966; 134: 750-759. [ Links ]
45. Wehby GL, Castilla EE, Lopez CJ. The impact of altitude on infant health in South America. Econ Hum Biol 2010; 8(2): 197-211. [ Links ]
46. Whitley E, Gunnell D, Smith G , Holly JM, Martin RM. Childhood circumstances and anthropometry: the boyd Orr cohort. Ann Hum Biol 2008; 35(5): 518-534. [ Links ]
47. Johnston FE. Environmental constraints on growth: extent and significance. En: Hauspie R, Lindgren G. Essays in auxolog. Londres: Castlemead; 1995. [ Links ]
48. Silva LM, Rossem LV, Jansen PW, Hokken-Koelega AC, Moll HA, Mackenbach JP et al. Children of low socioeconomic status show accelerated linear growth in early childhood; results from the generation R study. Plos One 2012; 7(5): 1-10. [ Links ]
49. Montgomery SM, Bartley MJ, Wilkinson RG. Family conflict and slow growth. Arch Dis Child 1997; 77: 326- 330. [ Links ]
50. Christiansen N, Mora OJ, Herrera G. Family social characteristics related to physical growth of young children. Brit J Prev Soc Med 1975; 29: 121-130. [ Links ]
51. Koopman J, Fajardo LA, Bertrand W. Food, sanitation, and the socioeconomic determinants of child growth in Colombia. Am J Public Health 1981; 71: 31-37. [ Links ]
52. Alvarado BE, Zunzunegui MV, Delisle H, Osorno J. Growth trajectories are influenced by breast-feeding and infant health in Afro Colombian community. J Nutr 2005; 135: 2171-2178. [ Links ]
53. Amaizu N, Shulman NR, Schanler RJ, Lau C. Maturation of oral feeding skills in preterm infants. Acta Paediatr 2008; 97(1): 61-67. [ Links ]
54. Matsuo K Palmer JB. Coordination of mastication, swallowing and breathing. Jpn Dent Sci Rev 2009; 45: 31- 40. [ Links ]
55. Carruth BR, Skinner JD. Feeding Behaviors and Other Motor Development in Healthy Children (2-24 Months). J Am College Nutr 2002; 21(2): 88-96. [ Links ]
56. Morris SE. A profile of the development of oral motor skills in early infancy - birth to 12 months, (manual). Faber: Unpublished Work; 1991. [ Links ]
