


 text in
  English (pdf)
 Article in xml format
 Article references
 Send this article by e-mail
 Cited by SciELO
  Cited by Google
  Similars in
SciELO
Similars in
SciELO  Similars in Google
 Permalink
INTRODUCTION
Health sciences schools and careers are currently contextualized within a global dimension known as the learning environment, an intangible multifactorial domain determined by curricular designs, teaching strategies and learning methodologies.(1,2) Proper quality feedback, the social context and the role of models can also influence this atmosphere.(2) The main feature of this educational environment is its capacity to influence students’ behavior, their learning outcomes and their motivation and satisfaction about their own education.(3,4,5)
As medical education evolves, the students’ opinion on their own learning process is taken into account for curricular design.(6,7) In 1997, the DREEM (Dundee Ready Educational Environment Measure) was created at the Dundee University, in Scotland.(8) This 50-statement questionnaire constitutes a universal, not culturally-specific tool, with qualitative and quantitative methodologies, and allows the creation of an educational profile based on the following domains: learning, teacher, academic, atmosphere, and social perceptions.(9,10) Moreover, it has excellent psychometric properties,(11,12) validity and internal reliability,(13) and it has been used in several countries from Europe, Asia, Africa and Latin America, and in several health science schools, like Medicine, Nursing and Dentistry.14,15,16) Regarding dentistry, its application has been reported in New Zealand, Germany, and India, while very little evidence seems to be available for Latin America.(15,17)
In Chile, the learning environment has been assessed in medical education but no studies have been published so far for dental schools in public universities..(4) It is therefore mandatory to assess this educational context, in order to make curricular changes and improvements and to boost the learning outcomes.(18)
The aim of the present study is to assess the learning environment in the new dentistry program at the Arturo Prat University, in northern Chile, using the DREEM questionnaire. The proposed hypotheses are: 1) the educational environment is perceived as favorable to learning and 2) there are no significant differences in perception between the basic, the pre-clinical and the clinical levels of the dentistry career.
MATERIALS AND METHODS
Participants
In this observational descriptive study, students from the basic (first year), pre-clinical (second and third years) and clinical level (fourth and fifth years) of the dentistry career at the Arturo Prat University were asked to voluntarily participate. The questionnaires were applied during the second semester of 2016. The study complies with the ethical principles set by the Declaration of Helsinki of the World Medical Association in 2013. Once informed of the voluntary and anonymous inclusion in the study, each participant received an informed consent based on the World Health Organization (WHO) guidelines, and a translated and validated version of DREEM. The participants’ gender and age were not specified in the present study. The sample size was calculated based on the following parameters: total universe n = 160 -which distribution by level was calculated-, z = 1.69, corresponding to 95% reliability interval, e = 0.05 or error range of 5% and p-q standard values of 0.5. The resulting sample size was 113 DREEM questionnaires, which were applied to assess the perception of the learning environment. The final distribution by level was as follows: 32 for the basic level, 58 for the pre-clinical level, and 24 for the clinical level.
The instrument
In this validated Spanish version of DREEM, the words ‘medic’ and ‘medicine’ were changed to ‘dentist’ and ‘dentistry’ respectively. The present questionnaire includes 50 statements, sequentially ordered from 1 to 50, with a Likert scale format. The questions are correlated with one of the following five domains: learning, teacher, academic, atmosphere, and social perception. Each item had the following scores: 0 point for ‘strongly disagree’, 1 point for ‘disagree’, 2 points for ‘unsure’, 3 points for ‘agree’, and 4 points for ‘strongly agree’. Scores from questions 4, 8, 9, 17, 35, 39, 48, and 50 were inverted, based on a lower qualitative indicator for a higher Likert scale. Partial and total scores were assigned to each domain as follows:
Domain 1: Learning perception
0-12 points: very poor; 13-24 points: teaching is viewed negatively; 25-36 points: a more positive approach; 37-48 points: teaching is highly thought of.
Domain 2: Teacher perception
0-11 points: very poor; 12-22 points: in need of some re-training; 23-33 points: moving in the right direction; 34-44 points: model teachers.
Domain 3: Academic perceptions
0-8 points: feeling of total failure; 9-16 points: many negative aspects; 17-24 points: feeling more on the positive side; 25-32 points: confident.
Domain 4: Atmosphere perception
0-11 points: a terrible environment; 13-24 points: there are many issues that need to change; 25-36 points: a more positive atmosphere; 37-48 points: a good feeling overall.
Domain 5: Social perceptions
0-7 points: miserable; 8-14 points: not a nice place; 15-21 points: not too bad; 22-28 points: very good socially.
In this scale, a negative value was given to the first two categories, representing 0 to 50% of the maximum score, and a positive value for the last two categories corresponding to 51 to 100% of the total score. Once all the scores were calculated, a final scale was applied for the overall learning environment, as follows:
0-50 points: very poor
51-100 points: with many problems
101-150 points: more positive than negative 151-200 points: excellent learning environment
Statistical analysis
The obtained data were sorted out by domain and by question, and later processed using the SPSS software for Windows. The Cronbach’s alpha score was calculated to determine the instrument’s internal reliability, obtaining an overall score of 0.92. Normality distribution tests were applied to each group; the Shapiro-Wilk test was applied to the data from the basic and clinical levels, which n ≤ 50, and the Kolmogorov-Smirnov test was applied to the data from the pre-clinical level, which n ≥ 50. A p-value < 0.05 for the five domains of the pre-clinical level and a p-value > 0.05 for the five domains of the basic and clinical levels were obtained. Additional Q-Q plots and histograms were conducted as complementary analysis, accepting the normal distribution of data. The one-way ANOVA test was carried out to determine the equality of means between the scores from different levels and domains, finding no statistical significant differences in the ‘social perception’ domain, with a p = 0.153. The multiple comparisons Tukey test was finally applied to the four remaining domains and the three study levels.
RESULTS
One hundred three of the 113 interviews were correctly answered and 8.9% of dropout was confirmed. Twenty-eight interviews corresponded to the basic level, fifty-one to the pre-clinical level, and twenty-four to the clinical level. The mean scores by level and domain are shown in Table 1, and the frequency distributions for qualitative rating in Figure 1.
Table 1: Mean scores by level and DREEM domain
| N | Minimum | Maximum | Mean | S.D. | Qualitative rate | ||
| Level 1 | Total domain 1 | 28 | 20 | 40 | 32.82 | 4.91 | A more positive approach |
| Total domain 2 | 28 | 22 | 39 | 30.39 | 4.15 | Moving in the right direction | |
| Total domain 3 | 28 | 16 | 30 | 22.96 | 3.91 | Feeling more on the positive side | |
| Total domain 4 | 28 | 18 | 37 | 29.39 | 4.40 | A more positive atmosphere | |
| Total domain 5 | 28 | 9 | 23 | 16.21 | 3.38 | Not too bad | |
| Overall | 28 | 91 | 164 | 131.79 | 16.91 | Educational environment more positive than negative | |
| Level 2 | Total domain 1 | 51 | 14 | 40 | 29.06 | 5.99 | A more positive approach |
| Total domain 2 | 51 | 17 | 40 | 28.22 | 4.75 | Moving in the right direction | |
| Total domain 3 | 51 | 7 | 30 | 21.96 | 4.12 | Feeling more on the positive side | |
| Total domain 4 | 51 | 11 | 39 | 26.80 | 6.10 | A more positive atmosphere | |
| Total domain 5 | 51 | 2 | 22 | 14.76 | 4.41 | Not a nice place | |
| Overall | 51 | 67 | 160 | 120.80 | 20.04 | Educational environment more positive than negative | |
| Level 3 | Total domain 1 | 24 | 16 | 37 | 24.75 | 6.41 | A more positive approach |
| Total domain 2 | 24 | 9 | 35 | 22.04 | 6.43 | In need of some re-training | |
| Total domain 3 | 24 | 9 | 30 | 19.25 | 5.62 | Feeling more on the positive side | |
| Total domain 4 | 24 | 10 | 33 | 20.75 | 7.12 | There are many issues that need to change | |
| Total domain 5 | 24 | 6 | 22 | 14.08 | 4.17 | Not a nice place | |
| Overall | 24 | 64 | 142 | 100.88 | 25.72 | Educational environment more positive than negative |
S.D: Standard Deviation
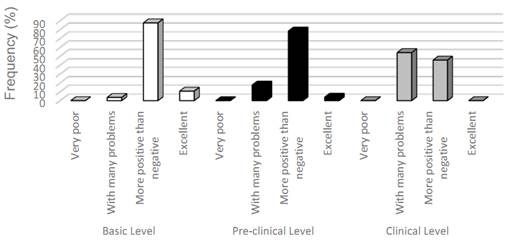
In the basic level, the mean scores for all the domains are in the positive range, with 85.7% of participants grading the environment as ‘more positive than negative’ and 3.6% as ‘with many problems’. The global mean score is 131.78/200 points, corresponding to a ‘more positive than negative’ environment. In the pre-clinical level, all the domains except ‘social perception’ are in the positive range. In this item, the total mean score is 14.76/28 points, placing it in the limit between the negative and the positive range. The total mean score for this level is 120.80/200, qualifying as ‘a more positive than negative’ educational environment. In this level, 17.6% of participants rated the environment as ‘with many problems’ and a 78.4% as ‘more positive than negative’.
The results show a greater imparity in the clinical level. 54.2% of students rated the learning environment as ‘with many problems’ and 45.8% as ‘more positive than negative’. ‘Teacher perception’, ‘atmosphere perception’ and ‘social perception’ were rated in the negative range, with 22.04/44 points, 20.75/48 points and 14.08/28 points, respectively. The global mean score for the perception is 100.75/200 points, corresponding to a ‘more positive than negative’ environment, at the limit between negative and positive range.
The total mean score for all the three levels and five domains is 117.80/200 points, qualifying for a ‘more positive than negative’ global learning environment.
The mean scores among the three levels and arranged by domain and statement are shown in table 2. For the ‘learning perception’ domain, the highest mean values were obtained in questions 1 and 16, related to learning and motivation, whereas the lowest scores (less than 2 points) were in the items 25 and 48, related to the learning focus. In the ‘teacher perception’ domain, only statement 2 obtained a high score (over 3 points), concerning teachers’ knowledge. The lower mean score was found in question 9, related to the authoritarianism of teachers. No score was below 2 points (qualitatively negative). In relation to the ‘atmosphere domain’, no statement scored over 3 points. All items scored between 2 and 3 points, except for items 12, 17, and 42, in relation to schedule management, coping phenomenon and stress, respectively. In the ‘social perception’ domain, only item 15 ‘I have good friends’ scored over 3 points, and questions 3, 4 and 14 have scores below 2 points, regarding student support systems, burnout and motivation, respectively.
Table 2a : Overall mean scores by statement in DREEM domains 1 and 2
| Learning perception | Mean | S.D. | N | |
|---|---|---|---|---|
| 1 | I am encouraged to participate during teaching sessions | 3.07 | 0.718 | 103 |
| 7 | The teaching is often stimulating | 2.48 | 1.018 | 103 |
| 13 | The teaching is student-centered | 2.54 | 0.958 | 103 |
| 16 | The teaching helps to develop my competences | 3.00 | 0.816 | 103 |
| 20 | The teaching is well-focused | 2.69 | 0.919 | 103 |
| 22 | The teaching helps to develop my confidence | 2.12 | 1.051 | 103 |
| 24 | The teaching time is put to good use | 2.43 | 0.956 | 103 |
| 25 | The teaching over-emphasizes factual learning | 1.45 | 1.017 | 103 |
| 38 | I’m clear about the learning objectives of the course | 2.73 | 0.831 | 103 |
| 44 | The teaching encourages me to be an active learner | 2.24 | 1.208 | 103 |
| 47 | Long-term learning is emphasized over short-term learning | 2.36 | 1.145 | 103 |
| 48 | The teaching is too teacher-centered | 1.98 | 1.048 | 103 |
| Teacher perception | Mean | S.D. | N | |
| 2 | The teachers are knowledgeable | 3.26 | 0.727 | 103 |
| 6 | The teachers adopt a patient-centered approach to consulting | 2.51 | 0.803 | 103 |
| 8 | The teachers ridicule the students | 2.49 | 1.162 | 103 |
| 9 | The teachers are authoritarian | 1.46 | 1.170 | 103 |
| 18 | The teachers have good communication skills with patients | 2.42 | 0.774 | 103 |
| 29 | The teachers are good at providing feedback to students | 2.43 | 1.081 | 103 |
| 32 | The teachers provide constructive criticism here | 2.81 | 1.039 | 103 |
| 37 | The teachers give clear examples | 2.76 | 0.880 | 103 |
| 39 | The teachers get angry in teaching | 2.42 | 1.168 | 103 |
| 40 | The teachers are well-prepared for their teaching sessions | 2.81 | 0.971 | 103 |
| 50 | The students irritate the teachers | 2.02 | 1.029 | 103 |
Table 2b: Overall mean scores by statement in DREEM domains 3, 4 and 5
| Academic self-perception Mean S.D. N | ||||
|---|---|---|---|---|
| 5 | Learning strategies that worked for me in the past still work for me now | 2.36 | 1.179 | 103 |
| 10 | I am confident about my passing this year | 2.73 | 1.198 | 103 |
| 21 | I feel I am being well prepared for my profession | 2.80 | 0.974 | 103 |
| 26 | Last year’s work has been a good preparation for this year’s work | 2.65 | 0.967 | 103 |
| 27 | I am able to memorize all I need | 2.27 | 1.131 | 103 |
| 31 | I have learnt a lot about empathy in my profession | 2.93 | 0.963 | 103 |
| 41 | My problem-solving skills are being well developed here | 2.65 | 0.893 | 103 |
| 45 | Much of what I have to learn seems relevant to a career in healthcare | 3.21 | 0.882 | 103 |
| Atmosphere perception Mean S.D. N | ||||
| 11 | The atmosphere is relaxed during ward teaching | 2.06 | 0.539 | 103 |
| 12 | This school is well time-tabled | 1.47 | 1.092 | 103 |
| 17 | Cheating is a problem in this school | 1.04 | 1.038 | 103 |
| 23 | The atmosphere is relaxed during lectures | 2.74 | 0.863 | 103 |
| 30 | There are opportunities for me to develop my interpersonal skills | 2.50 | 1.037 | 103 |
| 33 | I feel comfortable in class socially | 2.79 | 0.925 | 103 |
| 34 | The atmosphere is relaxed during class/seminars/tutorials | 2.15 | 1.,200 | 103 |
| 35 | I find the experience disappointing | 2.39 | 1.246 | 103 |
| 36 | I am able to concentrate well | 2.42 | 1.142 | 103 |
| 42 | The enjoyment outweighs the stress of the course | 1.79 | 1250 | 103 |
| 43 | The atmosphere motivates me as a learner | 2.46 | 1.144 | 103 |
| 49 | I feel able to ask the questions I want | 2.31 | 1.291 | 103 |
| Social self-perception Mean S.D. N | ||||
| 3 | There is a good support system for students who get stressed | 1.16 | 0.872 | 103 |
| 4 | I am too tired to enjoy the course | 1.44 | 1.226 | 103 |
| 14 | I am rarely bored in this course | 1.84 | 1.046 | 103 |
| 15 | I have good friends in this course | 3.35 | 0.789 | 103 |
| 19 | My social life is good | 2.73 | 1.148 | 103 |
| 28 | I seldom feel lonely | 2.20 | 1.232 | 103 |
| 46 | My accommodation is pleasant | 2.28 | 1.240 | 103 |
The statistical comparison by domain and among levels is shown in table 3. For the ‘learning perception’ domain, statistical significant differences were found for the three study levels, with a decreasing tendency from the basic to the clinical level. For ‘teacher perception’, ‘academic perception’, and ‘atmosphere perception’, no significant differences were observed between the basic and the pre-clinical level, but between the clinical level and the other two levels, also with a decreasing tendency. When comparing the scores from the ‘social perception’ domain, no significant differences were found among levels.
The comparison of the global mean scores did not show statistical significant differences between the basic (131.78/200) and the pre-clinical level (120.80/200). Both groups differ statistically from the clinical level, showing a similar decreasing trend towards the clinical academic course (100.87/200).
Table 3: Statistical comparison among academic levels by overall domain scores
| Subset for α = 0.05 | |||||
|---|---|---|---|---|---|
| Level | N | ||||
| Learning perception | 3 | 24 | 24.75* | ||
| 2 | 51 | 29.06* | |||
| 1 | 28 | 32.82* | |||
| sig | 1.000 | 1.000 | 1.000 | ||
| 3 | 24 | 22.04* | |||
| Teacher perception | 2 | 51 | 28.22 | ||
| 1 | 28 | 30.39 | |||
| sig | 1.000 | 0.211 | 0.211 | ||
| Academic self-perception | 3 | 24 | 19.25* | ||
| 2 | 51 | 21.96 | |||
| 1 | 28 | 22.96 | |||
| sig | 1.000 | 0.651 | 0.651 | ||
| 3 | 24 | 20.75* | |||
| Atmosphere perception | 2 | 51 | 26.8000 | ||
| 1 | 28 | 29.39 | |||
| sig | 1.000 | 0.207 | 0.207 | ||
| Social self-perception | 3 | 24 | 14.08 | ||
| 2 | 51 | 14.76 | |||
| 1 | 28 | 16.21 | |||
| sig | 0.107 | 0.107 | 0.107 | ||
| 3 | 24 | 100.87* | |||
| Overall | 2 | 51 | 120.8 | ||
| 1 | 28 | 131.78 | |||
| sig | 1.000 | 0.099 | |||
* p < 0.05: Statistical significant difference
DISCUSSION
The learning environment is now considered essential in the health sciences curricula, mostly because of its several influencing factors and its impact on students’ learning outcomes.(14) In the present study-the first one conducted in a dentistry program in a public institution in Chile, which had a 90.1% of participation-, the students’ perception of the learning environment was assessed by applying the DREEM questionnaire. The results demonstrate that the overall perception of this educational atmosphere is more positive than negative, hence favoring learning. This confirms our first hypothesis. When analyzing the overall score by level and qualitative significance, a constant and significant decrease is observed from the basic to the clinical level, when students usually face new and more complex academic challenges-and thus the second hypothesis is not validated.
The results corresponding to the clinical level show a greater impact on the students’ psychosocial conditions. This is evidenced from the questionnaire statements on the atmosphere and social perceptions domains regarding stress. Several psychosocial and academic factors have been described in the literature and have been correlated with a lower positive perception at the clinical level: a) the first real contact with patients; b) the perception of a higher degree of courses difficulty; c) the fear of not achieving the minimum requirements of each program; d) the varying degrees of criticism and authoritarianism, and e) the lack of proper feedback.(19,20,21,22) In the present study, we also observed a lower qualitative perception of the student support system, which plays a key role in the perception of the learning environment and stress. The need for an adequate support system available in all institutions has already been discussed in the literature.(23,24) In general terms, these strategies seek to develop resilience and the professional vocation, as well as the acquisition of learning strategies and tools based on a personal approach, through multidisciplinary mentoring networks. (25) The results and the available evidence suggest that it is essential to develop an adequate support system for the clinical level in particular. However, some strengths can be highlighted, such as how teachers’ knowledge can help improve self confidence in students. This is reflected in the present study as a higher perception of teacher and academic environment, which are the domains that scored the highest qualitative values.
There is high variability among the mean scores for each statement of the five domains. This shows the complex interaction of the psychosocial factors and how the perception of each domain can be influenced by each factor. Even though DREEM has been described as a not culturally-specific tool, and as an instrument of universal use and application, one must be especially cautious when comparing results with dental schools among countries, mostly because of the heterogeneity of the social profiles worldwide. Comparisons should be taken as a reference and not as an absolute contrast.(15,16,17,23)
CONCLUSIONS
The learning environment is positively perceived by students of the Arturo Prat University. However, when analyzing by DREEM domains, some significant differences can be found between academic levels, and some domains seem to be negatively perceived. There is a tendency to a lower perception from the basic to the clinical level, mostly due to psychosocial factors. It is necessary to enhance student support systems in order to compensate this drawback and to promote better learning.

