


 text in
  English (pdf)
 Article in xml format
 Article references
 Send this article by e-mail
 Cited by SciELO
  Cited by Google
  Similars in
SciELO
Similars in
SciELO  Similars in Google
 Permalink
INTRODUCTION
The biopsychosocial conceptualization of the World Health Organization about impairments, disabilities, and handicaps was applied to oral health by Locker.(1) Based on this model, the 49-item Oral Health Impact Profile was developed (OHIP-49), as well as its shorter version of 14 items (OHIP-14).(2) Both instruments assess the impact of oral disease on quality of life through seven factors: functional limitation, physical pain, physical disability, psychological discomfort, psychological disability, social disability, and handicap.(2) Self-reporting instruments are available to evaluate the presence of periodontal disease in adults and are based on clinical signs and symptoms, but do not take the multidimensional theoretical model of oral health. The OHIP-49 and its shorter version (OHIP-14) are therefore two unique instruments, being the most widely used in clinical situations and research.(3)
Slade(2) validated the seven-factor model proposed for the OHIP-49 and suggested simplifying it using two indicators with more weight on each factor, to define the OHIP-14. The factor structure of this short version has been explored, resulting in < 7 factors. Using exploratory factor analysis in Australian dental patients, Brennan and Spencer(4) found two factors: functional limitation-physical disability (Items 1, 2, 5, 6, 7, 8, 9, 10, 12 and 13) and psychosocial aspects of disability and handicap (Items 3, 4, 11 and 14). Montero et al(5) found three factors in Spanish workers: psychosocial impact (Items 5, 6, 9, 10, 11, 12, 13 and 14), pain/discomfort (Items 3, 4, 7 and 8) and functional limitation (Items 1 and 2). Mello dos Santos et al,(3) in samples of Brazilianpostpartum women andolderadultsofboth sexes, proposed that the univariate model is the most appropriate.
In a community sample of 763 Brazilian adolescents, Silveira et al(6) compared a hierarchical model of a higher-order factor and seven lowerorder factors with two indicators each, based on the original model proposed by Slade.(2) The model fit by maximum likelihood was acceptable (χ2/gl = 3.973, CFI = 0.957, GFI = 0.959 and RMSEA = 0.063); the weights of the higher-order factor on the seven lower-order factors ranged from 0.52 to 0.92, and those of second order on their indicator factors went from 0.56 to 0.88.
In a sample of 1,162 adults treated at the University Dental Clinic of São Paulo, Brazil, Zucoloto, Maroco and Campos(7) estimated the goodness of fit (unigroup analysis) and the invariance (multigroup analysis) of two hierarchical models. They found out that the model with the best properties was the one with three correlated higher-order factors (impact on oral health: physical, psychosocial, and social) plus the seven factors proposed by Slade(2) as lower-order factors. In the total sample, the factor weights of the seven hierarchical factors ranged from 0.54 to 0.84, the average variance obtained went from 0.46 to 0.63, the variance shared among the seven factors went from 0.21 to 0.50, the internal consistency by Cronbach alpha went from of 0.62 to 0.77, and the coefficient of reliability from 0.63 to 0.77. They considered that fit was acceptable (χ2 /gl = 5.07, GFI = 0.97, AGFI = 0.96 and RMSEA = 0.06).
Since the metric properties of the OHIP-14 applied to periodontal disease (OHIP-14-PD) have not been studied, and given the controversy over the factor structure of the OHIP-14, the objectives of this research in adult dental patients were: describe the distribution, test the discriminability, and calculate the internal consistency of the 14 items and the total score of the OHIP-14-PD; verify the discriminant validity of the total score to differentiate between periodontal and gingivitis patients; explore the factor structure of the 14 items, and contrast the factor models proposed by Silveira et al,(6) Zucoloto,(7) Montero et al,(5) Mello dos Santos et al,(3) and the ones derived from the exploratory factor analysis, studying the internal consistency and the convergent and discriminant validity of factors.
MATERIALS AND METHODS
Participants
A non-probabilistic sample was collected including 249 dental patients. The inclusion criteria were patients 18 years of age or older who knew how to read and write, lived in Monterrey, and requested periodontal care or prophylactic dental treatment at the Clinic of Periodontics and Preventive Dentistry of the School of Dentistry of Universidad Autónoma de Nuevo León; patients were also required to provide an informed consent. The exclusion criteria were illiterate under age patients with clinical problems of attention and comprehension (schizophrenia, autism, or dementia). The elimination criterion was leaving at least one blank field in the OHIP-14-PD questionnaire.
Instrument
The Oral Health Impact Profile applied to Periodontal Disease (OHIP-14-PD) was used.(8) This instrument was adapted from the OHIP-14 by Slade,(2) focusing its questions on periodontal disease (see Annex). The OHIP-14 consists of 14 items distributed in seven factors: functional limitation (items 1 and 2), physical pain (items 3 and 4), psychological distress (items 5 and 6), physical disability (items 7 and 8), psychological disability (items 9 and 10), social disability (items 11 and 12), and handicap (items 13 and 14). The responses are given in five ordered categories: 0 = never, 1 = rarely, 2 = occasionally, 3 = often, and 4 = very often. The total score is obtained by adding the 14 items and has a range of 0 to 56.(2)
Procedure
Data were collected between October 2015 and March 2016. The patients were selected on a first come first serve basis and making sure that they were able to answer questions during dental consultation. They were referred to the periodontal service because they had signs and symptoms of the disease (54.2%), carrying out the prophylactic treatment as part of the regular dental consultation (45.8%). The patients were invited to participate in this study, explaining them its details and asking them to sign an informed consent; confidentiality of the information was guaranteed throughout the process. The study was approved by the Bioethics Committee of the Secretary of Health (DEISC-19-01-16-16).
Data analysis
Discriminability was determined by the central tendency difference between the high-score group and the low-score group of the scale contrasted by the Mann-Whitney U test. The groups were defined by the first and third quartiles on the scale. Internal consistency was estimated by the correlation of the item with the rest of the scale and by the effect of eliminating the item in the scale’s internal consistency. Correlation was calculated by the polyserial correlation coefficient (PCC), and internal consistency by ordinal alpha coefficient (ordinal α t-í). An item was considered to have weak consistency if PCCi,t-i < 0.50 and if its removal increased the internal consistency of the scale (ordinal α t-í > ordinal αt). Values of α ≥ 0.70 are considered acceptable internal consistency, while ≥ 0.80 are considered high and ≥ 0.90 unitary.(9)
In the exploratory factor analysis (EFA), factors were extracted from the polychoric correlations matrix using the method of weighted least squares (WLS). The factor matrix was rotated by the Promax method. Each item was assigned to the factor where its weight in the structural matrix was the highest and greater than 0.40.(10) To determine the number of factors, six criteria were used: Horn’s parallel analysis (95th percentile), optimal coordinates, parallel analysis, minimum average of partial correlations (either squared or to the fourth power), acceleration factor, and eigenvalues greater than one or Kaiser’s criterion.(11)
For the confirmatory factor analysis (CFA), the discrepancy function was minimized by structure factor least squares (SFLS), which accepts ordinal variables(12) and offers better results with polychoric correlation matrices.(11) Standard errors were estimated and their significance was contrasted by biascorrected percentiles, using parametric resampling with the extraction of 2000 samples. A 95% confidence interval and a 0.05 bilateral significance level were used. The values of correlation (r) and standardized measurement weights (λ) were interpreted as follows: < 0.30 was an effect of small size, between 0.30 and 0.499 was a mid-size effect, between 0.50 and 0.699 was large, between 0.70 and 0.899 was very large and ≥ 0.90 was unitary.(13)
Six fit indices were included: relative chi-square (χ2/gl), root mean-square displacement (RMSD), goodness of fit index (GFI) and its adjusted form (AGFI), normed fit index (NFI) and relative fit index (RFI) by Bollen’s Rho coefficient. The following values were considered as good fit: χ2/gl ≤ 2, SRMS ≤ 0.08, GFI ≥ 0.95, AGFI ≥ 0.90, NFI ≥ 0.95 and RFI ≥ 0.95; and the following as adjusted fit: χ2/gl ≤ 3, SRMS < 0.10, GFI ≥ 0.90, AGFI ≥ 0.85, NFI ≥ 0.90 y RFI ≥ 0.90.(14,15) The goodness of fit for the two models was considered equivalent when the ratio between the difference of their statistical chi and the difference of their models’ degrees of freedom were lower than or equal to 5 (Δχ2/Δgl ≤ 5), and the differences in the GFI, NFI and RFI indices were lower than or equal to 0.01.(14) The model’s parsimony was estimated by the (PR) index by James, Mulaik and Brett, interpreting PR values as follows: ≥ 0.75 high, ≥ 0.50 average, ≥ 0.25 low, and < 0.25 very low parsimony.(16)
Once the items were assigned to each factor, the average variance extracted (AVE) was calculated by the arithmetic mean of the squares of the structural matrix weights, as well as the composite reliability (CR) by McDonald’s omega coefficient (ω), using the structural matrix weights. The combination of an AVE > 0.50 and a CR > 0.70, or an AVE > 0.45 and a CR > 0.80 was taken as a standard for convergent validity.(9) A factor was considered to have discriminant validity compared to another when the square of the correlation between two factors (shared variance) was higher than the AVE for each factor and lower than twothirds (AVE < r2 < 0.66).(9) Discriminant validity was also assessed by means of the heterotrait-monotrait ratio of correlations (HTMT). An HTMT < 0.85 was considered as discriminant validity.(17) The analyses were carried out with SPSS22, menu R2.4 for SPSS22, AMOS16 and Excel 2007.
RESULTS
Description of the sample
48.6% of participants were females and 51.4% males. The average age was 39.92 (SD = 15.59), ranging from 18 to 76 years. Education level ranged from primary school (6 years) to graduate studies (at least 18 years) with a median of technical higher education (12 years). Out of the 249 participants, 41.4% were unmarried, 51% married, 2.8% divorced, 2.4% widowed, and 2.4% were cohabiting. Concerning occupation, 25.3% were housewives, 4.8% laborers, 32.1% employees, 5.2% had their own business, 26.5% were students, 1.6% unemployed, and 4.4% retired. In terms of subjective socioeconomic level, 5.2% considered they belong to the low social stratum, 26.5% to the middlelow stratum, 60.6% to the middle-middle, 7.2% to middle-high and 0.4% to the high social stratum, with a median of a middle-middle social stratum.
Distribution, discriminability and internal consistency
The multivariate distribution of the 14 items did not show adjustment to normality by Mardia’s tests (multivariate asymmetry: χ2 = 110.704, P < 0.001; multivariate kurtosis: χ2 = 169.873, P < 0.001). The 14 items showed discriminability (ZU < -6, P < 0.001). The internal consistency was high in the 14 items (rps(t-i) > 0.50 and ordinal α(t-i) > ordinal αt = 0.928), except for item 4 (rps(t-i) = 0.444 y α ordinal α(t-i) = 0.930) (table 1).
Table 1 Distribution, discriminability, and internal consistency of OHIP-14-PD items
| Item | Distribution (%) | Median | AIQ | PCC | Discriminability | Internal consistency | ||||||
|---|---|---|---|---|---|---|---|---|---|---|---|---|
| N | AN | O | F | VF | rPS | rps(t-i) | αt-i | |||||
| 1 | 24.9 | 16.5 | 30.9 | 17.7 | 10.0 | 2 | -0.2 | 0.05 | -8.64*** | 0.65 | 0.62 | 0.925 |
| 2 | 56.2 | 14.1 | 18.5 | 8.4 | 2.8 | 0 | 1 | 0.07 | -7.78*** | 0.69 | 0.65 | 0.922 |
| 3 | 37.4 | 18.9 | 32.5 | 8.4 | 2.8 | 1 | 0 | 0.07 | -8.42*** | 0.68 | 0.66 | 0.923 |
| 4 | 16.5 | 20.8 | 40.2 | 15.7 | 6.8 | 2 | -1 | -0.10 | -5.94*** | 0.50 | 0.44 | 0.930 |
| 5 | 20.9 | 19.7 | 30.9 | 20.5 | 8.0 | 2 | 0 | 0.07 | -8.59*** | 0.63 | 0.60 | 0.925 |
| 6 | 18.5 | 24.1 | 31.7 | 16.9 | 8.8 | 2 | 0 | 0.07 | -8.02*** | 0.64 | 0.62 | 0.925 |
| 7 | 32.5 | 21.3 | 25.3 | 13.7 | 7.2 | 1 | 0 | 0.07 | -8.31*** | 0.63 | 0.60 | 0.925 |
| 8 | 41.0 | 12.0 | 19.7 | 20.1 | 7.2 | 1 | 0.3 | 0.24 | -7.24*** | 0.64 | 0.60 | 0.924 |
| 9 | 28.9 | 16.1 | 30.5 | 11.6 | 12.9 | 2 | -1 | -0.01 | -9.13*** | 0.74 | 0.71 | 0.921 |
| 10 | 30.5 | 15.3 | 23.7 | 20.5 | 10.0 | 2 | -0.3 | 0.11 | -9.21*** | 0.75 | 0.72 | 0.921 |
| 11 | 59.8 | 21.4 | 10.4 | 5.6 | 2.8 | 0 | 1 | -0.01 | -7.76*** | 0.77 | 0.77 | 0.918 |
| 12 | 69.9 | 13.7 | 8.8 | 4.4 | 3.2 | 0 | 1 | -0.01 | -6.61*** | 0.73 | 0.72 | 0.919 |
| 13 | 72.3 | 13.7 | 9.2 | 2.8 | 2.0 | 0 | 1 | -0.01 | -6.58*** | 0.72 | 0.72 | 0.919 |
| 14 | 47.8 | 17.3 | 18.5 | 8.8 | 7.6 | 1 | 0 | 0.07 | -7.12*** | 0.58 | 0.53 | 0.927 |
N = 249. Ordered categories: N “never” = 0, AN = “almost never” 1, O “occasionally” = 2, F “frequently” = 3, VF = “Very frequently” 4. % = percentage. AIQ = Youle-Bowley’s interquartile coefficient of skewness. Discriminability: ZU = standardized value of the Mann-Whitney U test, *** P < 0.001. Cpc = corrected percentile kurtosis. PCC = polyserial correlation of the item with the scale (sum of items), CPS (i,t-i) = polyserial correlation of the item with the residual scale (excluding the item), αt-i = ordinal alpha coefficient excluding the item (ordinal α = 0.928 for the 14 items). Source: by the authors.
The internal consistency of the 14 items was very high (ordinal α = 0.928). The total score distribution of the OHIP-14-PD showed positive asymmetry (AF = 0.861, 95% CI: [0.559, 1.163]) and kurtosis (CF = 0.784, 95% CI: [0.182, 1.386]), and therefore was not adjusted to a normal distribution (ZK-S-L = 0.072, P = 0.003). The mean was 18.01 (95% CI: [16.62, 19.40]), with a standard deviation of 11.147 and a median of 17 (Q1 = 9, Q3 = 24).
Discriminant validity of the OHIP-14-PD
The central tendency of the distribution of OHIP-14-PD total score was significantly higher (ZU = -4,326, P < 0.001) among the 149 periodontal patients (M = 20.39, 95% CI: [18.60, 22.18]); Mdn = 19 [Q1 = 13, Q3 = 26]) than among the 100 gingivitis patients (M = 14.54, 95% CI: [12.49, 16.59]); Mdn = 12.5 [Q1 = 7, Q3 = 20.35]).
Exploratory factor analysis
The number of factors by Horn’s parallel analysis, optimal coordinates, and acceleration factor was 1. By the test of the minimum average of the squared partial correlations and to the fourth power, as well as by Kaiser’s criterion, was 3. The removal of one factor explained 49.4% of the total variance. The factor had a very high internal consistency (ordinal α = 0.928) and convergent validity (AVE= 0.494 and CR = 0.930) (Table 2).
The extraction of three factors explained 63.6% of the total variance. The first factor was finally comprised of seven indicators (items 8, 9, 10, 11, 12, 13 and 14); due to its content, it was called psychosocial impact, had a very high internal consistency (ordinal α = 0.921) and showed convergent validity (AVE = 0.634 and CR = 0, 923). The second factor was finally comprised of two indicators (items 5 and 6). Due to its content, it was called symptoms of bad smell and taste of mouth or physical disability, according to Slade;(2) it had a high internal consistency (ordinal α = 0.881) and showed convergent validity (AVE = 0.790 and CR = 0.881). The third factor was finally comprised of five indicators (items 1, 2, 3, 4 and 7); due to its content it was called physical impact, had a high internal consistency (ordinal α = 0.833) and showed convergent validity (AVE = 0.519 and CR = 0.839). The variances shared among the factors ranged from 23.8% to 48.7%, and in all cases were lower than the AVE for each factor, so the factors showed discriminant validity (Table 2).
Table 2 One-factor matrix and three-factor structural matrices
| Items | F1 | 3 Factors | ||
|---|---|---|---|---|
| F1 | F2 | F3 | ||
| i1 | 0.628 | 0.499 | 0.452 | 0.868 |
| i2 | 0.729 | 0.685 | 0.383 | 0.695 |
| i3 | 0.697 | 0.638 | 0.348 | 0.754 |
| i4 | 0.467 | 0.414 | 0.324 | 0.456 |
| i5 | 0.621 | 0.528 | 0.793 | 0.532 |
| i6 | 0.628 | 0.530 | 0.975 | 0.526 |
| i7 | 0.608 | 0.512 | 0.369 | 0.762 |
| i8 | 0.662 | 0.716 | 0.202 | 0.488 |
| i9 | 0.760 | 0.776 | 0.348 | 0.589 |
| i10 | 0.781 | 0.779 | 0.450 | 0.592 |
| i11 | 0.862 | 0.891 | 0.473 | 0.609 |
| i12 | 0.844 | 0.868 | 0.551 | 0.563 |
| i13 | 0.846 | 0.868 | 0.485 | 0.598 |
| i14 | 0.583 | 0.644 | 0.228 | 0.363 |
| NI | 14 | 7 | 2 | 5 |
| AVE | 0.494 | 0.634 | 0.790 | 0.519 |
| α | 0.928 | 0.921 | 0.881 | 0.833* |
| CR | 0.930 | 0.923 | 0.881 | 0.839* |
N = 249. Polychoric correlations. Extraction: Weighted least squares. Rotation: Promax. NI = number of factors in boldface, AVE = average variance extracted, α = ordinal alpha coefficient, and CR = composite reliability by McDonald’s omega coefficient. Source: by the authors.
Confirmatory factor analysis
The one-factor model and the models by Silveira et al,(6) Zucoloto et al,(7) and Montero et al(5) were contrasted, as well as the correlated three-factor model derived from AFE.
Following Silveira et al,(6) we specified a hierarchical model of seven factors subordinated to one general model of impact severity. The seven low-order factors were: functional limitation (items 1 and 2), physical pain (items 3 and 4), physical disability (items 5 and 6), psychological distress (items 7 and 8), psychosocial disability (items 9 and 10), social disability (items 11 and 12) and handicap (items 13 and 14) (Figure 1).
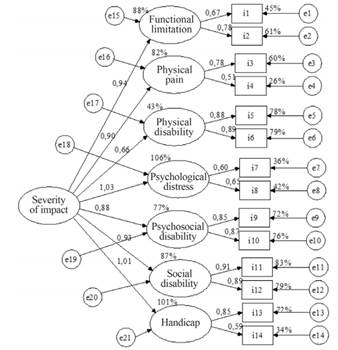
Factors of physical, psychological, and social disability had a high internal consistency (ordinal α of 0.853 to 0.896). However, the factors of functional limitation (ordinal α = 0.689), physical pain (ordinal α = 0.569) and handicap (ordinal α = 0.663) had a low internal consistency, and the psychological discomfort factor had a very low internal consistency (ordinal α = 0.563). Six of the 21 relations among the seven factors did not show discriminant validity by the analysis of the heterotrait-homotrait correlations. The parsimony of the model was high (PR = 0.769), but it had a non-acceptable solution. The weight of the overall factor on the factors of physical discomfort and handicap was greater than 1 (Figure 1).
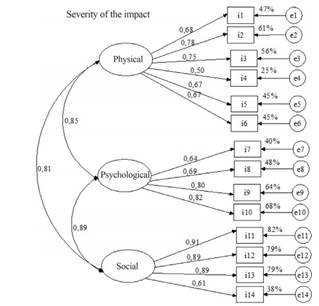
Following Zucoloto et al,(7) a hierarchical model of three higher-order correlated factors and seven lower-order factors was specified. The factors of functional limitation, physical pain and physical disability were organized hierarchically to the physical impact factor; the factors of psychological discomfort and psychosocial disability to the psychosocial impact factor; and the factors of social disability and handicap to the social impact factor. The parsimony of the model was high (PR = 0.813), but it had a non-acceptable solution. The correlations among the three higher-order factors ranged from very high (> 0.80) to unitary (≥ 0.90), showing lack of discriminant validity.
As an alternative model, we specified one of three interrelated factors: physical impact (items 1, 2, 3, 4, 5 and 6), psychosocial impact (items 7, 8, 9 and 10) and social impact (items 11, 12, 13 and 14). The physical impact factor (PI) had a high internal consistency (ordinal α = 0.839) and showed convergent validity (AVE = 0.465 and CR = 0.837), but lacked discriminant validity with respect to the other two factors (AVE = 0.465 < = r2 IFyIS = 0.651 and r2 IFyIS = 0.651). The psychosocial impact factor (PSY) also had high internal consistency (ordinal α = 0.830) and convergent validity (AVE = 0.551 and CR = 0.829), but it lacked discriminant validity with respect to the other two factors (r2 IPyIF = 0.714 and r2 IPyIS = 0.790). The social impact factor had high internal consistency (ordinal α = 0.891), convergent validity (AVE = 0.696 and CR = 0.899) and discriminant validity with respect to the physical impact factor (r2 ISyIF = 0.650), but not with respect to the psychosocial impact (r2 ISyIP = 0.790). The heterotrait-homotrait correlations analysis showed that the physical impact factor did not have discriminant validity with respect to the psychological impact (HTMT = 0.851), but it did regarding the social impact (HTMT = 0.804).
The psychological and social impact factors had no discriminant validity between each other (HTMT = 0.904). The model fit was good for five indices and acceptable for one (table 3 and figure 2).
Table 3 Indices of fit and parsimony of models with admissible solutions
| Indices | Interpretation | Models | ||||
|---|---|---|---|---|---|---|
| Good | Adequate | 3F_Zuc. | 1F | 1F_Mod | 3F_AFE | |
| χ2 | 141.096 | 179.880 | 135.003 | 71.502 | ||
| gl | 74 | 77 | 76 | 74 | ||
| χ2/gl | ≤ 2 | ≤ 3 | 1.907 | 2.336 | 1.776 | 0.966 |
| RMSD | < 0.08 | < 0.10 | 0.074 | 0.083 | 0.072 | 0.052 |
| GFI | ≥ 0.95 | ≥ 0.90 | 0.981 | 0.976 | 0.982 | 0.990 |
| AGFI | ≥ 0.90 | ≥ 0.85 | 0.973 | 0.967 | 0.975 | 0.986 |
| NFI | ≥ 0.95 | ≥ 0.90 | 0.975 | 0.968 | 0.976 | 0.985 |
| RFI | ≥ 0.95 | ≥ 0.90 | 0.969 | 0.962 | 0.971 | 0.982 |
| PR | ≥ 0.75 | ≥ 0.50 | 0.813 | 0.846 | 0.835 | 0.813 |
Matrix of polychoric correlations. Method: Weighted least squares. Models: 3F_Zuc.: psychosocial impact (items 2, 8, 9, 10, 11, 12, 13 and 14), physical impact (items 1, 3, 4 and 7) and physical disability (items 5 and 6). 1F: an overall factor with 14 indicators. 1F_Mod: one factor with correlation among the remains of items 5 and 6. 3F_AFE: psychosocial impact (items 8, 9, 10, 11, 12, 13 and 14), physical disability (items 5 and 6) and physical impact (items 1, 2, 3, 4 and 7). Source: by the authors.
Following Montero et al,(5) a model of three interrelated factors was specified: psychosocial impact (items 5, 6, 9, 10, 11, 12, 13 and 14), pain/discomfort (items 3, 4, 7 and 8) and functional limitation (items 1 and 2). The internal consistency of the psychosocial impact factor was very high (ordinal α = 0.913) and the discomfort/ pain factor was acceptable (ordinal α = 0.718), but the functional limitation factor was low (ordinal α= 0.689). The analysis of heterotrait-homotrait correlations showed that the factors of functional limitation and psychosocial impact had discriminant validity between each other (HTMT = 0.801), but the factor of physical pain/discomfort lacked discriminant validity with respect to functional limitation (HTMT = 0.997) and psychosocial impact (HTMT = 0.930). The parsimony of the model was high (PR = 0.813), but the solution was not admissible. The correlation between the factors of pain/discomfort and functional limitation was finally outside its potential range (r = 1.102, 95% CI: [1.031, 1.187]).
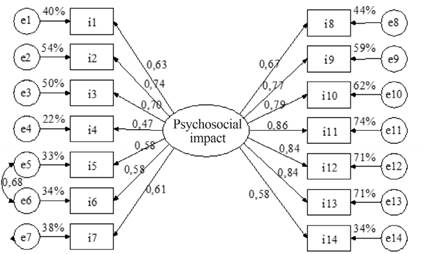
Based on the results of the AFE, and following Mello dos Santos et al,(3) a model of an overall factor with 14 indicators was specified. The parsimony was high (PR = 0.846) and the solution was acceptable. The factor showed convergent validity (AVE = 0.493 and RC = 0.930). The model fit was good for four indices and adequate for four (Table 3). After reviewing the matrix of residuals, one parameter was freed: the correlation between residual measurement of items 5 and 6, thus improving fit (Δχ2/Δgl = 44.877, ΔNFI = 0.008 and ΔRFI = 0.009). In this modified model, the fit was good for all six indices, and parsimony was high (PR = 0.835). In addition, the unique factor showed convergent validity (AVE = 0.490 and CR = 0.929) (Table 3 and Figure 3).
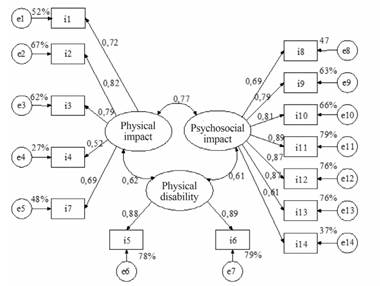
Based on the results from the AFE, a model of three interrelated factors was specified. The parsimony was high (PR = 0,813) and the solution was acceptable. The factor of physical impact showed convergent (AVE = 0.512 and CR = 0.837) and discriminant validity with respect to physical disability (r2 IFy DP = 0.373), but not regarding psychosocial impact (r2 IFy IP = 0.587). The psychosocial impact factor had convergent (AVE = 0.634 and CR = 0.925) and discriminant validity with respect to the other two factors (AVE = 0.634 > r2 IPy IF = 0.587 and r2 DFy IP = 0.373). The physical disability factor also showed convergent (AVE = 0.787 and CR = 0.881) and discriminant validity with respect to the other two (AVE = 0.787 > r2 DFy IF = 0.373 and r2 DFy IP = 0.386). The fit was good for all six indices (table 3 and figure 4). Heterotrait-homotrait correlations analysis showed that the physical impact factor had discriminant validity with respect to physical disability (HTMT = 0.575) and psychosocial impact (HTMT = 0.698); in addition, the factors of physical disability and psychosocial impact had discriminant validity between each other (HTMT = 0.602).
DISCUSSION
The main objective of this study was to assess the distribution, discriminability, and internal consistency of the items and total score of the OHIP-14-PD. In this sample of dental patients, the most frequent median among the items was 2, corresponding to “occasionally”, which means that the impact of periodontal problems is occasional. Nearly two thirds of the 14 ordinal items had asymmetry in distribution, and the five items that had symmetrical distributions showed light kurtosis. As a result, they deviated from both the univariate and multivariate normal distribution, as happened in previous studies.(6,7) According to the expectation in other studies,(7,18) the 14 items complied with the property of discriminability, and 13 with internal consistency. Item 4, on sensitivity of teeth to cold and heat, with negative asymmetry and flat distribution, had a weak internal consistency. These data show that this is the least consistent symptom in periodontal pathology, and that it may apply to other situations, such as the presence of caries, enamel wear by improper brushing, teeth whitening or consumption of acid foods.(19) The total scale score did not have a normal distribution either, so it must be interpreted using population percentiles. The mean in the present sample of 249 patients (M = 18.01, 95% CI: [16.62, 19.40]) was significantly lower than that of a sample of 407 Chilean patients with orofacial pain and temporomandibular disorders (M = 20.57, 95% CI: [19.52, 21.62]),(20) but was equivalent to that of a non-clinical sample of 763 Brazilian teenagers (M = 15.6, 95% CI: [10.4, 22.8]).(6) This equivalence, coupled with the most frequent median of the items, indicates that the central tendency of the impact of the oral condition is low.
Regarding the second objective, the OHIP-14-PD showed discriminant validity to differentiate between periodontal and gingivitis patients. The mean of the former (M = 20.39, 95% CI: [18.60, 22.18]) is equivalent to patients with painful syndromes,(20) and the mean of the latter (M = 14.54, 95% CI: [12.49, 16.59]) is equivalent to the general population of adolescents,(6) in accordance with the fact that periodontitis produces more disability, handicap, and pain than gingivitis,(21) thus proving the validity of the scale. In addition, it shows that gingivitis diagnosed during routine consultation for prophylactive dental treatment does not affect the patients’ quality of life.
The third objective was to explore the factor structure of OHIP-14-PD. The data supported two models. On the one hand, the one-factor model was supported by Horn’s parallel analysis, optimal coordinates, and acceleration factor. This had previously been discussed by Mello dos Santos et al(3) and underlies the overall factor of higher-order of Silveira et al’s model.(6) This factor had convergent validity and a very high internal consistency, as in a study in Chilean older adults.(22) It should be noted that the internal consistency values higher than 0.90 are arguments in favor of a univariate model.(23) On the other hand, a three-factor model was supported by the minimum mean of partial correlations both squared and to the fourth power, as well as by Kaiser’s criterion. In comparison with the three previous criteria, these have a lower capacity to detect the true number of factors.(11) The trifactorial model yielded a first factor of psychosocial impact with very high internal consistency and convergent and discriminant validity. The second factor of symptoms such as bad odor and mouth taste corresponded to the factor Slade called physical disability.(2) It had high internal consistency, convergent and discriminant validity, but was finally composed of two items, which is an insufficient number of indicators.(10) The third factor was called physical impact because of its content of swelling, bleeding, painful gingiva, and sensitive teeth. It also showed convergent and discriminant validity, and high internal consistency. This solution of three factors differs from that reported by Montero et al(5) and from the three higher-order factors of the hierarchical model by Zucoloto et al.(7) The internal consistency of the third factor improved by removing item 4, which is the weakest in internal consistency within the scale, but the removal of this item did not lead to an improvement in overall factor, and in this factor it reached its highest factorial weight; therefore, the inclusion of item 4 is better validated in the one-factor model.
The fourth objective was to contrast four factorial models previously formulated for the OHIP-14, as well as the derivatives of AFE, in addition to studying the factors’ internal consistency and convergent and discriminant validity.
The hierarchical models by Montero et al,(5) Silveira et al(6) Zucoloto et al,(7) and the seven correlated factors model by Slade,2 which has one or more factors with only two indicators, had unacceptable solutions, in addition to problems of internal consistency and convergent validity in some of their factors, as well as problems of discriminant validity among factors, either by the criterion of heterotrait-monotrait correlations or by the Fornell-Larcker criterion (AVE and AVE > r2 ). These problems are repeated using the other five options to estimate the role of discrepancy offered by AMOS. Therefore, these would be disposable models.
In an attempt to find a better specification of the model by Zucoloto et al,(7) one of three correlated factors was defined from the three higher-order factors and by eliminating the seven lower-order factors. This allowed achieving an acceptable, well-fitted solution. However, the problem of lack of discriminant validity among factors, evidenced by the hierarchical model, was once again there, especially among the factors of psychological and social impact. In addition, the physical impact factor showed weaknesses of convergent validity. The problem of discriminant validity was not only supported by the Fornell-Larcker’s criterion, but also by the analysis of heterotrait-monotrait correlations, with the emergence of shared variances higher than three quarters. Therefore, it would be a bad model.
The one-factor model with all its independent residuals derived from the AFE is consistent with the one proposed by Mello dos Santos et al(3) in Brazilian population. This model was the one with the most parsimony; its AVE was very close to 50% and its composite reliability was higher than 0.90, so it can be said that it showed convergent validity. The internal consistency of the 14 items was very high and did not improve by removing some of them. Its fit was good for five indices and adequate for two. A correlation between the residuals of items 5 and 6 yielded a good fit for the six indices and kept a parsimony higher than that of the other models. The high correlation among the residuals of items 5 and 6 reveals the underlying factor including the items on bad odor and mouth taste emerging from the trifactorial solution. This factor already appeared in the initial model of the scale,(2) in a study with a sample in an Australian community, which was later taken again and validated by Silveira et al (using a sample from a community of Brazilian adolescents)(6) and Zucoloto et al,(7) (using a dental clinic sample of Brazilian young adults). Therefore, it seems to be that these symptoms are perceived as a specific and distinctive problem by survey respondents in different countries, and need to be highlighted specifically within the one-factor model among Mexican dental patients.
Although the trifactorial model derived from the AFE had convergent and discriminant validity, high parsimony, and good fit, the physical disability factor had an insufficient number of indicators, which is a critical limitation. It is important to point out that the functional limitation factor, which stands out in the study by Montero et al,(5) had a low internal consistency in the present study and was not configured in isolation, showing that including factors with limited indicators is difficult to replicate and can produce solutions that are not admissible in other populations. Hence, it may be more practical to define the relationship between items 5 and 6 as a possible modification to the onefactor model than as an isolated factor.
A limitation of the present study is the use of nonprobabilistic sampling, so the results cannot be generalized as parametric estimates. The results are useful to clarify the factor structure and the internal consistency of the OHIP-14-PD factors. As strengths of this study, the use of a large sample should be noted (more than seven participants per parameter to estimate the models) and analysis techniques suitable to the ordinal nature of the variables.
In conclusion, the items had properties of discriminability and internal consistency, although item 4 showed weakness in this last property, and therefore its inclusion is better validated in the onefactor model. The internal consistency of the 14 items was very high, and the distribution of the scale had positive skewness and kurtosis, not complying with a normal distribution. The scale had discriminant validity to differentiate periodontitis and gingivitis patients. The hierarchical models by Montero et al,(5) Silveira et al(6) and Zucoloto et al(7) are discarded by inadmissible solutions in the sample. Even the model by Zucoloto et al,(7) re-specified as one of three interrelated factors, is dismissed by a problem of discriminant validity between the three factors. The three-factor model derived from the AFE presented good properties and is supported by Velicer’s analysis and Kaiser’s criterion, with the disadvantage that the physical disability factor has two indicators that are an insufficient number to define the model to measure a factor. The one-factor model was supported by the stronger criteria for determining the number of factors, had the highest parsimony and internal consistency and showed convergent validity. In conducting a correlation between two measure residuals (items 5 and 6), it turned out to be the one with the most parsimony and perfect fit. With this interpretable correction, the physical disability factor is more appropriately handled, as it stands as a correlation between two measure residuals. The univariate model is therefore considered the most appropriate model.
The use of the OHIP-14-PD is recommended as a one-dimensional measure, suggesting its interpretation by percentile scores due to the lack of normality in its distribution. It is also suggested to replicate this study with probabilistic samples in Mexico and other countries, studying its concurrent validity in relation to oral hygiene habits and socio-demographic variables, contrasting its cross validity between a dental clinical sample and a general population sample including people who have never had periodontal problems, setting a breakpoint between these two populations.

