


 English (pdf)
 Article in xml format
 Article references
 Send this article by e-mail
 Cited by SciELO
  Cited by Google
  Similars in
SciELO
Similars in
SciELO  Similars in Google
 Permalink
INTRODUCTION
Many studies report differences in craniofacial proportions by analyzing lateral cephalic radiographs in samples from different populations, suggesting the application of cephalometric standards according to population, age, and gender.1 In Latin America, the studies have demonstrated cephalometric differences from standards based on Caucasian populations in both hard and soft tissues,2-3 and it can be said that each population has craniofacial structures with special conformations, some of which are very similar.
Since 1970, cephalometric research has been conducted in populations with longitudinal, cross-sectional and mixed studies,4-6 achieving standards widely spread in the literature with relevant data such as growth rate, growth parameters, and characterization. The classification of facial morphology and its relationship to ethnic identification has been highly researched worldwide, and it can be concluded that the craniofacial conformation studied by means of cephalometric radiographs is appropriate to classify ethnic groups.7,8
The present study aims to characterize a Colombian mestizo population aged 6 to 12 years in the city of Medellin, by means of lateral cephalic radiographs, using some specific sagittal and vertical measurements.
METHODS
The sample was taken from the Center of Craniofacial Growth and Development of the Universidad de Antioquia’s School of Dentistry, which has a sample of more than 20,000 patients as a result of the implementation of the Preventive and Interceptive Orthodontics Program through participatory budget of Medellin’s Secretariate of Health between 2009 and 2014. The inclusion criteria were non-syndromic patients with radiographs free of technical, developing or printing failures. This study analyzed 1,627 cases of patients with no prior treatment and who by the time of the study had digital images. The sample included 855 males and 772 females aged 6 to 12 years.
Each patient was taken a lateral cephalic radiograph prior to treatment, using an orthopantomograph x-ray equipment from the selected diagnostic centers and the following parameters: 77 KV, 12 mA, object focus distance 1.50 meters, exposure time 0.5 seconds, Fuji Film films (Fuji photo film Co, Japan)R of 8 X 10 cm. Parallelism between the Frankfurt plane and the floor was verified using the mirror method and checking the correct location of the pins in the external ear canals. The magnification obtained with the equipment was 8 to 14%, the radiographs were processed into an Air Technique 2000 plus automatic film processor.
The radiographs were scanned on Epson Perfection® V 800 Photo/V850 PRO, capturing images with Silverfast 8 software, which contains the Workflow Pilot tool, which guides the correct order through all the necessary steps for the work to be performed.
Once a radiograph is scanned, it is verified to be 1 to 1 by measuring the base of the skull on the x-ray and the computer and is stored in jpg format. Once an X-ray image was digitized, the VistaDent 2.0 software® was used to do the cephalometric tracing by the same person (DQ) calibrated in this procedure. Once the anatomical points were located, the software requires scaling by matching the rule presented by the radiographs with the actual value that it must have; this ensures that all x-rays have the same magnification so that linear measurements are standardized.
Using 10% of the sample, intra- and inter- examiner concordance was determined with an intraclass correlation coefficient greater than 80% on the location of cephalometric points on cephalic x-rays. The intraclass correlation coefficient or Bland-Altmand method was used, where the average difference between two measures is “0” and 95% of the differences are within 1.96 of the standard deviations of that average.
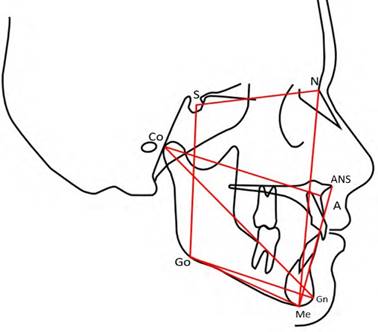
The plot was done using the parameters of Riolo’s Atlas,4 including the following anatomical points: Sella (S), Nasion (N), Gonion (Go), Gnathion (Gn), Condylion (Co), A Point (A), Anterior Nasal Spine (ANS) and Menton (Me); taking longitudinal measurements in millimeters (mm) for the following distances:
Anterior Nasal Spine (ANS) to Menton (Me), evaluating Lower Anterior Facial Height (LAFH)
Distance from Nasion (N) to Menton (Me), evaluating Anterior Facial Height (AFH)
Distance from Sella (S) to Gonion (Go), evaluating Posterior Facial Height (PFH)
Distance from Condylion (Co) to Gnathion (Gn), evaluating mandibular length
Distance from Condylion (Co) to A Point (A), evaluating maxillary length
Distance from Gonion (Go) to Gnathion (Gn), evaluating mandibular body length
Distance from Sella (S) to Nasion (N), evaluating anterior skull base length.
A measurement was taken in degrees for the angle formed by the following planes: Sella (S) - Nasion (N) - anterior skull base, and Gonion (Go) - Gnathion (Gn) - Mandibular Plane (MP), evaluating mandibular plane inclination (Figure 1). All data were consolidated and processed into an Excel Microsoft® 2010 spreadsheet.
RESULTS
It was found that anteroinferior facial height (AFH-Me) increases with age in both men and women, being higher from the earliest years in males. In females, the average is 54.6 mm at age 6 and 59.5 mm at age 12, while in males the average is 55.7 mm at age 6 and 65.1 mm at 12 years of age (Table 1, Figure 2).
Table 1 Anteroinferior Facial Height (AFH-Me) in millimeters from the Anterior Nasal Spine to Menton (ANS-Me) in males and females aged 6 to 12 years
| Age | N | Female | Male | P-value | |||||||
|---|---|---|---|---|---|---|---|---|---|---|---|
| X | SD | Min | Max | N | X | SD | Min | Max | |||
| 6 | 50 | 54.6 | 4.9 | 45.9 | 76.4 | 62 | 55.7 | 4.0 | 48.2 | 69.5 | 0.194 |
| 7 | 110 | 54.9 | 4.8 | 46.1 | 75.5 | 114 | 56.5 | 4.6 | 45.9 | 74.2 | 0.010* |
| 8 | 207 | 55.2 | 4.4 | 46.3 | 72.9 | 216 | 56.7 | 3.9 | 45.2 | 70.1 | 0.000*** |
| 9 | 200 | 55.9 | 4.4 | 45.3 | 70.1 | 202 | 57.7 | 5.1 | 47.1 | 83.4 | 0.000*** |
| 10 | 135 | 57.4 | 5.4 | 42.7 | 70.1 | 164 | 58.2 | 4.9 | 42.9 | 72.4 | 0.173 |
| 11 | 65 | 57.2 | 4.4 | 45.7 | 66.5 | 91 | 59.1 | 4.8 | 47.0 | 70.5 | 0.013* |
| 12 | 5 | 59.5 | 2.9 | 55.4 | 63.5 | 6 | 65.1 | 4.0 | 60.3 | 71.3 | 0.028* |
* p<0.05 ** p<0.01 *** p<0.0001
Source: by the authors
Source: by the authors
Figure 2 Distance of Anterior Nasal Spine (ANS) to Menton (Me) in millimeters (ANS- Me) in males and females aged 6 to 12 years. Y axis: measurement in millimeters (mean). X axis: age in years
It was found that Anterior Facial Height (AFH) measured from Nasion (N) to Menton (Me) increases with age in both males and females and is higher in males. In females, the average is 92.3 mm at age 6 and 104 mm at age 12; in males, the average is 93.8 mm at age 6 and 110.5 mm at 12 years of age (Table 2, Figure 3).
Table 2 Anterior Facial Height (AFH) measured in millimeters from Nasion to Menton (N-Me) in males and females aged 6 to 12 years
| Age | N | Female | Male | P-value | |||||||
|---|---|---|---|---|---|---|---|---|---|---|---|
| X | SD | Min | Max | N | X | SD | Min | Max | |||
| 6 | 50 | 92.3 | 7.0 | 74.5 | 121.6 | 62 | 93.8 | 5.8 | 80.8 | 113.2 | 0.217 |
| 7 | 110 | 93.9 | 6.7 | 79.2 | 127.3 | 114 | 96.1 | 6.4 | 79.5 | 126.1 | 0.013* |
| 8 | 207 | 95.0 | 6.4 | 78.5 | 125.9 | 216 | 97.1 | 5.8 | 82.5 | 115.9 | 0.000*** |
| 9 | 200 | 97.0 | 6.4 | 81.9 | 120.6 | 202 | 99.5 | 7.4 | 81.6 | 141.6 | 0.000*** |
| 10 | 135 | 99.7 | 7.5 | 78.6 | 131.1 | 164 | 100.6 | 6.8 | 79.2 | 124.7 | 0.278 |
| 11 | 65 | 99.9 | 6.3 | 84.0 | 112.5 | 91 | 102.3 | 7.5 | 85.0 | 127.1 | 0.036* |
| 12 | 5 | 104.0 | 2.6 | 100.3 | 107.3 | 6 | 110.5 | 7.7 | 99.1 | 122.9 | 0.109 |
*p<0.05 ** p<0.01 *** p<0.0001
Source: by the authors
Source: by the authors
Figure 3 Distance of point N (Nasion) to Me (Menton) in millimeters (N-Me) in male and female aged 6 to 12 years. Y axis: measurement in millimeters (mean). X axis: age in years
It was found that Posterior Facial Height (PFH) measured from Sella (S) to Gonion (Go) increases with age in both males and females and is larger in males since the earliest years and with a constant trend over time. In females, the average is 58.2 mm at age 6 and 65 mm at age 12; in males, the average is 59.6 mm at age 6 and 69.1 mm at 12 years of age (Table 3, Figure 4).
Table 3 Posterior Facial Height (PFH) in millimeters from Sella to Gonion (S-Go) in males and females aged 6 to 12 years
| Age | N | Female | Male | P-value | |||||||
|---|---|---|---|---|---|---|---|---|---|---|---|
| X | SD | Min | Max | N | X | SD | Min | Max | |||
| 6 | 50 | 58.2 | 4.9 | 47.9 | 76.7 | 62 | 59.6 | 4.3 | 52.1 | 72.2 | 0.102 |
| 7 | 110 | 59.4 | 5.6 | 46.9 | 84.7 | 114 | 60.7 | 4.5 | 49.1 | 77.0 | 0.047* |
| 8 | 207 | 60.9 | 4.8 | 49.1 | 75.7 | 216 | 62.2 | 4.5 | 46.3 | 74.3 | 0.006** |
| 9 | 200 | 62.2 | 4.9 | 49.8 | 75.8 | 202 | 64.0 | 5.6 | 45.7 | 92.4 | 0.001** |
| 10 | 135 | 63.9 | 5.6 | 49.6 | 87.8 | 164 | 64.4 | 4.9 | 52.4 | 81.6 | 0.393 |
| 11 | 65 | 64.6 | 5.1 | 52.7 | 81.0 | 91 | 66.3 | 6.0 | 51.9 | 84.7 | 0.063 |
| 12 | 5 | 65.0 | 2.7 | 60.7 | 67.8 | 6 | 69.1 | 5.2 | 62.4 | 76.9 | 0.148 |
*p<0.05 ** p<0.01 *** p<0.0001
Source: by the authors
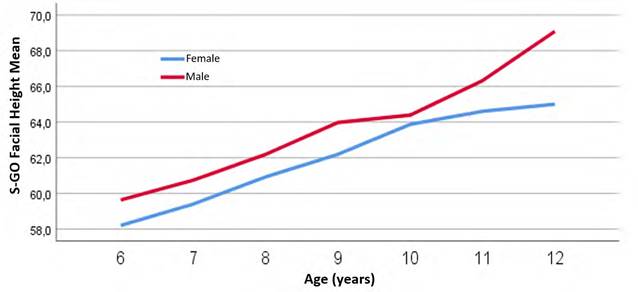
Figure 4 Distance of point S (Sella) to Go (Gonion) in millimeters (S-Go) in males and females aged 6 to 12 years. Y axis: measurement in millimeters (mean). X axis: age in years
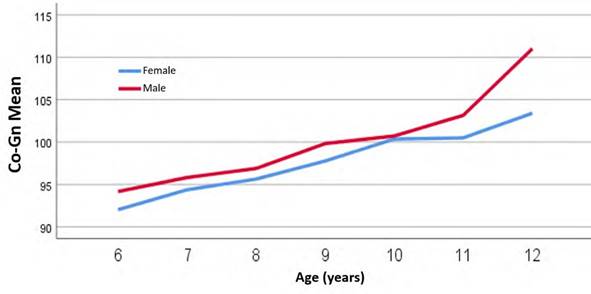
The maxillary and mandibular measurements show similar behavior: these increase with age and there are differences between males and females, with values being larger in males; in females, the effective mandibular length Condylion (Co) to Gnathion (Gn) averages 92 mm at age 6 and 103.4 mm at age 12 years, while males have an average of 94.2 mm at age 6 and 111 mm at 12 years of age (Table 4, Figure 5).
Table 4 Effective mandibular length (Co-Gn) in millimeters from Condylion to Gnathion (Co-Gn) in males and females aged 6 to 12 years
| Age | N | Female | Male | P-value | |||||||
|---|---|---|---|---|---|---|---|---|---|---|---|
| X | SD | Min | Max | N | X | SD | Min | Max | |||
| 6 | 50 | 92.0 | 5.5 | 83.0 | 116.0 | 62 | 94.2 | 5.8 | 81.0 | 111.0 | 0.049* |
| 7 | 110 | 94.4 | 6.7 | 81.0 | 127.0 | 114 | 95.8 | 5.4 | 85.0 | 120.0 | 0.078 |
| 8 | 207 | 95.6 | 5.7 | 83.0 | 120.0 | 216 | 96.9 | 5.7 | 81.0 | 118.0 | 0.024* |
| 9 | 200 | 97.8 | 6.0 | 82.0 | 121.0 | 202 | 99.8 | 7.1 | 84.0 | 139.0 | 0.002** |
| 10 | 135 | 100.3 | 6.7 | 78.0 | 132.0 | 164 | 100.7 | 5.8 | 83.0 | 121.0 | 0.615 |
| 11 | 65 | 100.5 | 5.9 | 86.0 | 116.0 | 91 | 103.2 | 7.8 | 90.0 | 130.0 | 0.022* |
| 12 | 5 | 103.4 | 5.4 | 99.0 | 111.0 | 6 | 111.0 | 11.2 | 101.0 | 131.0 | 0.199 |
*p<0.05 ** p<0.01 *** p<0.0001
Source: by the authors
Source: by the authors
Figure 5 Distance from point Co (Condylion) to Gn (Gnathion) in millimeters (Co-Gn) in males and females aged 6 to 12 years. Y axis: measurement in millimeters (mean). X axis: age in years
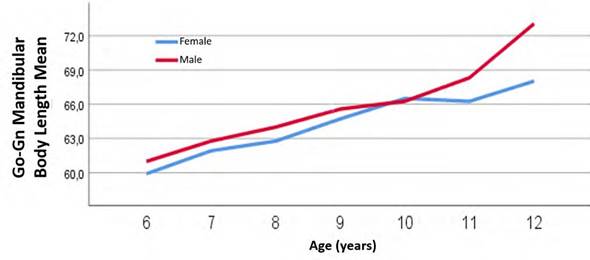
Concerning the mandibular body Gonion (Go) to Gnathion (Gn), it was found that it increases with age in both males and females, being larger in males since the earliest years, and this trend continues over the years. The average in females is 59.9 mm at age 6 and 68 mm at age 12. In males, 61 mm at age 6 and 73.1 mm at age 12 (Table 5, Figure 6).
Table 5 Mandibular body length from Gonion to Gnathion in millimeters (Go-Gn) in males and females aged 6 to 12 years
| Age | N | Female | Male | P-value | |||||||
|---|---|---|---|---|---|---|---|---|---|---|---|
| X | SD | Min | Max | N | X | SD | Min | Max | |||
| 6 | 50 | 59.9 | 4.3 | 50.1 | 74.2 | 62 | 61.0 | 4.8 | 52.9 | 73.9 | 0.219 |
| 7 | 110 | 61.9 | 5.0 | 49.0 | 83.3 | 114 | 62.8 | 4.6 | 51.6 | 81.3 | 0.184 |
| 8 | 207 | 62.8 | 4.4 | 54.5 | 81.1 | 216 | 64.0 | 4.6 | 53.0 | 79.3 | 0.005** |
| 9 | 200 | 64.7 | 4.6 | 51.9 | 82.7 | 202 | 65.6 | 5.5 | 51.9 | 89.6 | 0.090 |
| 10 | 135 | 66.5 | 5.0 | 54.0 | 84.8 | 164 | 66.3 | 4.3 | 56.0 | 78.1 | 0.648 |
| 11 | 65 | 66.3 | 4.5 | 57.1 | 78.9 | 91 | 68.3 | 6.1 | 58.0 | 89.1 | 0.021* |
| 12 | 5 | 68.0 | 2.8 | 64.9 | 71.6 | 6 | 73.1 | 8.2 | 66.3 | 87.6 | 0.227 |
*p<0.05 ** p<0.01 *** p<0.0001
Source: by the authors
Source: by the authors
Figure 6 Distance from point Go (Gonion) to Gn (Gnathion) in millimeters (Co-Gn) in males and females aged 6 to 12 years. Y axis: measurement in millimeters (mean). X axis: age in years
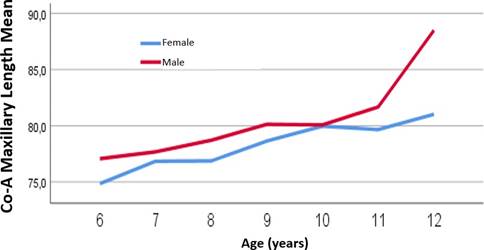
As for the maxillary Condylion (Co) to A Point (A), it was found that it increases with age in the entire population, being larger in males since the earliest years. In females, the average is 74.8 mm at age 6 and 81 mm at age 12. Males have an average of 77.1 mm at age 6 years and 88.5 mm at 12 years of age (Table 6, Figure 7).
Table 6 Effective maxillary length (Co-A). Distance from Condylion to A Point in millimeters (Co-A) in females and males aged 6 to 12 years
| Age | N | Female | Male | P-value | |||||||
|---|---|---|---|---|---|---|---|---|---|---|---|
| X | SD | Min | Max | N | X | SD | Min | Max | |||
| 6 | 50 | 74.8 | 4.9 | 68.3 | 96.3 | 62 | 77.1 | 4.7 | 66.8 | 92.7 | 0.017* |
| 7 | 110 | 76.8 | 5.4 | 66.5 | 97.9 | 114 | 77.7 | 4.7 | 65.9 | 96.7 | 0.210 |
| 8 | 207 | 76.9 | 4.6 | 66.4 | 93.6 | 216 | 78.7 | 4.2 | 68.7 | 94.0 | 0.000*** |
| 9 | 200 | 78.6 | 4.9 | 64.3 | 95.7 | 202 | 80.1 | 5.6 | 64.0 | 101.4 | 0.005** |
| 10 | 135 | 80.0 | 5.6 | 62.1 | 108.7 | 164 | 80.1 | 4.3 | 67.2 | 94.9 | 0.840 |
| 11 | 65 | 79.7 | 4.6 | 67.6 | 90.9 | 91 | 81.7 | 6.0 | 67.9 | 104.7 | 0.025* |
| 12 | 5 | 81.0 | 2.4 | 77.6 | 83.7 | 6 | 88.5 | 5.8 | 84.1 | 99.5 | 0.025* |
*p<0.05 ** p<0.01 *** p<0.0001
Source: by the authors
Source: by the authors
Figure 7 Distance from point Co (Condylion) to A Point (A) in millimeters (Co-A) in females and males aged 6 to 12 years. Y axis: measurement in millimeters (mean). X axis: age in years
The results of measuring the angle (SN-MP), which relates the vertical dynamics of the skull-mandible complex, decreases with age in both men and women. Females have an average of 35.7 degrees at age 6 and 33.5 at age 11, while males have an average of 35.6 degrees at age 6 and 33.3 at age 11 (Table 7, Figure 8).
Table 7 Mandibular plane angle (SN-MP), measured in degrees of the angle formed by Sella-Nasion planes with the mandibular plane angle (SN-MP) in males and females aged 6 to 12 years
| Age | N | Female | Male | P-value | |||||||
|---|---|---|---|---|---|---|---|---|---|---|---|
| X | SD | Min | Max | N | X | SD | Min | Max | |||
| 6 | 50 | 35.7 | 5.8 | 19.9 | 49.0 | 62 | 35.6 | 5.0 | 25.6 | 49.2 | 0.916 |
| 7 | 110 | 35.1 | 4.9 | 20.7 | 51.2 | 114 | 35.6 | 5.2 | 23.3 | 50.3 | 0.444 |
| 8 | 207 | 34.3 | 5.5 | 21.1 | 47.2 | 216 | 34.1 | 4.5 | 20.7 | 47.1 | 0.808 |
| 9 | 200 | 33.9 | 5.6 | 21.8 | 48.2 | 202 | 34.2 | 5.0 | 18.0 | 51.9 | 0.558 |
| 10 | 135 | 34.2 | 5.6 | 20.6 | 49.9 | 164 | 34.6 | 5.2 | 19.8 | 49.5 | 0.453 |
| 11 | 65 | 33.5 | 5.1 | 22.2 | 43.8 | 91 | 33.3 | 4.9 | 20.6 | 44.2 | 0.867 |
| 12 | 5 | 36.1 | 4.0 | 31.5 | 42.4 | 6 | 35.9 | 4.0 | 32.0 | 43.3 | 0.948 |
*p<0.05 ** p<0.01 *** p<0.0001
Source: by the authors
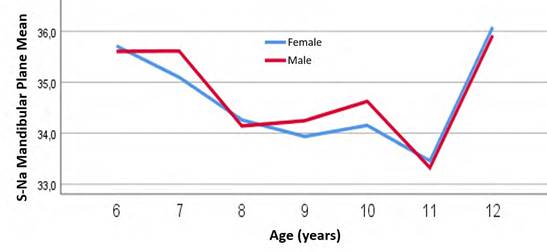
Figure 8 Degrees of the angle formed by the planes of the Sella (S)-Nasion (N) points, anterior skull base and the Gonion (Go)-Gnathion (Gn) points, mandibular plane (SN- MP) in male and female aged 6 to 12 years. Y axis: measurement in millimeters (mean). X axis: age in years
The skull base show higher growth in males than in females (Table 8, Figure 9).
Table 8 Anterior cranial base (SN). Distance from Sella-Nasion (S-N) in millimeters in males and females aged 6 to 12 years
| Age | N | Female | Male | P-value | |||||||
|---|---|---|---|---|---|---|---|---|---|---|---|
| X | SD | Min | Max | N | X | SD | Min | Max | |||
| 6 | 50 | 57.7 | 3.7 | 50.2 | 77.5 | 62 | 59.3 | 4.1 | 52.7 | 71.7 | 0.036* |
| 7 | 110 | 58.8 | 3.7 | 50.4 | 74.9 | 114 | 59.9 | 3.7 | 51.7 | 72.5 | 0.025* |
| 8 | 207 | 58.7 | 3.5 | 50.0 | 73.6 | 216 | 60.5 | 3.5 | 52.3 | 72.2 | 0.000*** |
| 9 | 200 | 59.5 | 3.6 | 49.5 | 74.0 | 202 | 61.2 | 4.4 | 50.1 | 80.2 | 0.000*** |
| 10 | 135 | 60.3 | 4.1 | 49.0 | 79.8 | 164 | 61.3 | 3.8 | 51.8 | 73.1 | 0.019* |
| 11 | 65 | 61.0 | 3.5 | 51.5 | 71.1 | 91 | 62.4 | 4.5 | 50.4 | 78.0 | 0.046* |
| 12 | 5 | 60.7 | 1.3 | 59.0 | 62.5 | 6 | 64.7 | 3.8 | 62.0 | 72.3 | 0.054 |
*p<0.05 ** p<0.01 *** p<0.0001
Source: by the authors
DISCUSSION
The cephalic x-rays of the present study were taken from patients undergoing preventive orthodontic treatments. They represent a sample with all possible variations such as: craniofacial conformations, age, ethnicity, sex, progeny, and racial mixtures established in a city. The sample was collected between 2012 and 2017.
This study describes the growth of some craniofacial structures in a Colombian mestizo population aged 6 to 12 years through cephalometric evaluation in a cross- sectional study. The results suggest some similarities and differences compared to other longitudinal studies.9-11
Some studies focus on the craniofacial characteristics of populations in America. In comparing measurements between indigenous peoples from Guatemala12 and Brazil,13 studies conducted at the University of Michigan,4 U.S. Afro-descendants14 and studies in Colombian population,11 we find out that the Colombian mestizo population aged 6 to 12 years show a different behavior, so that:
In our population, the lower anterior facial height (AFH-Me) and anterior facial height (Na-Me) have lower values in both male and female subjects when compared to the study conducted at the University of Michigan,4 with an increase in anterior vertical dimensions in our population aged 6 to 12 years and higher height values in males. This agrees with the studies by Bjork and Skieller,15 who used mini-implant methods to show reabsorption in the nasal area and apposition of the maxillary, as an indication of increase in anterior facial height (AFH).
The posterior facial height (PFH) (S-Go) shows fewer differences when compared to studies in other populations,14 maintaining the pattern of differences established between AFH and PFH, but very similar AFH values to those of the indigenous population from Guatemala.12 When evaluating the angle of the mandibular plane (Go-Me) with the (S-N) plane, the values are very similar, showing growth compensation, possibly due to the eruption of the upper and lower posterior dentoalveolar complex, which could influence AFH in our population. This dynamic is observed in the craniofacial growth patterns of healthy patients, as stated in studies linking dentoalveolar changes to facial height in early ages, as well as studies on mandibular growth and rotation using mini-implants.16,17 Dentoalveolar height increases from the age of 10 years, which shows the high correlation with various changes in growth of anterior facial height (AFH) and posterior facial height (PFH).18
When evaluating the mandibular plane angle (Go-Me) with the (S-N) plane, a peak in values can be observed between the ages of 11 and 12 years, which may be due to the reduced number of cases evaluated at this age, and mainly occurs in patients with increased AFH; this is different from the behavior of this measure in the general population, in which it decreases over the course of life.19
The maxillomandibular measurements evaluated in the anteroposterior plane show the same growth tendency in maxilla and mandible between the ages of 6 and 12 years, with no growth peaks, unlike other studies that do report peaks. This can be explained because of sample size or the methodology of cross-sectional studies.4,6,16
The mandibular body (Go-Me) shows a steady increase in size, which is very similar to studies in North American populations. This part of the mandible responds to growth changes in other areas such as the condyle and hence a very steady growth.4,14
The skull base in the studied population is smaller in size compared to other populations,4,6,9,10,19 showing the most similarities with the Guatemalan sample.12 This should be considered when making sagittal diagnoses using the skull base as a reference.
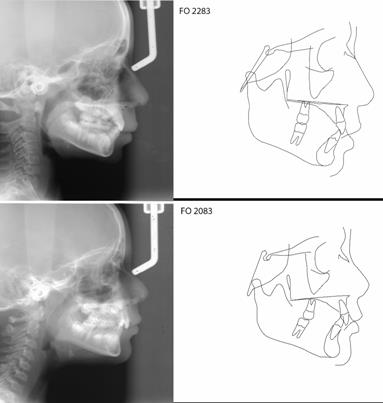
The research individuals in the present study have similar patterns to those of the Guatemala12 and Michigan4 samples, with noticeable individual variations within each population, and extreme cases of craniofacial biometrics in our population. Growth expresses differently in each individual, with bone maturation and growth peaks in some individuals occurring at an early age and with compensation for the entire craniofacial system.20 In our sample, we observed the x-rays of two cases of patients with hypodivergent growth and two hyperdivergent cases, as in Figures 10 and 11.
Source: by the authors
Figure 10 Lateral cephalic x-rays and cephalometric tracing of two hypodivergent patients aged 9 and 10 years, male and female respectively
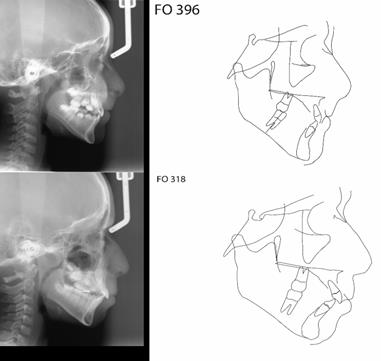
Figure 11 Lateral cephalic x-rays and cephalometric tracing of two hyperdivergent patients aged 8 and 10 years, male and female respectively
When compared with samples from European countries, we find similarities in that larger values are found in males compared to females; also, craniofacial growth patterns are similar, with differences in sagittal dimensions as well as mandibular plane angle,9,10,21 which are lower for our population. These differences in craniofacial dimensions in the vertical plane occur at the expense of mandible rotation and anteroposterior displacement of the condyle. Studies with mini-implants by Bjork et al16 show possible individual patterns of mandible rotation and growth, with a ratio of the rectilinear displacement of the mandible, with chin projection and vertical condyle growth, either posterior or anterior.
Several studies have reported early fluctuations in growth before the age of twelve.11,19,22-24 Finding these peak periods or growth acceleration increases is important to establish early and effective treatment protocols. Various studies have reported samples with annual increases ranging from 3 to 8 mm in vertical changes (AFH), with these increases showing greater percentages in females, since as reported in the literature, the growth peak occurs approximately 2 years earlier in female. These increments are a combination of dentoalveolar changes, skeletal rotations, and linear increments.
CONCLUSION
The results of the present study show that craniofacial development varies in maxillary and mandibular size with age and gender, with a linear growth of the studied structures between the ages of 6 and 12; sexual dimorphism is very hard to find in this age range, but a larger size is generally observed in males, expressing itself in a larger mandible size and a higher vertical growth, with mandible rotations in each specific case. Craniofacial growth and its classification at ages 6 to 12 is clinically relevant.
Growth peaks were found in the studied population between the ages of 11 and 12, with indications of vertical dominance.
In general, craniofacial distances were consistently greater in males than in females, with the same dynamics at all ages.
Knowing how changes occur in some of the craniofacial structures in our population helps us understand their dynamics over time and thus provide ideal treatments for each case.

