


 English (pdf)
 Article in xml format
 Article references
 Send this article by e-mail
 Cited by SciELO
  Cited by Google
  Similars in
SciELO
Similars in
SciELO  Similars in Google
 Permalink
Introduction
For centuries, the irrigation has been one of the activities preferred by humanity for increasing soil productivity (FAO, 2007). However, this practice’s mismanagement-plus low water quality-may lead soil to salinize, a slow-step phenomenon, affecting negatively both soil quality and agricultural yield, and thereby farmer’s income (Fernández et al., 2011; García, 2013).
Salinity is a complex process of chemical degradation that affects the physical properties of soils, which submit to heterogeneous distribution, vary over time and space. Around the world exist over 800 million hectares of soils affected by the higher concentration of different types of salts, which means that is one of the most important problems in the agriculture. The salinity has defined as one of the main processes of soil degradation that is reaching 7.7% equivalent approximately to 87300km2 of the area of Colombia. (Narváez, Combatt, y Bustamante, 2014).
A widespread approach to evaluate the soil salinity risk was proposed by the U.S Soil Laboratory (USSL staff, 1954). They assessed salinity risk based only on the electrical conductivity of irrigation water (CEw), and found then that the higher ECw values in the water the higher its soil salinity risk. Afterwards, some studies addressed natural resources risk by evaluating more than a parameter (CEw), but employing just one risk component. i.e. either the potential hazard or vulnerability (Bouksila et al., 2013;. Clermont-Dauphin et al., 2010; de Paz et al., 2004; Kanzari et al., 2012; Triantafilis et al., 2004). Moreover, some other authors have taken a step forward in determining the soil salinity risk, and they evaluated risk encompassing-without any distinction-both hazard and vulnerability components (de Paz et al., 2007; Masoudi et al., 2006; Zhou et al., 2013; Villafañe, 2011).
One of these authors (Villafañe, 2011), developed a procedure named SOSALRIEGO for diagnosing soil sodicity and salinity in Latin American by computing hazard (water quality), and vulnerability (climate and soil factors). But this approach does not map the risk (output), which may potentiate the analysis for planning and managing strategies to control the soil salinization (Peragóna et al., 2016; Bouksila et al., 2013; Mirlas, 2012; Akramkhanov et al., 2011; Juan et al., 2011a; Utset y Borroto, 2001).
The RUT (Roldanillo, Union y Toro) Irrigation District is one of the most important irrigation systems in thesouthwest of Colombia due to a strategic geographical position and favorable edaphic conditions for developing agriculture. The natural agricultural vocation of the irrigation district is for the establishment of crops of grains, fruit trees and vegetables; however, for economic, social and political reasons, 55% of the area of the district is currently under the crop of sugarcane with a growing tendency to increase its cropping area.
The soils of the RUT Irrigation District are of alluvial origin, with textures that vary from medium to heavy, moderately deep with poor internal drainage. There are reports of salinity and / or sodicity in at least 17% of the RUT area. They are soils that require agricultural mechanization and good management of irrigation and drainage (IGAC CVC, 2004). Therefore, this paper was aimed to assess soil salinity risk in the RUTirrigation district by using SOSALRIEGO model, and coupling it withGIS.
Materials and methods
Location and description of the study area
The RUT irrigation District is located on the direct influence area of Roldanillo, Unión y Toro municipalities, in Valle del Cauca Department (Fig. 1). It covers an area of 10200 ha, which benefits 1800 fields (1200 users).
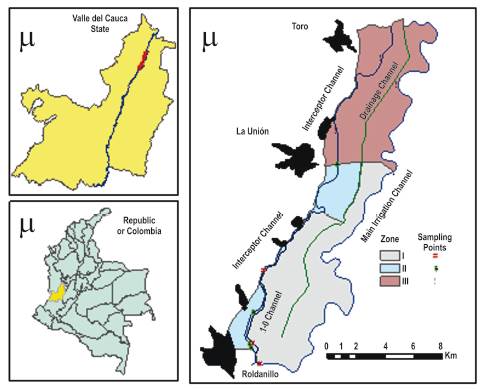
The RUT irrigation system is basically a flood protection and irrigation/drainage project. The flood control system includes interceptor canal (parallel to west Andes foothill) and protection dike (parallel to Cauca River). The irrigation system is comprised of pumping stations (Candelaria and Tierrablanca) and primary, secondary and tertiary canals. The primary canals are interceptor, main, and canal 1.0. The drainage system consists of pumping stations (Cayetana and San Luis) and main, secondary, and tertiary canals (Urrutia, 2006).
SOSALRIEGO model
SOSALRIEGO approach (Villafañe, 2011) requires inputs such as water ionic constituents, electrical conductivity of rainwater, annual rainfall, crop salt tolerance, soil texture, and leaching fraction (LF); and as output it provides predicted salts in the irrigation water, amendment types, and leaching requirement (LR). Only LR values were used to assess the soil salinity risk, and hence, to fed in the GIS tool.
Input parameters
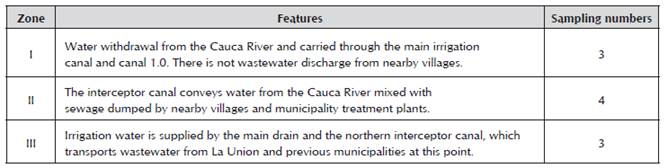
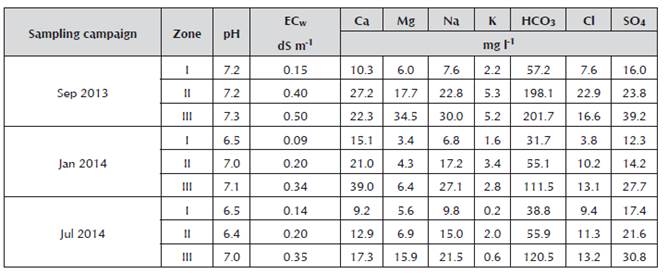
Physicochemical characteristics of irrigation water: 10 water samples-with replicates-were grabbed in the RUT irrigation district for each of three campaigns (September 2013, January 2014, and August 2014). Major parameters such as electrical conductivity (ECw), cations (Ca2+, Mg2+, Na+, K+) and anions (HCO3or CO3 , Cl, SO4) were determined following parametric test-was applied in the comparison of LRstandard procedures from American Public Health Association-APHA (APHA, 1999). These sampling points were distributed among three different water quality regions inside the RUT (Roldanillo, La Union y Toro) irrigation District (Table 1).
Electrical conductivity of rainwater: a 0.15 dS m-1 value of ECp was employed to feed in the model. This value is suggested by the SOSALRIEGO’s author.
Annual rainfall: two probabilities of exceedance (P50% and P75%) were forecasted for annual rainfall (P). A 11-station database was analyzed by using normal distribution method. Ordinary kriging interpolation was carried out in the ArcGIS® 10.3 software. This interpolation method best describes the spatial relationship of rainfall, and thus has been successfully employed by other authors (Bargaoui and Chebbi, 2009; Di Piazza et al., 2011; Bostan et al., 2012). The rainfall values calculated for each scenario were: 1233.5 mm year-1 and 832.7 mm year-1 for 50 and 75% probabilities of exceedance, respectively.
Crop salt tolerance: sugarcane, grapes and passion fruit were selected to be used in SOSALRIEGO. Their salinity tolerances are 1.7, 1.5 and 1 dS m-1, respectively (Ayers y Westcot, 1985). These three cultivars were chosen because they are the most representative crops in the RUT irrigation district.
Soil texture and leaching efficiency factor: Soil texture dominant in the RUT irrigation district is heavy (0.5), being clear that leaching efficiency factor will be lower in the case of heavy textures (IGAC-CVC, 2004).
Statistical analysis
The independence, normality (Shapiro-Wilk test) and homogeneity of the variances (Levene test) were not verified in LR values; hence, Kruskal-Wallis-a nonamong sampling campaigns, crops, and zones. Besides, pairwise comparison was performed for validating the analysis. The analytical process was run at IBM® SPSS® Statistics 20 software.
Results
Irrigation water quality
The concentration values of water quality shown in Table 2 met the suitable limits of the FAO guidelines for quality agricultural water (Ayers and Westcot, 1985). However, comparing them with an earlier study carried out in the region (CVC, 1986), we found that ion concentrations are steadily increasing in the surface water.
Soil salinity risk
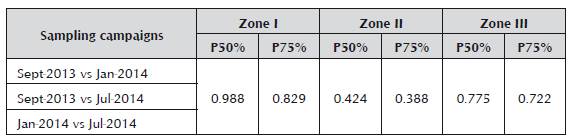
RL values for each crop statistically did not differ (pvalue>0.050) over time (among sampling campaigns) in each zone (Table 3). Thus, the soil salinity risk for sugarcane, grape, and passion fruit were mapped using the average LR value in each zone of the RUT irrigation district under two rainfall scenarios (Figure 2).
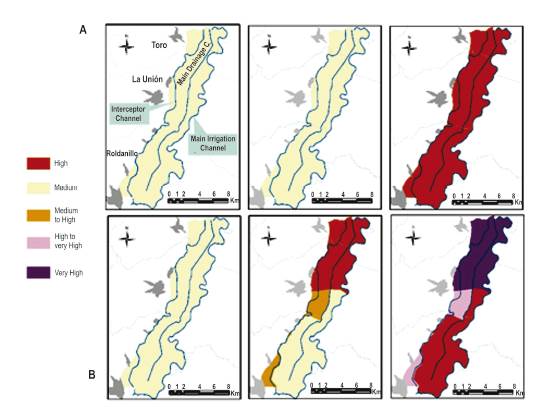
Figure 2 Spatial distribution of soil salinity risk. a) rainfall scenario of 50% probability of exceedance. b) rainfall scenario of 75% probability of exceedance
Table 3. Pairwise comparison of p-value among sampling campaigns of the three zones for sugarcane, grape, and passion fruit under rainfall scenarios of 50 and 75% probabilities of exceedance
In the first scenario (P50%), both sugarcane and grape fell into medium soil salinity risk (LR values from 0.11 to 0.20); while passion fruit classed as high (LR values from 0.21 to 0.30). In the second scenario (P75%), sugarcane kept its medium soil salinity risk level; whereas grape and passion fruit had different soil salinity risk in the three zones, much higher in the northern zone (zone III) than the southern zone (zones I and II). The grape crop increased from medium soil salinity risk in zone I, passing by medium to high (LR values from 0. to 0.) in zone II, to high in zone III. Likewise, passion fruit crop rose from high soil salinity risk, falling into high to very high (LR values from 0. to 0.) in zone I, to very high (LR values from 0.11 to 0.20) in zone III.
Discussion
Under rainfall scenario of 50% probability of exceedance both sugarcane and grape fall in medium soil salinity risk. Statistical significances (p-value<0.5) were found in the post-hoc analysis between these two crops and passion fruit (Table 4), which classed as a high category. Reducing the precipitation in 25% (P75%) the soil salinity risk in sugarcane keeps in medium; whereas, both grape and passion fruit raise one category in zone II, from medium to high, and from high to very high, respectively; and two categories in zone III, from medium to high, and from high to very high, respectively. Furthermore, the statistical significances (P-value <0.05) remain between sugarcane and passion fruit, and between grape and passion fruit (Table 4).
Table 4 Pairwise comparison of p-value among sugarcane, grape, and passion fruit in the three zones for under rainfall scenarios of 50 and 75% probabilities of exceedance
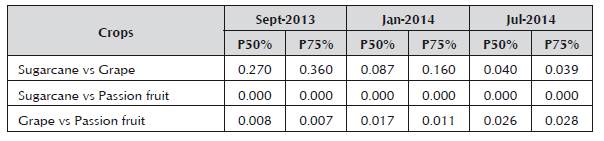
Differences of soil salinity risk among crops and zones may be due to the crop salt tolerance, as well as the irrigation water quality-especially the ECw: the passion fruit is more sensitive than the grape and the sugarcane are; and the irrigation water quality in the zone III-where canals carry drained water and domestic wastewater-is poorer than the zones II and I where canals convey domestic wastewater and water from the Cauca river, respectively. Thus, these two parameters are the sensible inputs in the SOSALRIEGO approach. Peragón et al., (2016), found that ECw influenced highly when they assessed the soil salinity risk for an olive crop.
On the other hand, the climatological conditions on the area is a factor that can affect soil salinity, since this area is considerate dry, whose means the rainfall is low and evapotranspiration is high; therefore, the irrigation necessities increase, and the accumulation of salts as well, if we do not handle it very well. Despite the fact we assessed the soil salinity risk by employing SOSALRIEGO-GIS, the approach computes together hazard and vulnerability components, and this issue disallows tackling each component separately. Besides, other inputs such as fertilization, water table and irrigation method may affect the soil salinity risk as well. Masoudi et al., (2006) and Zhou et al., (2013) found that for evaluating the soil salinity risk inputs such as water table and organic fertilizers are essential.
Conclusion
In this paper the soil salinity risk in the RUT irrigation district for sugarcane, grape, and passion fruit was assessed by coupling SOSALRIEGO-GIS. For those crops with salt tolerance the risk level was lower. That is a medium soil salinity risk for sugarcane, a medium to high for grape, and a high to very high for passion fruit. Furthermore, the soil salinity risk was higher in zones with poor irrigation water quality. Zones II and III, which canals convey domestic wastewater and drained water fell in greater salinity risk category than zone I, which bears water withdrawal from the Cauca River.
SOSALRIEGO-GIS seemed a useful tool for assessing soil salinity risk as it allows identifying the risk on the surface. However, the approach computes together hazard and vulnerability components, and this issue disallows tacking each component separately. Besides, other inputs such as fertilization, water table and irrigation method may affect the soil salinity risk as well.

