


Services on Demand
Journal
Article
 English (pdf)
 Article in xml format
 Article references
 Send this article by e-mail
Indicators
-
 Cited by SciELO
 -
 Access statistics
Related links
-
 Cited by Google
 -
 Similars in
SciELO
Similars in
SciELO -
 Similars in Google
Share

 Permalink
Vitae
Print version ISSN 0121-4004
Vitae vol.19 no.2 Medellín May/Aug. 2012
FOODS: SCIENCE, TECHNOLOGY AND ENGINEERING
EVALUATION OF NON FAT SOLIDS SUBSTITUTES (NSL) IN A HARD DAIRY ICE CREAM MIX WITH VEGETABLE FAT
EVALUACIÓN DE SUSTITUYENTES DE SÓLIDOS NO GRASOS (SNG) EN UNA MEZCLA DE HELADO DURO DE LECHE CON GRASA VEGETAL
Francy N. LÓPEZ B. M. Sc.1*; José U. SEPÚLVEDA V. M. Sc.2
1 1 Agricultural Sciences Faculty. Universidad Nacional de Colombia. Medellín, Colombia.
2 Associated Professor. Agricultural Sciences Faculty, Universidad Nacional de Colombia. Medellín, Colombia.
* Corresponding author: fnlopezb@unalmed.edu.co.
Received: 03 June 2011 Accepted: 28 August 2012
ABSTRACT
Background: In industries that produce ice cream, NFMS required in the mixture are obtained by addition of skim milk powder and whole milk, condensed milk, caseinate and others. However, due to factors such as national lack of these (caseinates) and the seasonal climate of regions which produce milk, these raw materials are relatively expensive, so it has increased the interest of using different substituents of non-fat milk solids (NFMS) without affecting the nutritional and sensory quality of ice cream, which comply with national legislation and represent a lower price to make them. Objectives: This study aimed to implement and evaluate a NFMS formulation for applying in ice cream mixes. Methods: the formulation (F1 substitute), was applied at different rates (20, 40, 60%) in mixtures of ice cream and was compared to a control without replacement. The physicochemical properties that were investigated included the mix viscosity, acidity, ph, mineral content (calcium and phosphorus), protein, ash, fat and total solids. In the ice cream was determined freezing, melting, overrun, whipping ability and sensory evaluation. For the study of the data was used Statgraphics 5.0 and the experimental design was a randomized complete block model with multiple range test of Duncan. Results: The results show that the viscosity value of the treatment, varies in a range of 398.7 to 1108.6 cp at a temperature of 4 ° C, being higher for T4 (higher percentage of substitution). The titratable acidity values of the ice cream mixture ranged from 0.17% to 0.12% with a higher (P <0.05) for T1. The protein content ranged from 3.2% to 2.5%. Conclusions: As the percentage of non-fat milk solids replacement increases, the protein percentage and melting decrease, reaching values established by Colombian law. With this study it is concluded that, the 40% substitution of non fat milk solids over ice cream mixture, is the one with the best physicochemical and sensory characteristics.
Keywords: Replacements, Non-fat milk solids, melting, freezing point, ice cream.
RESUMEN
Antecedentes: En las industrias que elaboran helados, los SNGL requeridos en la mezcla, son obtenidos por adición de leche en polvo descremada y entera, leche condensada, caseinato, entre otros. Sin embargo, debido a factores como la inexistencia nacional de los mismos (caseinatos) y la estacionalidad climática de las regiones del país productor de leche, estas materias prima tienen un costo relativamente alto, por lo cual se ha incrementado el interés de usar diferentes sustituyentes de Sólidos No Grasos Lácteos (SNGL), que no afecten la calidad nutricional y sensorial del helado, que cumplan con la legislación nacional y que representen un menor precio en su fa bricación. Objetivos: Este estudio tuvo como objetivo implementar y evaluar una formulación de SNGL para ser aplicados en mezclas de helado. Métodos: La formulación (sustituto F1), fue aplicada en diferentes porcentajes (20, 40, 60%) sobre mezclas de helado y fue comparada con un testigo sin sustitución. Las propiedades fisicoquímicas que fueron investigadas para la mezcla incluyeron viscosidad, acidez, ph, contenido de minerales (calcio y fósforo), proteínas, cenizas, grasa y sólidos totales. En el helado se determinó punto de congelamiento, derretimiento, sobreaumento, habilidad de batido y evaluación sensorial. Para el estudio de los datos se empleó el programa Statgraphics 5.0 y el diseño experimental fue un modelo por bloques completamente aleatorizado con prueba de rangos múltiples de Duncan. Resultados: Los resultados demostraron que el valor de viscosidad de los tratamientos, varía en un rango de 398,7 cp a 1108,6 cp a una temperatura de 4°C, siendo el mayor para T4 (mayor porcentaje de sustitución). Los valores de acidez titulable de la mezcla de helado variaron de 0,17% a 0,12% con un valor más alto (P < 0,05) para T1. El contenido de proteína varió entre 3,2% a 2,5%. Conclusión: Se concluye que a medida que aumenta el porcentaje de sustitución de SNGL, el porcentaje de proteína y derretimiento, disminuye alcanzando valores establecidos por la Legislación Colombiana. Con este estudio se concluye que el 40 % de sustitución de SNGL sobre la mezcla de helado es el que presenta mejores características fisicoquímicas y sensoriales.
Palabras clave: Sustitutos, sólidos no grasos lácteos, derretimiento, punto de congelamiento, helado.
INTRODUCTION
In Colombia, production of milk in 2008 was 6.55 billion liters. A large part of it was devoted to the production of ice cream, which for this year was 35102 tons. The per capita consumption in recent years is 2.3 kg of mixture, which proves to be a high-impact product within the dairy industry (1). Some of the ingredients that provide non-fat solids (NFS), used for making ice cream by small, medium and big companies, are integrated products imported in its entirety (2). The application of NFS is important for its nutritional value and functional properties. With this project, it is shown an alternative implementation of this variable using raw materials, mostly obtained at national level, maintaining the functional properties in the final product. The main objective of this study was to apply and evaluate a Non Fat Solids replacement (NFS) in an ice cream mixture.
MATERIALS AND METHODS
Raw Materials
In the preparation of ice cream mixes the following materials were used:
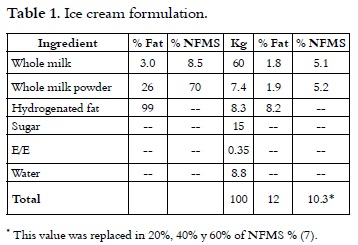
Liquid whole milk 3.0% fat and 8.5% non fat milk solids (NFMS), whole milk powder 26% fat and 70% non fat milk solids, hydrogenated fat at 99.9%, Sucrose, Stabilizer / Emulsifier.
Composition of substitute F1: Maltodextrin 19% D.E: it was replaced in 15% of total solids, ** Whey Protein at 12%: it was replaced 30% of NFMS variable**, Dipotassium Phosphate: maximum 10 g / kg **, Sodium tripolyphosphate: maximum 10 g / kg **, soy protein concentrated: it was replaced in 5% of the NFMS **, Sodium caseinate: it was replaced in 10% of the NFMS **, yolk powder: 0.5% **, precooked rice f lour: 2% **, Cassava starch: 1% **, potato starch: 1% **, Salt: 0.02% ** hydrogenated fat at 99.9%: 5% **, Palm oil: 5 % **, WPC 80: 30% **, soy lecithin: it was replaced 3000 mg / kg **, Mono and diglycerides of fatty acids: it was replaced 1500 mg / kg ** Glucose: it was replaced 30% of the total sweetness * *.
** Maximum amounts added to the formulation (3-6).
The restrictions in the formulation were made by trial and error. Data not shown.
Analysis of the substitute
The composition analysis of the substitute was made (5), resulting in the following percentages: 6.89% protein, 38.69% fat, 48.01% carbohydrate, 3% humidity.
With this formulation, different percentages of NFMS were replaced in mixtures; these results were compared with a sample without substitution which was used as control. It can be seen in Table 1.
Ice cream making (8)
Formulation of mixtures was made with 12% fat, 10.3% of NFMS, 15% sugar and 0.35% stabilizer / emulsifier. NFMS source was replaced by 20%, 40% and 60% with the substitute F1. Three replicates were made of each treatment. Liquid ingredients were placed in a pasteurizer in which was added the dry ingredients of each one of the mixtures using a solids mixer. The mixes were pasteurized at 73°C for 30 min and homogenized in two stages at a pressure of 2000 psi (APV Gaulin homogenizer). Each mixture was cooled down to 4°C. Then, they were matured for 24 hours at a temperature of 4°C (9). After this stage, it was added to each treatment 0.1% of vanilla extract per liter of mixture. The emulsions were subjected to mixing process at -4.0°C in a blender (Taylor) and they were made with an overrun of 90-100% by method weight – volume (10, 11). Ice creams were packed in presentations of 1 L and they were stored at -30°C.
Physico-chemical analysis
Physicochemical tests of each replicas of the different treatments (20%, 40%, 60% and control), both in the mix as in ice cream, were performed in triplicate (5).
Viscosity
It was held in a cylinder cone, 1mm Gap (Brookfield Rheometer DV III Ultra usillo SC421), 15cm3 of mixture were taken at 4°C, after 24 hours of maturation (8). Flow determinations were found exposing the samples to a deformation cycle, with a shear rate sweep upward from 0.5 to 250 s-1 at intervals of five seconds and one descending at the same shear. The apparent viscosity values were obtained at a shear rate of 10 s-1. It has been estimated that the deformation rate of the oral cavity on fatty foods like ice cream is 11.5 s-1 or less (12). The ascending curve data for all treatments were adjusted to power law model (13, 14), as it is shown in equation 1, using the software R / S Plus Rheometer.

where: τ = Shear stress; K = Consistency Coefficient; D = Velocity gradient; n = Flow behavior index.
Titratable Acidity
Was expressed as lactic acid percentage. The pH value was measured with a potentiometer (Corning, model 350 pH analyzer) (15).
Content of minerals
Calcium and phosphorus were obtained by atomic absorption, spectrophotometry. The protein content was measured by Kjeldahl method. The protein was determined by multiplying the total nitrogen by a factor of 6.25. Ash value was obtained by direct incineration, total solids by Gravimetric method (15) and fat by Pennsylvania method (7).
Methods of analysis in the ice cream
Freezing Point was determined on the temperature of the ice cream mix after being whipped (10). Melting rate was evaluated on ice cream samples stored at -18°C. Melting rate was determined by carefully cutting ice cream samples (weighed as 100g), placing the ice cream onto 1 mm stainless steel mesh over a cup and weighing the amount of ice cream drained into the cup at temperature room (25°C) for 1 hour.
Fall time of the first drop was determined by taking the time where the first drop has fallen (8). Whipping ability was evaluated by the time it took for the mixture to reach an overrun of 90% - 100% (11).
Sensory evaluation
The frozen ice cream at -14°C ± 1 (16-17), was subject to an acceptance test with 98 potential consumers of the product (18). Each sample was presented randomly to a particular evaluator. These were placed in identical containers and labeled with random numbers, using water to wash the mouth between samples.
Statistical analysis
Statistical analysis of the data was performed using the Statgraphics 5.0 program, and the experimental design was a randomized complete block model with Duncan's multiple range tests. It was used a confidence level of 95% and a level of power of 85%, to detect significant differences in the sensory test (19). One-way analysis of variance (ANOVA) (α = 95%) was performed; ice cream mixes or frozen ice creams were the treatments, and the means were compared using Duncan's multiple range test.
RESULTS
Physicochemical analysis of the mixture
Different letters by row indicate significant differences (p < 0.05), according to Duncan's multiple range test.
DISCUSSION
Physicochemical analysis of the mixture
Viscosity
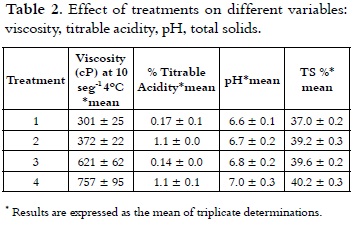
Table 2 shows the apparent viscosity of the treatments at a rate of 10 s-1, which varied in the range of 301 cP to 757 cP at 4°C.
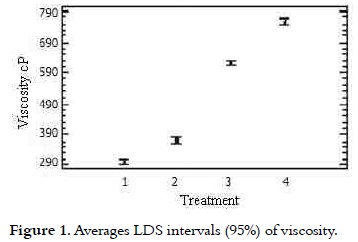
These results were consistent with studies (20- 21) where viscosities determined for ice cream mixes ranged from 270-810 cP at 10°C and 100 s-1 with 10.5% fat, 10.5% of NFMS, 12% of sugar and 4% of corn syrup solids. Research works showed that the real or basic viscosity at 20°C fluctuates between 50 and 300 cP (14), (8), (22). The analysis of variance showed statistically significant difference on the viscosity of the treatments (p < 0.05). The multiple range test permitted to see that T4 (60% replacement) had the highest value (p < 0.05) of 757 cP. Considering the significant differences (p < 0.05), multiple range test of Duncan was applied, which reports in Figure 1 that among the four treatments heterogeneity is presented.
Viscosity is temperature dependent, and with decreasing temperature in the storage the viscosity of the mixture will increase as this occurred in the different treatments (10). It was observed that increasing the percentage of NFMS replacement, the viscosity increased possibly by the presence of ingredients such as maltodextrin, mono and diglycerides of fatty acids. Maltodextrins are widely used in the food industry as stabilizers (modifying texture and volume) in emulsions (23-24). Maltodextrin used in the different treatments showed 19% of DE, which means that a large percentage of starch is present with the addition of this ingredient and it is reflected in the viscosity increase. This variable was higher as increased the percentage of replacement, due to the presence of mono-and diglycerides of fatty acids, that act as emulsifiers and salts (calcium, sodium, citrates, phosphates) that can modify it, due to its effect on casein and serum proteins (25-26). These results are consistent with studies made before (27), where increasing the level of emulsifier in ice cream, a higher viscosity is obtained. The viscosity is also affected by the addition of caseinate in the formulation. This is a mixture of four active casein (αs1-αs2-, β-and k-casein), which are widely used as food ingredients due to their significant nutritional value, its viscosity-modifying properties, water and fat-binding , foaming and emulsifying properties (23).
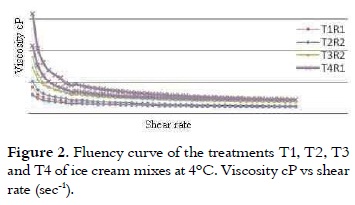
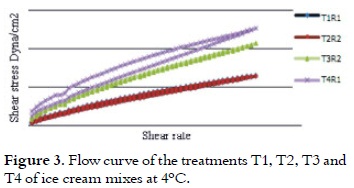
All treatments had thinning viscosity behavior because of the shear stress effect and by increasing the shear rate (28) as it is shown in figure 2.
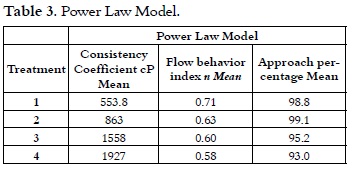
The treatment T4 had higher apparent viscosity in the flow curve, followed by T3, T2 and T1. This higher loss of the structure of ice cream mixes, when are subjected to shear rates, can be related to the rapid breakdown of the networks of casein, leading to a reduction in viscosity (29). This apparent viscosity at rest or at low shear rate, is because of the phenomena such as aggregation of fat globules that cause thinning behavior as a result of the effort, particularly due to the thixotropic nature of the mixture (14). It is shown in Table 3 that after making the adjustment to the power law model, it can be said that the treatments do not show the yield points because, although they have a degree of ordination, it is not enough to have a strong structure for developing an opposition to the flow, taking into account that relatively large values of effort in the rheometer are sensed.
As it is shown in Figure 3 the hysteresis area of the treatments 1, 2 and 3 is very low, so it could be concluded that the behavior of the treatments with these substitution percentages is not highly dependent on the time to recover its structure, while T4 has a higher thixotropy by the area of hysteresis seen in the two curves.
The thixotropic behavior reflects the destruction of the product structure during flow, and the subsequent recovery of viscosity when it stops. Ice creams with high consistency scores had higher resistance to flow (30). This information is useful for the analysis of this parameter in the piping design and pumping of ice cream mixes (27). Table 3 shows that all treatments have a f low index n <1, this result indicates a decrease in apparent viscosity when the shear rate increases, which is related to pseudoplastic behavior (14).
Acidity and pH
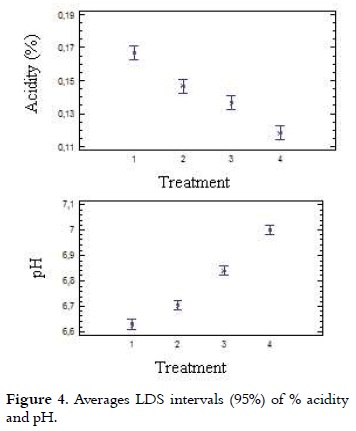
As it is shown in Table 2, acidity values of the ice cream mix ranged from 0.17% to 0.12% with a lower value (P < 0.05) for T4, compared with all other treatments. The analysis of variance for the data obtained in the acidity test showed statistically significant differences (p < 0.05) in each of the treatments with different NFMS replacement percentage. Considering the significant differences (p <0.05), the multiple range test of Duncan was applied, which reports in Figure 4 that among the four treatments it is presented heterogeneity.
Apparent or natural acidity of the ice cream mixture is caused by milk proteins, such as β-lactoglobulin (β-lg), serum albumin and immunoglobulin G (IgG), which contain disulfide bonds, free sulfhydryl groups, the α s2 casein and k-casein which also contain disulfide bonds (31), and also caused by mineral salts (especially phosphates and citrates) and dissolved carbon dioxide (10), (20). Therefore, when it is replaced milk protein by mixes of milk and vegetable protein in different treatments, the acidity was decreased. It should be mentioned that the acidity will be increased when the not fat solids content is higher (8). A blend with 10% of NFMS has an acidity of 0.18% (7). The pH values of mixtures of ice cream are presented in Table 2, these showed inversely proportional behavior to the acidity and were between 6.63 and 7.0 with a higher value (P < 0.05) for T4, compared with all other treatments. These values are very similar to those found by other authors (32, 33), which are in the range of 6.7 to 6.9. Considering the significant differences (p < 0.05), the multiple range test of Duncan was applied, which reported that among the four treatments is presented heterogeneity, as it is shown in Figure 4.
Total solids
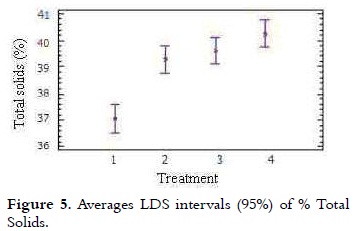
The content of solids in the different treatments was in a range between 37.05% and 40.26%. It can be seen in Table 2 that with increasing the NFMS substitution percentage, the content of TS was higher.
The variance analysis showed statistically significant difference on the content of TS from the different treatments (p < 0.05). The multiple comparison test (Figure 5) showed that T1 had a lower percentage of TS (p < 0.05) compared with other treatments, total solids of T2, T3 and T4, were growing steadily. Theoretically it is expected that for classifying a product as hard ice cream, its mix should contain total solids levels higher than 33% (21).
The moisture content for an ice cream with 11.25% NFMS, 10% fat, 36.7% total solids is between 63% - 64% (32, 34).
Minerals
The calcium average content of the treatments is presented in Table 4. It was observed that with increasing the NFMS percentage substitution, the calcium content in the treatments decreased.
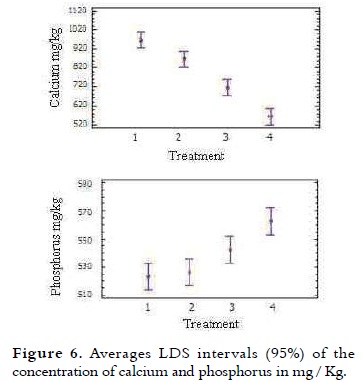
The analysis of variance showed significant difference on the calcium and phosphorus percentage of different treatments (p < 0.05). The multiple comparison test in Figure 6 indicates that T1 with 967.8 mg / kg of calcium had the highest value (p < 0.05). It was found that the calcium content of T2 and T3 was 868 and 717.2 mg / kg, respectively. For T4 was obtained 564.5 mg / kg, being the lowest of all treatments. Given that to be a good source of calcium, ice cream must contain 10% -19% Daily Value (DV) of this mineral, or 100-190 mg of calcium per serving (10), (35) the reported values for each of the treatments differ slightly to these percentages.
Ice cream by its calcium content can contribute significantly to the diet (36), therefore T1, T2 and T3 in particular, are the treatments that are closer to these requirements. By consuming 70 g, with a 40% replacement of NFMS, would be contributing approximately 7% (50.20 mg of Ca) of the recommended daily intake. The average content of phosphorus in the treatments is presented in Table 4. It was noted that from 40% NFMS substitution, the phosphorus content of the treatments increased. This result may be due to the presence of acidity regulators as dipotassium phosphate and sodium tripolyphosphate (37). The study found that replacing 40% of the NFMS, 70 g of ice cream provide values of 37.95 mg, representing 5% of the adult daily requirement.
Protein
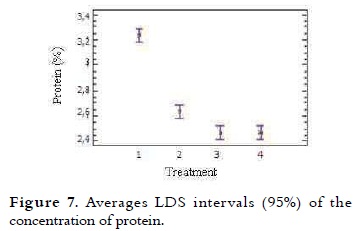
This content in the mixtures of ice cream varied between 2.5% and 3.2% and it is presented in Table 4. A trend in the decrease in protein content was seen, as different NFMS percentages were substituted in the mixtures. The variance analysis showed significant difference (p < 0.05) in the protein value in the different treatments. Protein levels were similar between the T4 and T3. This content in T1 and T2 was higher (P < 0.05) compared with all other treatments, due to their low substitution as it is shown in Figure 7. These results are acceptable when compared to the NTC 1239, which specifies that the milk ice cream with vegetable fat must have at least 2.5% protein (11).
Proteins contribute to the ice cream structure development, including emulsification, mixing (38), and water holding capacity (39). The emulsifying properties of proteins in the mixture arise from its adsorption to the fat globules at the homogenization time (40). The amounts of protein in a single serving of regular ice cream are approximately 2.2%. Additionally when whey solids are added to replace 25% of the NFSM in the mixture, the protein decreases (10). It was noted that the greater the amount of protein, the greater the rate of melting, in T1 the protein content was 3.2% and the melting was 15.3%, while for T4 with 2.5% protein the melting was 8.4%, this value is the lowest of all treatments. This phenomenon may be due to protein concentrates and soy isolates, which contain relatively large amounts of ionized polar amino acids such as glutamic and aspartic acid, they can link almost three times more water than non-ionizable polar groups (41).
Fat
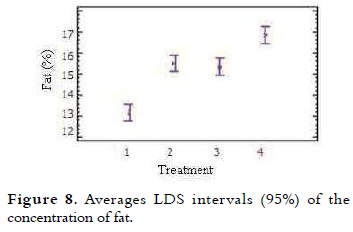
The fat average content of ice cream mixes is presented in Table 4. The NTC 1239 establishes that the total fat percentage for milk ice cream with vegetable fat is at least 8% (11). It was noted that when the percentage of NFMS replacement was higher, the fat content increased proportionally. The variance analysis showed significant difference in the fat value of the different treatments (p < 0.05). The multiple comparison test shown in Figure 8, indicates that between T1 (control) and T2, there were significant differences, as well as between T3 and T4 (p < 0.05). At T2 (20% substitution) and T3 (40% substitution) the behavior of this variable was very similar.
This increase in fat values for each of the treatments is due to the fat concentration in the substitute (38.69%), which is greater than the powdered milk (26%). The use of correct percentages is necessary not only to balance the mix, but also to meet legal standards. Studies show that fat globules are concentrated on the surface of air bubbles during freezing, giving flavor and smooth in texture (3).
Ice cream
Freezing Point
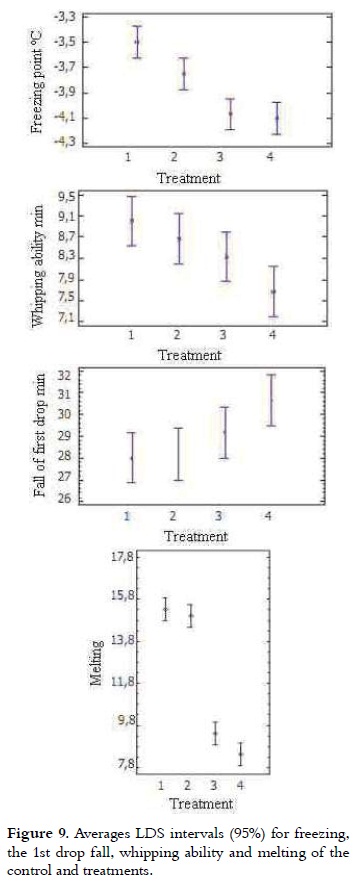
The freezing point of most ice cream mixes varies between -2.2 and -2.8°C. This is a colligative property, influenced by the number of molecules in solution, that for this product are mainly sugar (42). Table 4 shows the freezing point of the 4 treatments. It can be seen that it is lower for samples that have a higher percentage of NFMS replacement. The variance analysis showed significant difference in the freezing point value of the different treatments (p < 0.05). The freezing point of T3 and T4 were not different, being the lowest of all treatments. The T1 FP was the highest (P < 0.05) as it is shown in Figure 9. The freezing point of mixtures with high sugar content and non-fat solids decreases and may be less than -3°C, while the mixtures with high-fat content, low NFS or low sugar content may be greater than -1.4°C (10),(16). As the substitution percentage was increased, the freezing point was decreased. This result is related to the use of sweeteners such as dextrose, known as D-glucose, which decreases the freezing temperature due to its lower molecular weight compared with sucrose, improving the consistency of ice cream (10, 43).
Melting
It was determined that the first drop fall of the 4 treatments was in a range between 28 to 30.7 minutes for T1 and T4, respectively as it is shown in Table 4, according to the analysis of variance significant difference between treatments was not shown (p > 0.05). These results agree with those obtained for a formulation with 10% milk fat, 11% non-fat milk solids, 10% sugar, 5% glucose syrup, where the decay time of the first drop took about 30 minutes for all samples (40), (44). As regards the melting rate, there were significant differences between treatments (p < 0.05). This was 15.3%, 15.0%, 9.4% and 8.4% for T1, T2, T3 and T4, respectively.
According to the results obtained in this work, is stated that all samples had first drop downtime and melting percentage that are within permitted parameters (14, 21). The amount of protein decreases without affecting markedly the structure of ice cream, due to the presence of starch, maltodextrin, soy concentrates, mono and diglycerides, which have emulsifying properties, gelling agents, capable of foaming and to retain water, resulting in a slower melting (45-48).
Sensory evaluation
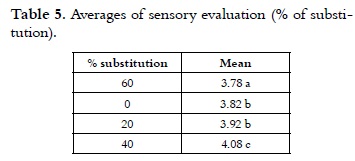
The analysis of variance for the data obtained in the sensory test, showed significant differences (p < 0.05) in the acceptance of the product, between replacement percentages evaluated for acceptance. Considering the significant differences, Duncan multiple range test was used to determine the percentage of different substitute in relation to product acceptance. Ice creams made with 40% NFMS substitution have better sensory acceptance, the opposite occur with ice creams made with a percentage of 60% as it is shown Table 5, because with this percentage, there are ingredients such as whey protein concentrates, maltodextrins, soy protein that have emulsifying effect, giving body, volume and stability to this type of food (49). At higher levels of substitution, the percentage of lactose is increased, resulting in a coarser texture. Mineral content decreases, thus affecting the appearance and consistency of ice cream and the fat emulsion stability (50); some marked flavors can appear with increasing content of soybean (51-53).
CONCLUSIONS
It is possible to produce ice cream successfully replaced up to 40% of F1 with the NFMS substitute. Physicochemical characteristics, viscosity, acidity, pH, phosphorus, ash, protein and fat are found to be within acceptable parameters for the production of mixtures. The behavior of the freezing, melting and mixing skills are normal. The sensory evaluation of 96 panelists of the 4 treatments resulted in greater acceptance for the treatment with 40% substitution.
ACKNOWLEDGEMENT
Appreciation is expressed to the Universidad Nacional of Colombia in Medellín and the company ALSEC S.A.® for financial contribution to this research.
REFERENCES
1. Mojica-F TR, Castellanos D, Bernal N. Agenda prospectiva de investigación y desarrollo tecnológico de la cadena láctea colombiana [internet]. Bogotá (CO): Ministerio de Agricultura; 2007 [updated 2007 Nov 12; cited 2009 Oct 12 ]. Available from: http://www.minagricultura.gov.co/archivos/lacteos.pdf. [ Links ]
2. Álvarez V, Wolters C, Vodovotz Y, Ji T. Physical Properties of Ice Cream Containing Milk Protein Concentrates. J Dairy Sci. 2005 Mar; 88 (3): 862-871. [ Links ]
3. Echavarria J, Gómez M. Elaboración de un helado de bajo aporte calórico [bachelor's thesis]. [Medellín]: Universidad Nacional de Colombia; 2003. 126 p. [ Links ]
4. Instituto Nacional de Vigilancia y Control de Medicamentos y Alimentos. Resolución 2310 de 1986 por la cual se legisla el procesamiento, composición, requisitos, transporte y comercialización de los Derivados Lácteos. Bogotá, Colombia: Ministerio de Salud; 1986. 41 p. [ Links ]
5. Jaramillo M, Mejia I, Sepulveda J. Principios de procesamiento y control de calidad de leches. Medellín, Colombia: Universidad Nacional de Colombia; 1999. 238p. [ Links ]
6. López-Marin B. Diseño de un producto de uso específico a partir de banano, coadyuvante en el mantenimiento o mejoramiento de la salud [master's thesis]. [Medellín]: Universidad de Antioquia; 2008. 140 p. [ Links ]
7. Corrales L, Sepúlveda U. La leche, su procesamiento y control. Medellín, Colombia: Universidad Nacional de Colombia; 2005. 325p. [ Links ]
8. Arbuckle WS. Ice Cream. New York, USA: AVI, editor; 1996. 349 p. [ Links ]
9. Soler L. Development of non-dairy frozen dessert containing soy protein and coconut milk [bachelor's thesis]. [Louisiana]: Louisiana State University and Agricultural and Mechanical College; 2005. 84 p. [ Links ]
10. Marshall R, Goff D. Ice cream. New York, USA: Publishers KAP; 2003. 375 p. [ Links ]
11. Instituto Colombiano de Normas Técnicas y Certif icación. Norma Técnica Colombiana. NTC1239. Helados. Bogotá: ICONTEC; 2002. p. 1-18. [ Links ]
12. Aime D, Artfield S, Malcolmson L, Ryland D. Textural analysis of fat reduced vanilla ice cream products. Food Res Int. 2001; 34 (2-3): 237-246. [ Links ]
13. Akalm A, Karagözlü C, Ünal G. Rheological properties of reduced-fat and low-fat ice cream containing whey protein isolate and inulin. Eur Food Res Technol. 2008 Jun; 227 (3): 889-895. [ Links ]
14. Goff H, Davison V, Capp E. Viscosity of ice cream at pasteurization temperature. J Dairy Sci. 1994 Aug; 77 (8): 2207-2013. [ Links ]
15. AOAC International. Official methods of analysis of AOAC International. Gaithersburg, USA: Arlington; 2000. Vol II. Cap 33. 71p [ Links ]
16. Abd El-Rahman A, Madkor S, Ibrahim F, Kilara A. Physical Characteristics of Frozen Desserts Made with Cream, Anhydrous Milk Fat, or Milk Fat Fractions. J Dairy Sci. 1997 Sept; 80 (9): 1926-1935. [ Links ]
17. Specter SE, Setser CS. Sensory and physical properties of a reduced calory frozen dessert system made with milk fat and sucrose substitutes. J Dairy Sci. 1994 Mar; 77 (3): 708-717. [ Links ]
18. Torricella R, Zamora E, Pulido H. Evaluación sensorial aplicada a la Investigación, desarrollo y control de alimentos. La Habana, Cuba: Editorial Universitaria; 2007. 135p. [ Links ]
19. Kuelh R. Diseño de experimentos. Principios Estadísticos Para el Análisis y Diseño de Investigaciones. Ciudad de México, México: Thompson Editores; 2001. 666 p. [ Links ]
20. Patel M, Baer R, Acharya M. Increasing the Protein Content of Ice Cream. J Dairy Sci. 2006 May; 89 (5): 1400-1406. [ Links ]
21. Flórez C. Prueba de un nuevo estabilizante-emulsificante para helado comercial [bachelor's thesis]. [Medellín]: Universidad Nacional de Colombia; 2003. 74p. [ Links ]
22. Agudelo JP. Determinación del tiempo óptimo de maduración del helado comercial utlizando dos tipos de estabilizantes emulsificantes [bachelor's thesis]. [Medellín]: Universidad Nacional de Colombia; 1989. 107p. [ Links ]
23. O'Regan J, Mulvihill D. Preparation, characterisation and selected functional properties of sodium caseinate–maltodextrin conjugates. Food Chem. 2009 Aug 15; 115 (4): 1257-1267. [ Links ]
24. Loret C, Meunier V, Frith W, Fryer P. Rheological characteristics of the gelation behaviour of maltodextrin aqueous solutions. Carbohydr Polym. 2004 Aug 30; 57 (2): 153-163. [ Links ]
25. Cottrell J, Pass G, Phillips G. The effect of stabilizers on the viscosity of an ice cream. J Sci Sood Agr. 1980 Oct; 31 (10): 1066-1070. [ Links ]
26. Goff H, J. DV. Flow characteristics and holding time calculations of ice cream mixes in HTST holding tubes. J Food Prot. 1992; 55 (1): 34-37. [ Links ]
27. Baer RJ, Wolkow MD, Kasperson KM. Effect of emulsifiers on the body and texture of low fat ice cream. J Dairy Sci. 1997 Dec; 80 (12): 3123-3132. [ Links ]
28. Kus S, Altan A, Kaya A. Rheological behavior and time-dependent characterization of ice cream mix different salep content. J Texture Stud. 2005 Jun; 36 (3): 273-288. [ Links ]
29. Bourriot S, Garnier C, Doublier J. Phase separation, rheology and structure of micellar casein-galactomannan mixtures. Int Dairy J. 1999 Mar; 9 (3-6): 353-357. [ Links ]
30. Muse M, Hartel R. Ice cream structural elements that affect melting rate and hardness. J Dairy Sci. 2004 Jan; 87 (1): 1-10. [ Links ]
31. Sourdet S, Relkin P, César B. Effects of milk protein type and pre-heating on physical stability of whipped and frozen emulsions. Colloid Surface B. 2003 Sep; 31 (1-4): 55-64. [ Links ]
32. Murtaza A, Ud Din M, Huma N, Shabbir A, Mahmood S. Quality Evaluation of Ice Cream Prepared with Different Stabilizers/ Emulsifier Blends. Int J Agr Biol. 2004; 6 (1): 65-67. [ Links ]
33. Abdullah M, Saleem-ur-Rehman., Zubair H, Saeed H, S. K, Shahid M. Effect of Skim Milk in Soymilk Blend on the Quality of Ice Cream. Pak J Nutr. 2003; 2 (5): 305-311. [ Links ]
34. Bylund G. Manual de industrias lácteas. Madrid, España: Libros M-P, editor; 2003. 436 p. [ Links ]
35. Hernández M. Alimentación infantil. Madrid, España: Díaz de Santos; 2001. 235 p. [ Links ]
36. Timm F. Fabricación de helados. Zaragoza, España: Acribia; 1989. 317 p. [ Links ]
37. Tester R, Karkalas J, Qi X. Starch-composition, fine structure and architecture. J Cereal Sci. 2004 Mar; 39 (2): 151-165. [ Links ]
38. Turan S, Kirkland M, Trusty PA, Campbell I. Interaction of fat and air in ice cream. Dairy Ind Int 1999; 64 (1): 27-31. [ Links ]
39. Schmidt K. Effect of milk protein and stabilizer on ice milk. J Food Quality. 1994 Mar; 17 (1): 9-19. [ Links ]
40. Goff D. Colloidal Aspects of Ice Cream-A Review. Int Dairy Journal. 1997 Jun-Jul; 7 (6-7): 363-373. [ Links ]
41. Chiang W, Shih C, Chu Y. Functional properties of soy protein hydrolysate produced from a continuous membrane reactor system. Food Chem. 1999 May; 65 (2): 189-194. [ Links ]
42. Jaskulka FJ, Smith DE, Larntz K. Development of an empirical model to predict the freezing point of ice cream mix. Milchwissenschaft. 1995; 50 (1): 26-30. [ Links ]
43. Romero del Castillo R, Mestres R. Productos lácteos: Tecnología. Cataluña, España: Universidad Politécnica de Cataluña; 2004. 228 p. [ Links ]
44. Sakurai K, Kokubo K, Hakamata M, Yoshida S. Effect of production conditions on ice cream melting resistance. Milchwissenschaft. 1996; 51 (8): 451-454. [ Links ]
45. Cornell H, Hoveling A. Wheat chemistry and utilization. Lancaster, USA: Springer Netherlands; 1998. 426 p. [ Links ]
46. Lawal OS, Adebowale KO, Oderinde RA. Functional properties of amylopectin and amylose fractions isolated from bambarra groundnut (Voandzeia subterranean) starch. Afr J Biotechnol. 2004 Aug; 3 (8): 399-404. [ Links ]
47. Jiménez A. Valor nutritivo de la proteína de soya. Investigación y Ciencia. 2006; 14 (36): 29-34. [ Links ]
48. Jambrak A, Lelas V, Mason T, Krešic G, Badanjak M. Physical properties of ultrasound treated soy proteins. J Food Eng. 2009 Aug; 93 (4): 386-393.
49. Matemu A, Kayahara H, Murasaw, et al. Improved emulsifying properties of soy proteins by acylation with saturated fatty acids. Food Chem. 2011 Jan; 124 (2): 596-602. [ Links ]
50. Amiot J. Ciencia y tecnología de la leche, principios y aplicaciones. Zaragoza, España: Acribia; 1991. 324 p. [ Links ]
51. Singh P, Kumar R, Sabapathy S, Bawa A. Functional and Edible Uses of Soy Protein Products. Compr Rev Food Sci F. 2008 Jan; 7 (1): 14-28. [ Links ]
52. Swanson RB, Vondekamp SL, Knight CN. Functionality of Soy Milks as a Substitute for Cow's Milk in Food Products: Muffins, Ice Cream, Quiche, Popovers. J Am Diet Assoc. 2006; 106 (8): A42. [ Links ]
53. Arora A, Damodaran S. Removal of soy protein-bound phospholipids by a combination of sonication, β-cyclodextrin, and phospholipase A2 treatments. Food Chem. 2011 Aug; 127 (3): 1007-1013.

