


Serviços Personalizados
Journal
Artigo
 Espanhol (pdf)
 Artigo em XML
 Referências do artigo
 Enviar este artigo por email
Indicadores
-
 Citado por SciELO
 -
 Acessos
Links relacionados
-
 Citado por Google
 -
 Similares em
SciELO
Similares em
SciELO -
 Similares em Google
Compartilhar

 Permalink
Vitae
versão impressa ISSN 0121-4004
Vitae vol.22 no.2 Medellín maio/ago. 2015
https://doi.org/10.17533/udea.vitae.v22n2a08
DOI:10.17533/udea.vitae.v22n2a08
FOODS: SCIENCE, ENGINEERING AND TECHNOLOGY
PHYSICO-CHEMICAL AND MICROBIOLOGICAL CHANGES IN COMMERCIAL TILAPIA (Oreochromis niloticus) DURING COLD STORAGE
CAMBIOS FISICO-QUÍMICOS Y MICROBIOLÓGICOS EN TILAPIA COMERCIAL (Oreochromis niloticus) DURANTE ALMACENAMIENTO REFRIGERADO
Nelson GUTÉRREZ GUZMÁN PhD.1*, Isabel FERNÁNDEZ SEGOVIA PhD.2, Ana FUENTES LÓPEZ PhD.2, María RUIZ RICO MsC.2, José Manuel BARAT BAVIERA PhD.2
1 Facultad de Ingeniería, Universidad Surcolombiana, Neiva, Colombia.
2 Departamento de Tecnología de Alimentos, Universidad Politécnica de Valencia, Valencia, España.
* Corresponding author: ngutierrezg@usco.edu.co.
Recibido: Julio 24 de 2014
Aceptado: Septiembre 21 de 2015
ABSTRACT
Background: The microbiological and chemical processes are the main responsible for deterioration of fresh fish. Therefore, it is essential to avoid these processes by applying good manufacturing practices during fish handling, distribution and storage. Objectives: The aim of this paper was to evaluate the physico-chemical and microbial changes in commercial tilapia (Oreochromis niloticus) during cold storage in order to establish the shelf life since its arrival at the supermarket. Methods: 27 aquacultured tilapia specimens were analyzed at 0, 2, 4, and 7 days of storage at 4°C. Measurements of texture, color, water holding capacity, total volatile basic nitrogen (TVB-N), thiobarbituric acid index, ATP-related compounds, as well as microbial analyses were carried out. Results: The TVB-N content was high at the beginning of the study, remaining stable during the storage. Lipid oxidation of samples was minimum, so this process did not contribute to the fish spoilage. It was observed the breakdown of inosine-5'-monophosphate (IMP) into Ino (inosine), and Ino into Hx (hypoxantine). The texture parameters and colour underwent changes as a consequence of the fish spoilage. Low microbial counts were observed at day 0, but Enterobacteriaceae and mesophilic counts gradually increased throughout storage.Conclusions: The K1-value showed the progressive spoilage of the fish during the cold storage. The decrease of hardness and firmness confirmed the loss of quality throughout the time of study. The low microbial counts at the beginning of the study demonstrated the good quality of the tilapia; however, the increase of the mesophilic counts at the end of the studied period showed that tilapia was not fit for human consumption at day 7.
Keywords: Tilapia, quality, shelf-life, cold storage.
RESUMEN
Antecedentes: Los procesos microbiológicos y químicos son los principales responsables del deterioro del pescado fresco. Por tanto, es esencial evitar estos procesos aplicando buenas prácticas de fabricación durante la manipulación, distribución y almacenamiento del pescado.Objetivos: El objetivo de este trabajo fue evaluar los cambios físico-químicos y microbiológicos en tilapia comercial (Oreochromis niloticus) durante el almacenamiento refrigerado con el fin de establecer la vida útil desde su llegada al supermercado.Métodos: 27 especímenes de tilapia fueron analizados a día 0, 2, 4 y 7 de almacenamiento a 4 °C. Se llevaron a cabo medidas de textura, color, capacidad de retención de agua, nitrógeno básico volátil total (N-BVT), índice del ácido tiobarbitú rico, compuestos relacionados con el ATP, así como análisis microbianos. Resultados: El contenido en N-BVT fue alto al principio del estudio, siendo estable durante el almacenamiento. La oxidación lipídica de las muestras fue mínima, por lo que este proceso no contribuyó al deterioro del pescado. Se observó la degradación de inosina-5'- monofosfato (IMP) a Ino (inosina), y de Ino a Hx (hipoxantina). Los parámetros de textura y color sufrieron cambios como consecuencia del deterioro del pescado. Se observaron bajos recuentos microbianos a día 0, pero los recuentos de Enterobacteriaceae y de mesófilos aumentaron gradualmente durante el almacenamiento.Conclusiones: El valor K1 mostró el deterioro progresivo del pescado durante el almacenamiento en refrigeración. La disminución de dureza y firmeza confirmó la pérdida de calidad a lo largo del tiempo de estudio. Los bajos recuentos microbianos al principio del estudio demostraron la buena calidad de la tilapia; sin embargo, el aumento de los recuentos de mesófilos al final del periodo estudiado mostraron que la tilapia no era adecuada para el consumo humano a día 7.
Palabras clave: Tilapia, calidad, vida útil, almacenamiento refrigerado.
INTRODUCTION
Aquaculture is expanding in all the continents as far as new areas and species are concerned, and is also intensifying and diversifying the product range in species and product forms to meet consumer requirements. Freshwater fish production has increased dramatically in the last two decades, and has been driven chiefly by the rapid development of tilapia and other species. Tilapia is the third most cultured fish, after carps and salmonids, and the global production of this fish rose to 3.5 million of tons in 2010 (1). Tilapia offers adequate biologic and ecologic features, such as adaptability, fast growth, disease resistance and efficient feed conversion capacity (2), and is one of the fish species with the highest production and distribution worldwide. Aquaculture tilapia production is located mainly in Asia, with 72% of world production, followed by Africa (19%) and America (9%) (1). It is believed that imports of tilapia to Europe will increase significantly in the near future because, owing to environmental concerns, more consumers are looking for suitable alternatives to white fish fillets. The main markets in the European Union (EU) are big cities where large communities of African, Chinese and Asian citizens live. However, tilapia consumption in non-ethnic markets has also increased recently. China is the leading supplier of European countries, and Poland, Spain and Germany are the largest markets in the EU (3).
Freshness is the most important attribute when evaluating fish quality. When fish die, several postmortem changes take place. They are related to the breakdown of the cellular structure and biochemistry, and also to the growth of microorganisms that are either naturally associated with fish or form part of the flora due to contamination during handling (4). These modifications, which affect fish quality and shelf life, are changes in pH, texture, water holding capacity and color, protein and ATP degradation, lipid oxidation, as well as production of undesirable compounds such as molecular low weight volatile bases (TVB-N), which are produced by bacterial or enzymatic action.
The quality of fish products found in supermarkets is highly related to handling, transportation and distribution conditions. Scientific shelf life studies have been carried out to determine changes during chilled storage (5, 6, 7). Some of these studies start at the time of slaughter or capture; however, the fish that usually arrive at retailers do not always present the same freshness. Nowadays, consumers are far away from fish production areas. Although distribution channels have improved in the last few decades, the long distance between producers and consumers means that fish arrive at the supermarkets with different grades of freshness.
The aim of this work was to evaluate the physico-chemical and microbial changes in commercial tilapia (Oreochromis niloticus) during cold storage in order to establish the shelf life from its arrival at supermarket.
MATERIALS AND METHODS
Materials
In this work, 27 aquacultured tilapia (Oreocrhomis niloticus) specimens were used. Fish were purchased from a local supermarket in Valencia (Spain) and were transported to the laboratory in polystyrene boxes with ice. There was no information available about the background of the fish samples (feed composition, handling or transport conditions) or slaughter dates. Fish were wrapped in plastic film to minimize dehydration and any contact with oxygen during cold storage. Samples were analyzed at 0, 2, 4, and 7 days of storage at 4°C.
Before the analyses, fish were headed, gutted and filleted, and two fillets per fish were obtained. Samples were taken from the dorsal muscle of the two fillets, except for the compression test, which was the analysis performed on the whole fish.
Analytical Methods
Proximate composition: Moisture, lipid, protein and ash contents were assayed by AOAC methods 950.46, 991.36, 928.08, and 920.153, respectively (8).
Physico-chemical parameters
Measurements of pH were carried out according the method described by Rizo et al. (2015) (9). Water holding capacity (WHC) was determined according to the technique described by García et al. (2006) (10). For this determination, a portion of 0.3 g of sample was placed between two dry filter papers and two acrylic plates on which a 10 kg pressure was applied for 15 min. The sample was weighed before and after being compressed, as well as the dry and wet filter papers. WHC was expressed as g of water held per 100 g of total water in the fish sample. The total volatile basic nitrogen (TVB-N) content was determined by steam distillation following the method described by Malle and Tao (1987) (11), and was expressed as mg N/100 g of muscle.
The TBA index was determined by a spectrophotometric technique according to the method described by Vyncke (1970) (12) and the results were expressed as mg malonaldehyde (MDA)/kg of fish muscle.
The ATP-related compounds, consisting of inosine-5'- monophosphate (IMP), inosine (Ino), and hypoxantine (Hx), were determined by HPLC according to the method described by Barat et al. (2008) (13), with minor modifications. The analysis was conducted in a Hitachi LaChrom Elite liquid chromatography (Hitachi Ltd., Tokyo, Japan®) with a pump (model L-2130), an auto-sampler (model L-2200) and a UV detector (model L-2400). Data acquisition was performed with the EZChrom Elite software (Agillent Technologies, Palo Alto, CA, USA®). Separations were done on a reverse-phase Ultrabase C18 250 x 4.6 mm, internal particle diameter of 5 mm (Análisis Vínicos, S.L., Tomelloso, Spain®). Compounds were identified using retention time comparison of unknowns with those of standards and by standard addition or "spiking". IMP, Ino, and Hx were quantified according to the external standard method, using calibration curves of the peak area of compound vs concentration of compound under identical chromatographic conditions. K1-values were calculated according to Equation 1:
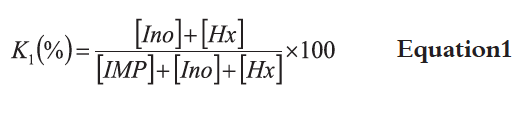
Where IMP is inosine 5'-monophosphate; Ino, inosine; Hx, hypoxanthine. All chemical reagents were provided by Sigma-Aldrich (St. Louis, MO, USA®).
Texture profile analysis (TPA) and compression test were performed on tilapia using a Texture Analyser TA.XT2® (Stable Micro Systems, Surrey, UK) equipped with a load cell of 250 N. For the TPA analysis, samples were obtained by cutting parallelepiped pieces (40 Ã 30 mm) from the dorsal muscle of the fillet. In this test, a flatended cylindrical plunger (7.5 mm diameter) was employed. The plunger was pressed into the sample at a constant speed of 0.8 mm/s until 50% of the sample height was achieved. Force-distance curves were processed to obtain seven texture parameters: hardness, adhesiveness, springiness, cohesiveness, gumminess, chewiness, and resilience.
For the compression study, the texture analyzer was equipped with a 24.5 mm-diameter flat-ended cylindrical plunger. The plunger was pressed down at a constant speed of 5 mm/s into the sample until compressing 7 mm (14). This analysis was performed on the whole fish behind the dorsal fin.
Instrumental color analyses were performed with a Minolta Chroma Meter CM-3600d (Minolta, Osaka, Japan®) with a D65 light source and a 10º observer. Data were expressed using the CIE L*a*b* system to represent lightness (L*), redness (a*), and yellowness (b*). Furthermore, the values of chroma (C*ab), which defines saturation of color, and the angle of hue (h*ab) were obtained.
Microbial analyses
Mesophilic counts were done according to the method provided in standard UNE-EN ISO 4833:2003 (15). Enterobacteriaceae were enumerated according to the method described by Pascual and Calderón (2000) (16). All the culture media were provided by Scharlau Chemie, S.A. (Barcelona, Spain). All the analyses were performed in duplicate and the results were expressed as log CFU/g.
Statistical analysis
Statistical treatment of the data was performed using the Statgraphics Centurion (Statpoint Technologies, Inc., Warrenton, VA, USA®). An analysis of variance (One-Way ANOVA), in which storage time was the factor, was conducted for each parameter evaluated to test whether there were significant differences throughout cold storage. The LSD procedure (least significant difference) was used to test for differences between averages at the 5% significance level.
RESULTS
Proximate composition
The proximate composition of fresh tilapia is shown in Table 1. These values agree with the data presented by Yanar et al. (2006) (17). Regarding the fat content, our results agree with the data reported by Suloma et al. (2008) (18); however, lipid content was higher, and subsequently moisture was lower, than those provided in other studies. The protein content data are in accordance with those obtained by other authors for the same fish species (17, 19, 20). The crude protein content in fish muscle can range from11to 24% (wet weight), depending on specie, state of nutrition, the reproductive cycle of the animals, etc. (20).
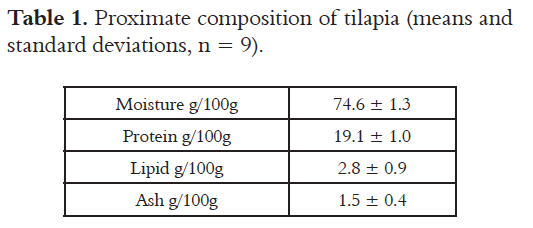
Table 2 shows the values of moisture content, pH, WHC, TVB-N and TBA index of tilapia during cold storage. The initial value of pH was 6.06, increasing progressively during the storage time. These results are in accordance with the results obtained by Tome et al. (2000) (21) and Khalafalla et al. (2015) (22) for the same fish species. Fresh fish pH oscillates between 6.0 and 6.5 (23), depending on different factors such as fish species, season, diet, level of activity or stress during capture, and storage conditions ( 24).
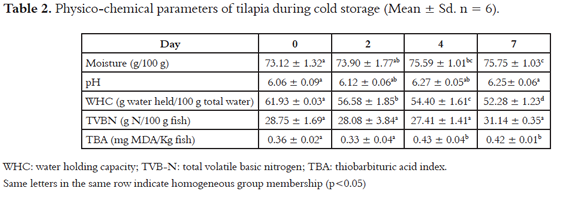
The WHC values significantly decreased during storage (Table 2), which agree with other studies (10, 25). The decrease in the WHC can be due to a gradual denaturation of proteins because of the microbial activity and pH changes during the storage.
The TVB-N content was high at the beginning of the study (Table 2). The changes of this parameter throughout the storage were non-significant. The TVB-N r is commonly considered a quality index for unprocessed fish products as its increase is related to the activity of spoilage bacteria and endogenous enzymes (26, 27, 28). The action of such enzymes results in the formation of compounds, including ammonia, monoethylamine, dimethylamine, etc. which give fish a characteristic off-flavour (29).
The TBA index remained low and constant throughout the study, ranging between 0.33 and 0.43 mg MDA/kg (Table 2), which is in accordance with other studies with tilapia (17). Different limit of acceptability values have been reported for this index. According to Connell (1995) (30), TBA values of 1-2 mg MDA/kg of fish flesh are usually regarded as the limit beyond which fish normally develop an objectionable odor. Ruiz-Capillas and Moral (2001) (31) established that the minimum TBA index value detectable by panellists was 1.44 mg MDA/kg.
ATP-related compounds
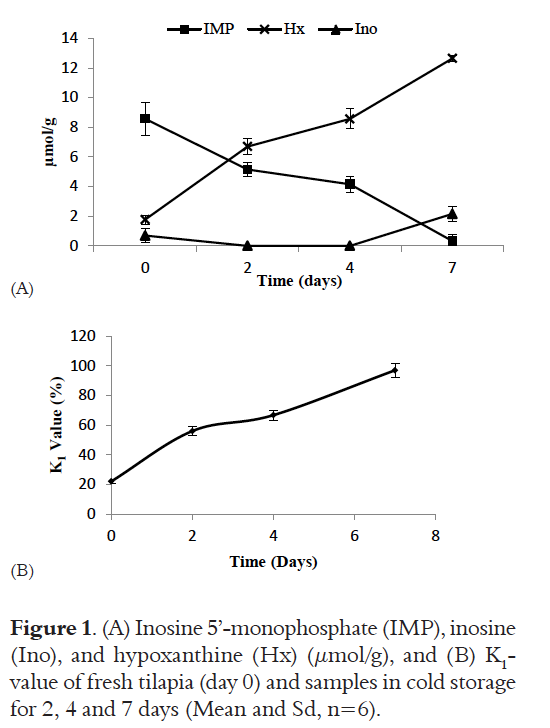
Figure 1 depicts the changes of inosine 5'-monophosphate (IMP), inosine (Ino), hypoxanthine (Hx) and the K1-value during cold storage. The evolution of major adenine nucleotides and their related compounds can provide information about biochemical changes during storage. The ATP catabolism to IMP has been reported to be essentially caused by endogenous enzymes. Nevertheless, the hydrolysis of Ino and Hx formation may also result from bacterial enzymes (32, 33). In addition, several authors have found that loss of sensory quality correlates with increases in the Hx level during storage (34).
In this study, ATP, ADP and AMP were not analyzed because the conversion of ATP into IMP is usually completed in 1 day, is presumed totally autolytic (35), and the main changes during storage occur in IMP, Ino and Hx (9).
The IMP levels decreased from 9.5 to 0.5 µmol/g. The Ino contents remained low during the 7 days of study with a maximum value of 2.0 µmol/g at the end of storage. The initial Hx contents were low but increased during the storage period to reach 12.3 µmol/g.
Ehira and Uchiyama (1987) (4) have demonstrated that the K1-value, which measures the extension of IMP degradation, is a good freshness index for a large number of fish species. In this study the initial values of K1 were over 20%, increasing during the storage period.
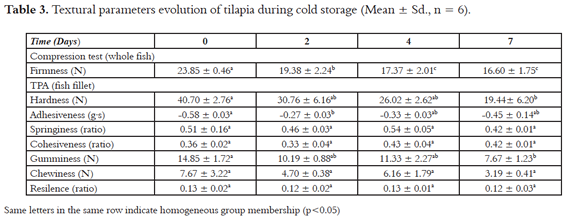
Texture
Firmness, hardness, adhesiveness and gumminess significantly changed during storage (Table 3). It is important to note the decrease of firmness and hardness observed throughout the studied period, which indicates changes in the structure of fish.
Color
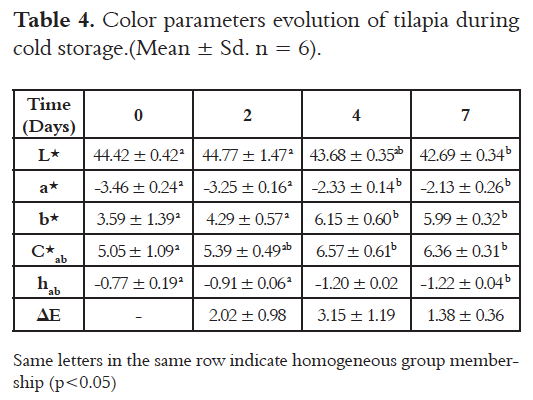
Lightness of tilapia muscle slightly decreased with storage time, while a* and b* parameters progressively increased (p< 0.05) (Table 4). The mechanism which leads to color changes in tilapia is unclear, although some authors have reported that one or the causes is the oxidation of muscle myoglobin (36).
Microbial analyses
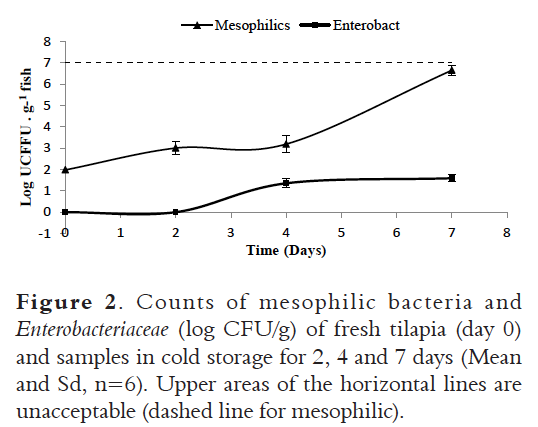
The evolution of mesophilic bacteria and Enterobacteriaceae counts are shown in Figure 2. Mesophilic counts gradually increased throughout storage. Limits of 6-7 log CFU/g for mesophilic bacteria have been established for fresh water and marine species fit for human consumption (16). Samples reached this limit of acceptability at day 7 of the study. No Enterobacteriaceae were found on days 0 and 2 of storage, but they increased to 1.6 log CFU/g at the end of storage.
DISCUSSIONS
Proximate composition
The chemical composition of tilapia is highly affected by: season, environmental conditions, water quality, state of maturity, feeding conditions or sex (37, 38). Regarding the fat content, Puwasatien et al. (1999) (19) reported that tilapia muscle contained 1.8% of fat. Visentainer et al. (2005) (39) and Chaijan (2011) (20) reported even lower lipid contents (1.09 and 1.10%, respectively), Younis et al. (2015) (38) reported values lower than 1% of fat. According to these results, tilapia can be classified as a lean fish because its fat content is below 2 g fat/100 g. However, in the present study tilapia showed a lipid content of 2.8% and should, therefore, be classified as low-fat fish (total lipid content from 2% to 4%) (40). The protein content found in this study (19.1%) was higher than the values reported in other studies on tilapia (38). However, the moisture content in this work was lower than those found by Younis et al. (2015) (38) and Fonseca et al., (2013) (41), which could explain the differences found in in lipid and protein contents.
Physico-chemical parameters
The behavior of the TVB-N (high initial value with no significant increase throughout the storage) could not be related to the quality changes of tilapia during the study. Several works have shown a poor correlation of TVB-N with storage time and sensory fish quality (42). Variation in TVB-N of a particular fish species depends on the fish non-protein nitrogen content, which in turn depends on the type of fish feeding, catching season, fish size, and also on other environmental factors (29).
The TBA index remained between 0.33 and 0.43 mg MDA/kg, which can be considered low in comparison with other studies on tilapia, where values about 1 mg MDA/kg were reached at 6 days of storage. Therefore, it can be concluded that in this study lipid oxidation of samples was minimum, so this parameter did not contribute to the fish spoilage.
The changes observed in the IMP, Ino and Hx contents throughout the storage indicate the breakdown of IMP into Ino, and Ino into Hx. Therefore, the K1-value increased during the storage period. Ehira and Uchiyama (1987) (4) established that in recently captured fish K1-value should not exceed 10%, a fish of excellent quality should not exceed 20%, and values between 20% and 45% indicate fish of acceptable quality, while values greater than 60% indicate spoiled fish. Based on these categories, at the beginning of the study tilapia fish could be considered moderately fresh and spoiled from day 4 of cold storage.
Fish death triggers autolytic and microbiological processes that make muscle softer and less elastic. Hernández et al., (2009) (43) found that hardness values highly correlated with storage time and microbial counts. In this study, noticeable changes were observed especially in hardness and firmness, which underwent an important decrease during the storage time, which agree with other studies on tilapia (44). The decrease in the hardness and firmness could be due to the protein denaturation.
Regarding color changes, it is important to highlight the variability of data found in different studies on tilapia. Oliveira et al., (2014) (44) reported higher values of L* and b*, while Fonseca et al. (2013) (41) found lower values of L* and higher of a*, compared with this study. The differences in the color could be due to the different environment and different diets, which directly affect the color muscle.
Microbial analyses
Enterobacteriaceae was not reached the acceptability limit of 3 log CFU/g established in other studies (26). Enterobacteriaceae in the flora of fish appears when fish are obtained from polluted water, or if there is a delay in chilling after capture. Furthermore, Enterobacteriaceae may occur due to cross contaminations during postprocessing; e.g., filleting. In this sense, aquaculture fish are expected to be of good hygienic quality since they live in a controlled environment and are slaughtered through good practices. Moreover handling, distribution and storage conditions are usually more controlled than in wild fish.
Mesophilic bacteria counts reached the acceptability limit (6-7 log CFU/g) at day 7 of the study. Taking into account this limit, the shelf life of tilapia used in this study would be lower than 7 days. In other studies on tilapia (38, 41, 44), this limit has been reached after a longer period of time. This is due to that in this work the day 0 of study was not the slaughter day, but the day of purchase in the supermarket.
In order to establish properly the shelf life period, a sensory analysis is needed to confirm the results obtained by physico-chemical and microbial analyses.
CONCLUSIONS
The results of the physico-chemical and microbial analyses showed the spoilage of tilapia during cold storage. TVB-N was not a good indicator of the fish spoilage. No oxidation could be observed in the tilapia during the 7 days of storage. The ATPrelated compounds and K1-value showed the progressive spoilage of the fish during the cold storage. The decrease of hardness and firmness confirmed the loss of quality throughout the time of study. The low microbial counts at the beginning of the study demonstrated the good quality of the tilapia; however, the increase of the mesophilic counts at the end of the studied period showed that tilapia was not fit for human consumption at day 7.
It is important to consider that the distance between producers and consumers decisively determines degree of fish freshness in the destination market, for this reason it is essential to apply good manufacturing practices to ensure a good quality of fish when reaching consumers.
REFERENCES
1. Food and Agriculture Organization of the United Nations (FAO). The State of the World Fisheries and Aquaculture. FAO Corporate Document Repository, 2012. (Accessed September 13 of 2012). Available in: http://www.fao.org/docrep/016/i2727e/i2727e.pdf. [ Links ]
2. Morales G, Blanco L, Arias ML, Chaves C. Evaluación de la calidad microbiológica de tilapia fresca (Oreocrhomis niloticus) proveniente de la zona norte de Costa Rica. Arch Latinoam Nutr. 2004 Dec; 54(4): 433-437. [ Links ]
3. Food and Agriculture Organization of the United Nations (FAO). Market Reports: June 2013. (Accessed December 18 of 2013). Available in: http://www.globefish.org/tilapia-june-2013.html. [ Links ]
4. Ehira S, Uchiyama H. Determination of fish freshness using the k value and comments on some other biochemical changes in relation to freshness. In Seafood quality determination, Kramer DE & Liston J (eds.), Elsevier Science Publishers BV, Amsterdam, Nederland 1987, p. 185-207. [ Links ]
5. Zaragoza P, Fuentes A, Fernández-Segovia I, Vivancos J-L, Rizo A, Ros-Lis J, Barat J M, Martínez-Mañez R. Evaluation of sea bream (Sparus aurata) shelf life using an optoelectronic nose. Food Chem. 2013 Jun; 138 (2-3): 1374-1380. [ Links ]
6. Zaragoza P, Fuentes A, Ruiz-Rico M, Vivancos J-L, Fernández-Segovia I, Ros-Lis J, Barat J, Martínez-Máñez R. Development of a colorimetric sensor array for squid spoilage assessment. Food Chem. 2015 May; 175: 315-321. [ Links ]
8. Association of Official Analytical Chemists (AOAC). Official Methods of Analysis. 17th Ed. Arlington, VA. AOAC International. 2002. [ Links ]
9. Rizo A, Máñes V, Fuentes A, Fernández-Segovia I, Barat J M. Physicochemical and microbial changes during storage of smokeflavoured salmon obtained by a new method. Food Control. 2015 Oct; 56: 195-201. [ Links ]
10. García JA, Núñez FA, Rentería AL, Jiménez JA, Espinosa MR. Calidad de canal y carne de trucha arco iris (Oncorhynchus mykiss Richardson), producida en el noroeste del Estado de Chihuahua. Hidrobiológica. 2006 Jun; 16(1): 11-22. [ Links ]
11. Malle P, Tao SH. Rapid Quantitative Determination of Trimethylamine using Steam distillation. J Food Protect. 1987 Sept; 50(9): 756-769. [ Links ]
12. Vyncke W. Direct determination of the thiobarbituric acid value in trichloracetic acid extract of fish as a measure of oxidative rancidity. Fett Wiss Technol. 1970 Dec; 72: 1084-1087. [ Links ]
13. Barat JM, Gil L, García-Breijo E, Aristoy MC, Toldrá F, Martínez-Mañez R, Soto J. Freshness monitoring of sea bream (Sparus aurata) with a potentiometric sensor. Food Chem. 2008 Jun; 108: 681–688. [ Links ]
14. Sánchez J, Costell E. Estrategias de alimentación y cultivo de la dorada. Estudio patológico y control de la calidad sensorial. Valencia, España: IATA CSIC; 2002. 108 p. [ Links ]
15. International Organization for Standardization (ISO). ISO 4833, 2003 Microbiology of food and animal feeding stuffs. Horizontal method for the enumeration of microorganisms. Colony-count technique at 30 degrees C. 2003. [ Links ]
16. Pascual MR, Calderón V. Microbiología alimentaria: metodología analítica para alimentos y bebidas. Madrid, España: Díaz de Santos; 2000. 464 p. [ Links ]
17. Yanar Y, Celik M, Akamca E. Effects of brine concentration on shelf-life of hot-smoked tilapia (Oreochromis niloticus) stored at 4°C. Food Chem. 2006 Jul; 97: 244–247. [ Links ]
18. Suloma A, Ogata HY, Garibay ES, Chavez D, El-Haroun ER. Fatty acid composition of Nile tilapia Oreochromis niloticus muscles: a comparative study with commercially important tropical freshwater fish in Philippines. 8th International Symposium on Tilapia in Aquaculture. Cairo: Egypt 2008; pp. 921-932. [ Links ]
19. Puwasatien P, Judprasong K, Kettwan E, Vasanachitt K, Nakngamanong Y, Bhattacharjee L. Proximate composition of raw and cooked Thai freshwater and marine fish. J Food Compos Anal. 1999 Mar; 12: 9–16. [ Links ]
20. Chaijan M. Physicochemical changes of tilapia (Oreochromis niloticus) muscle during salting. Food Chem. 2011 Dec; 129: 1201–1210. [ Links ]
21. Tome E, Iglesias M, Kodaira M, Gonzales A. Efecto de la temperatura de almacenamiento en el rigor mortis y en la estabilidad de la tilapia (Oreocrhomis Ssp.) cultivada. Rev cient FCV-LUZ. 2000 Mar; 10(4): 339-345. [ Links ]
22. Khalafalla F, Ali F, Hassan A-R. Quality improvement and shelflife extension of refrigerated Nile tilapia (Oreochromis niloticus) fillets using natural herbs. University journal of basic and applied sciences. 2015; 4: 33-40. [ Links ]
23. Fennema O R. Química de los alimentos. Zaragoza, España: Ed Acribia; 2000. 1258 p. [ Links ]
24. Ocaño-Higuera VM, Marquez-Ríos E, Canizales-Dávila M. Castillo-Yáñez FJ, Pacheco-Aguilar R, Lugo-Sánchez ME, García-Orozco KD, Graciano-Verdugo AZ. Postmortem changes in cazon fish muscle stored on ice. Food Chem. 2009 Oct; 116: 933–938. [ Links ]
25. Sotelo I, Filomena A, Rodríguez J. Evaluación de las propiedades del Cajaro (Phractocephalus hemiliopterus) como potencial para la obtención de surimi y productos derivados. Rev MVZ Córdoba. 2008 Dec; 13(3): 1456-1463. [ Links ]
26. Fuentes A, Fernández-Segovia I, Barat JM, Serra JA. Influence of sodium replacement and packaging on quality and shelf life of smoked sea bass (Dicentrarchus labrax L.). LWT-Food Sci Technol. 2011 May; 44(4): 917–923. [ Links ]
27. Kykkidou S, Giatrakou V, Papavergou A, Kontominas MG, Savvaidis IN. Effect of thyme essential oil and packaging treatments on fresh Mediterranean swordfish fillets during storage at 4 °C. Food Chem. 2009 Jul; 11: 169-175. [ Links ]
28. Özogul K, Özyurt G, Kuley E, Özkutuk S. Sensory, microbiological and chemical assessment of the freshness of red mullet (Mullus barbatus) and goldband goatfish (Upeneus moluccensis) during storage in ice. Food Chem. 2009 May; 114: 505-510. [ Links ]
29. Goulas AE, Kontominas MG. Combined effect of light salting, modified atmosphere packaging and oregano essential oil on the shelf-life of sea bream (Sparus aurata): Biochemical and sensory attributes. Food Chem. 2007; 100: 287-296. [ Links ]
30. Connell JJ. Control of fish quality 4th ed. Oxford, United Kingdom: Ed. Wiley BlackWell; 1995. 256 p. [ Links ]
31. Ruiz-Capillas C, Moral A. Residual effect of CO2 on hake (Merluccis merluccius L.) stored in modified and controlled atmospheres. Eur Food Res Technol. 2001 Jan; 212: 413-420. [ Links ]
32. Dalgaard P. Freshness, quality and safety in seafoods. Flair-Flow Europe Technical Manual F-FE 380A/00. Danish Institute for Fisheries Research May 2000. (Accessed January 31 of 2012). Available: http://flairflow4.vscht.cz/seafood00.pdf. [ Links ]
33. Surette ME, Gill TA, LeBlanc PJ. Biochemical basis of postmortem nucleotide catabolism in cod (Gadus morhua) and its relationship to spoilage. J Agr Food Chem. 1988 Jan; 36(1): 19–22. [ Links ]
34. Giménez B, Roncalés P, Beltrán JA. Different packaging conditions to improve shelf-life of filleted rainbow trout. In Prooceedings of 30th WEFTA Plenary Meeting, Gudjónsson A, Niclasen O (Eds.), Tórshavn Froya Fródskaparfelag, Faeroe Islands 2000. pp. 43-50. [ Links ]
35. Alasalvar C, Taylor KDA, Öksüz A, Garthwaite T, Alexis MN, Grigorakis K. Freshness assessment of cultured sea bream (Sparus aurata) by chemical, physical and sensory methods. Food Chem. 2001 Jan: 72: 33–40. [ Links ]
36. Venugopal V, Postharvest quality changes and safety hazards. In: Seafood processing: Adding value through quick freezing, retortable packing and cook-chilling. Venugopal V. Editor. (New Jersey): 2006. CRC Press; p. 23-60 [ Links ]
37. Saeed S M. Impact of environmental parameters on fish condition and quality in lake Edku, Egypt. J Aquat Biol Fish. 2013; 17 (1): 101-112. [ Links ]
38. Younis E M, Al-Asgah N, Abdel-Warith A, Al-Mutairi A. Seasonal variations in the body composition and bioaccumulation of heavy metals in Nile tilapia collected from drainage canal in Al-Ahsa, Saudi Arabia. Saudi J Biol Sciences. 2015; 22: 442-447. [ Links ]
39. Visentainer JV, de Souza NE, Makoto M, Hayashi C, Franco MR. Influence of diets enriched with flaxseed oil on the a-linolenic, eicosapentaenoic and docosahexaenoic fatty acid in Nile tilapia (Oreochromis niloticus). Food Chem. 2005 May; 90 (4): 557-560. [ Links ]
40. Ackman RG. Seafood lipids and fatty acids. Food Rev Int. 1990; 6(4): 617-646. [ Links ]
41. Fonseca G G, Cavenaghi-Altemio A, Silva M de F, Arcanjo V, Sanjinez-Argadoña E J. Influence of treatments in the quality of Nile tilapia (Oreochromis niloticus) fillets. Food Science & Nutrition. 2013 March; 1(3): 246-253. [ Links ]
42. Baixas-Nogueras S, Bover-Cid S, Veciana-Nogues MT, Vidal-Carou MC. Effect of gutting on microbial loads, sensory properties, and volatile and biogenic amine contents of European hake (Merluccius merluccius var. Mediterraneus) stored in ice. J Food Protect. 2009 Aug; 72 (8): 1671–1676. [ Links ]
43. Hernández MD, López MB, Álvarez A, Ferrandini E, García-García B, Garrido MD. Sensory, physical, chemical and microbiological changes in aquacultured meagre (Argyrosomus regius) fillets during ice storage. Food Chem. 2009 May; 114 (1) : 237– 245 [ Links ]
44. Oliveira PR, Oliveira CA, Sobral PJ, Balieiro JC, Natori NN, Viegas MM. How Stunning methods affect the quality of Nile tilapia meat. CyTA Journal of Food. 2014; 13(1): 56-62. [ Links ]
