


 English (pdf)
 Article in xml format
 Article references
 Send this article by e-mail
 Cited by SciELO
  Cited by Google
  Similars in
SciELO
Similars in
SciELO  Similars in Google
 Permalink
Introduction
Poliunsatured fatty acids (PUFA), specifically the Omega 3 family ones: α-Linolenic Acid (ALA), Eicosapentaenoic Acid (EPA), and Docosahexaenoic Acid (DHA) are currently considered of great importance to human health due to the effect they have on cardiovascular disease risk factors 1; for instance, ALA has an effect on dyslipidemia and hypertension with physiological responses such as on total cholesterol reduction, low density lipoproteins (LDL), triglycerides (TG), and systolic blood pressure; as for DHA and EPA, they have effects on risk factors such as adiposity and inflammation with physiological responses such as mitochondrial biogenesis increase, oxidation metabolism, lipoprotein lipase activity, and high density lipoproteins (HDL); additionally, they have effects on TG hepatic triacylglycerol lipase activity, and visceral adiposity 2,3.
ALA is found in important quantities in a wide variety of seeds, plants, and nuts, among others; in linseed and linseed oil, contents are between 45% and 55%; however, in other vegetable oils contents are below 10%; therefore, this type of food, classified as AG source for human diet, does not have significant contribution 4. Currently, it is known that fish is one of the best omega 3 PUFAs sources, particularly those with high fat contents, like mackerel, tuna, sardine, and mostly salmon. It is important to highlight that each species has different ALA, EPA, and DHA contents due to a number of factors like each species metabolic characteristics, diet, and fishing season, among others 5,6.
Due to the great PUFA importance on human health, it is necessary to perform their quantification, particularly on source food like fish. The extraction of the sample total fat is the first phase and the critical point for the fatty acid (FA) profile quantification 9; then, FA are transformed into FA methyl esters (FAME), a requirement to be analyzed through the gas chromatography (GC) method, one of the most widely used techniques for this type of analyte 10.
For the extraction of the total fat from the sample, a number of procedures has been developed that imply the use of solvent mixtures, being the most used Soxleth, Bligh & Dyer, and Folch 11. In the Human Nutrition and Laboratory, the SOXTEC method has been traditionally used, but it has a high volume of solvents and it takes about four hours for the extraction of fats from the sample generating high amounts of waste. In contrast, literature suggests the method proposed by Bligh & Dyer in 1959 in studies conducted to compare extraction methods from a fish matrix, it shows more accurate and efficient results than the Soxleth method, besides being very fast and having very low waste generation (12-13.
Consequently, the objective of this study was to compare the SOXTEC extraction technique to the one proposed by Bligh & Dyer in terms of efficiency in recovery percentages, reliability, easiness, and convenience.
Materials and methods
Reactive
Reactive elements used had an analytic grade, such as Methanol, chloroform, Hydrochloric Acid (HCl), Hexane, Sodium Hydroxide, Anhydrous Sodium Sulfate (Na2SO4) supplied by Merck (Darmstadt, Germany), Internal Standard Triundecanoic Glyceryl C11:0 ≥98% supplied by SIGMA-ALDRICH (St. Louis, MO, US), a fatty acid ester methyl analytic standard: Food Industry FAME Mix, 37 components, supplied by Restek (Bellefonte, PA, US), 14% Boron Trifluoride Methanol solution (BF3/MeOH), supplied by PANREAC Applichem (Gatersleben, Saxony-Anhalt, Germany), SMR 1946 Lake Superior Fish Tissue Certified Reference Material (CRM) supplied by NIST (Washington, DC, US), and tuna fish in oil, bought at a local supermarket as the issue sample.
Sample Treatment
Homogenized and frozen CRM were thawed at 4°C refrigerator temperature. The commercial tuna fish sample, once opened, were drained most of their oil contents, homogenized with a food processor, and then samples were taken at random.
Lipid Extraction
Extraction With Solvents Using A 1047 Soxtec Hydrolysis Unit System
Exactly 1 g of grounded and homogenized sample was weighted into the hydrolysis tubes. 2 mL of C11:0 triundecanoate internal standard was added to a 5.00 mg/mL concentration. Between 120 mL and 130 mL of HCl were added. The hydrolysis tubes were placed into the 1047 hydrolysis unit (Foss Tecator AB, Höganäs, Sweden), simmering for one hour. After the acid hydrolysis, the sample was dried in a microwave oven at medium power for 45 min. then, the dried sample was extracted with 50 mL of hexane and it was taken to the 2050 self-extraction unit (Foss Tecator AB, Höganäs, Sweden) under the following conditions: 30 min simmering time, 45 min rinsing time, and 10 min recovery time. After the extraction, the sample was cooled down in a dryer until constant weight was achieved.
Bligh & Dyer
Exactly 2 g of sample were weighted and homogenized into Falcon tubes. 2 mL of C11:0 triundecanoate internal standard was added to a 5.00 mg/mL concentration. 6 mL of a 2:1 methanol:chloroform (MeOH:CHCl3) were added. It was placed into a vortex for 2 min. 4 mL of CHCl3 and 4 mL of deionized water were added and placed into a vortex again for 2 min. There was a waiting time until the organic and aqueous phases separated. The organic phase (lower) was taken with a Pasteur pipette and transferred into a previously weighted 50 mL 24/40 Erlenmeyer. A second extraction was performed adding again 4 mL of CHCl3 and 4 mL of deionized water, placed into a vortex for 2 min. There was a waiting time until the phases separated. The lower phase was taken and placed into the Erlenmeyer that had the first phase. CHCl3 was evaporated in an oven at 70°C 12-13.
Fatty Acid Quantification
Fatty Acid Methyl Ester Preparation
The FA esterification process was performed in an Erlenmeyer with a dried sample, 4 mL of 0.5 M methanol NaOH solution was added, it was taken to a backflow warm up until the fat corpuscles disappeared (5 - 10 min, usually). 5 mL of a 14% BF3/MeOH solution were added to the condenser and the warm up continued for 2 min more. Then, 4 mL of Hexane were added to the condenser and the warm up continued for 1 more min. The Erlenmeyer was taken away from the warm up unit, it was cooled down at room temperature, and a NaCl saturated solution was added to the Erlenmeyer neck. Phase separation was allowed and the upper hexane phase was transferred to an Eppendorf tube that had been added a pinch of Na2SO4 Anhydride 14.
Gas Chromatography Analysis
The GC analysis was conducted in a gas chromatograph (Agilent Technologies, 7890B CA, US) equipped with a 7963A Agilent self-sampler, flame ionization detector, split/splitless injection port (Split 100:1), fused silica capillary column TR-CN100, 60 m x 0.25 mm (i.d). The temperature of the injector was 250°C. The temperature program started at 100°C, raised to 145°C at a rate of 8°C/min; it was held at 145°C for 5 min and then raised to 220°C at a rate 2°C/min. Helium was used as carrier gas at a 1.4 mL/min rate. The detector temperature was 260°C. The software used to handle data was Open Labs CDS Chem Station, version C.01.05.
FA quantification was performed according to the official method 15. Food Industry FAME MIX (RESTEK) pure standard was used for the FA identification, based on standard and sample retention time comparison.
Method validation
For the validation, the methodologies proposed by the International Conference on Harmonisation 16 and Asociación Española de Farmacéuticas17 were taken, assessing the following parameters: Accuracy, precision (repeatability and intermediate precision), selectivity, limit of detection (LOD), limit of quantification (LOQ), linearity, and range. Each item specifies the number of samples that were used for its evaluation.
Results
Accuracy
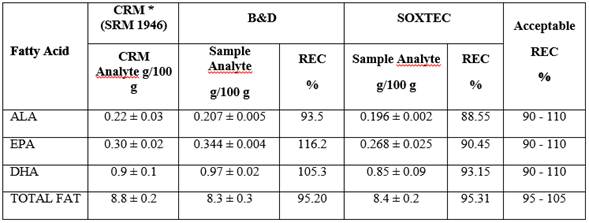
Accuracy assessment was conducted from CRM (SMR 1946) with known FA concentrations and the value found was compared to the known value; it was prepared in triplicate and analyzed by the same analyst. Accuracy is reported as ALA, EPA, DHA, and Total Fat recovery percentage (REC%) expressed as FA equivalents. Table 1. The REC% of 116.2% for EPA, can be for systematic errors by high sample handling or the presence of interfering co-eluting with the fatty acid.
Selectivity
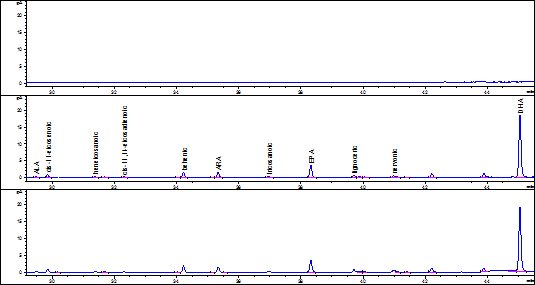
According to the accuracy results, the fish fat extraction and FA quantification method selected was Bligh & Dyer. For selectivity assessment, the issue sample used was commercial tuna fish in oil submitted to two simulated degradation processes; one, on a stove at 100ºC for 24 hours and the other ultraviolet light exposure for 24 hours. Degradation assessment was determined comparing the chromatography profiles obtained by stressing, not stressing, and solving the product samples. Figures 1 and 2 show the chromatograms obtained from the samples with and without treatment.
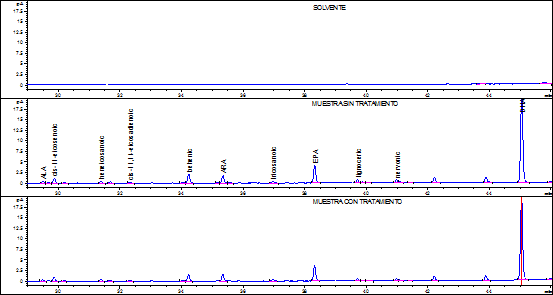
Figure 1 Solvent chromatography profiles, tuna fish sample without treatment, and tuna fish sample on a stove at 100ºC.
Linearity and Range
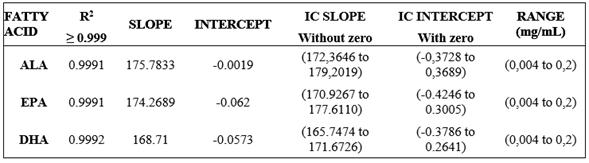
The linearity of the method was verified at six concentration levels of the Food Industry FAME MIX Standard. Each level was assessed in triplicate. The regression line was found using the “least square” adjustment method. Statistically it is verifies that the slope is nonzero by Student t-test with n-2 degrees of freedom and a significance level (α = 0.05) compared to the weighted value required; and then your confidence interval (CI (b)), which must not include the zero is determined, likewise, it is verified that the line passes through the origin of coordinates determining that the intercept is significantly different from zero through test t-Student with n-2 degrees of freedom and a significance level (α = 0.05), compared with the weighted value required; and then your confidence interval (CI (a)), which should include zero is determined. Table 2 shows the linearity assessed criteria, where (R2) ≥ 0.999 correlation coefficient, the confidence interval for the slope (ICb) does not include zero and the confidence interval for the intercept include the zero in the assessed range for each FA.
Precision
Precision was assessed as the instrumental system repeatability and the intermediate precision expressed as the relative standard deviation percentage (RSD%) using commercial tuna fish in oil as sample.
For the assessment of the repeatability of the instrumental system, the issue sample was prepared in sextuplet and each sample was injected in triplicate. It was determined for each sample that RSD% were ≤ 5%. Table 3.
Table 3 Precision: Repeatability given in Standard Deviation (SD) ± mean value
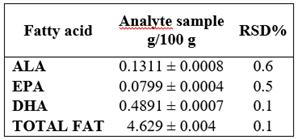
RSD%: Relative Standard Deviation Percentage
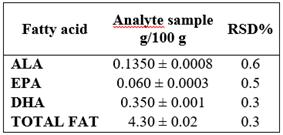
For the assessment of the intermediate precision, two analysts worked separately, in different days, and the specification for this parameter is that RSD% between analysts is < 5%. Table 4.
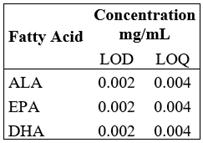
Detection and Quantification Limit
The limit of quantification (LOQ) determination was taken from the standard FAME Mix successive dilutions until the minimum analyte amount that could be quantifiable with acceptable accuracy and precision under the set experimental conditions. For the determination of the limit of detection (LOD), standard dilutions were continued until the minimum analyte amount that could be detectable. Table 5.
Discussion
Two methods fat extraction from fish were compared using a CRM and although a more modern method SOXTEC it was determined that the most accurate method for fish samples was the one proposed by Bligh & Dyer in 1959, because it yields better recovery percentages and shows very low variations between measures; it is also the faster method that allows assessing large numbers of samples in less time with low volumes of waste.
In general, these studies’ results are close to 100% with < 5% RSD%, which makes them comparable to studies that used other extraction and derivation methods. In this study, results obtained by both methods (B&D and SOXTEC) are comparable with data from the aforementioned studies. Among the most widely used methods for fat extraction from fish, there is B&D 18,19 and SOXTEC is another method used to extract fat not only from fish but from different matrixes; both methods are considered accurate and precise 13. When comparing the fat extraction from fish methods, the CRM recovery percentage was taken as indicator. For the B&D method, 93.5%, 116.2%, 105.3%, and 95.2% ALA, EPA, DHA, and total fat were obtained, respectively. For the SOXTEC method, they were 88.55%, 90.45%, 93.15%, and 95.31% for ALA, EPA, DHA, and total fat respectively with RDS% results that never exceeded the 5% set as the limit to assess data, indicating that both methods are accurate. Similar data was reported by Zhang et al. while developing and validating a method to quantify FA from standard solutions, where ALA REC% was 93.2% with a 1.22% RSD% 20. In the Juárez et al study, it was also found that for the FA quantification validation method through GC for seafood like fish, shrimp, and clam, samples were contaminated with standards, a 90.8% ALA, 90.8% EPA, 93.9% DHA, and average REC% were reported with average RSD% of 3% ALA, 3.54% EPA, and 3.27% DHA 21. Although a REC% over 100% for EPA was obtained, there are several reasons why this may occur: the extraction method Bligh and Dyer, is a completely manual method compared to acid hydrolysis therefore can introduce errors systematic by the method or the operator, another is the presence of interfering co-eluting with the fatty acid. Nevertheless, according to the REC%, B&D was the most accurate method, so it was the selected technique for fat extraction from fish, allowing to quantify the FA profile in a more accurate manner. Additionally, it is a faster and environmentally friendlier method that takes a 15 min treatment per sample with an average generation of 20 mL of chemical waste, allowing the processing of a large number of samples, simultaneously.
For the selectivity parameter, it was found that samples under the aforementioned stress conditions, allowed the complete separation of each analyte, indicating that the specific retention times of each FA and the resolution of the chromatography peaks were not affected by the treatments. Additionally, the solvent chromatogram does not have any sign whatsoever that might affect the identity of the analyte, demonstrating that the results were not affected by the warm up temperature during the FA-to-FAMES derivation process or by the ultraviolet light.
The linearity and range parameters of the method, a determination coefficient (R2) was obtained for every variable, > 0.999, evidencing a direct proportion of the variation of the concentration explained by the obtained mathematical model. For the linearity test, for n = 18, the tabla = 2.12 (n-2 tabla = 16, 0.05%), for all analytes, texp >> tabla, the null hypothesis is rejected that there is no direct relationship between the analyte concentration and the response by the sensor, then the slope is significantly different from zero and shows linearity. The trust intervals for the curve slopes do not effectively have the zero, ALA (172.3646 to 179.2019), EPA (170.9267 to 177.6110), and DHA (165.7474 to 171.6726).
For proportionality test for n = 18, the ttabla = 2.12 (n-2 Ttabla = 16, 0.05%), for all texp <ttabla analytes thus proportionality exists, the line passes through the origin and the IC contains zero ALA (-0.3728 to 0.3689), EPA (-0.4246 to 0.3005), and DHA (-0.3786 to 0.2641), and the trust intervals for the intercepts contain the zero, showing that the peak areas respond proportionally to variable concentration changes. Therefore, the quantification method applied to the study showed greater sensitivity when compared to the R2 results from other authors that report R2 of 0.9979 for ALA, 0.998 for EPA, and 0.9987 for DHA 21 The work range for ALA, EPA, and DHA PUFA, was defined from the linearity assessment curve, being 0.004 mg/mL and 0.2 mg/mL.
The method precision for repeatability indicated the RSD% for each variable: ALA (0.6228%), EPA (0.5035%), DHA (0.1381%), and Total Fat (0.0867%), as well as the intermediate precision assessment between analysts, where RSD% were ALA (0.6257%), EPA (0.5397%), DHA (0.3180%), and Total Fat (0.3401%); both levels showed they do not exceed 1%, evidencing the assessed method is precise. On the contrary, in Juarez et al. study 21, the method used shows RSD% of 3% for ALA, 3.54% for EPA, and 3.27% for DHA for repeatability and 5.53% for ALA, 5.33% for EPA, and 5.41% for DHA, between days. More elevated values presented by Aldai (23) who obtained an average RSD% value of 12.66%, 15.37%, and 17.24% for ALA, EPA, and DHA, respectively. Data obtained in this validation for the accuracy of the method is due to the fact that every device was calibrated before the study, reactive elements was analytical grade, special care was taken with the preparation of the solutions, and experienced analysts were in charge.
LOQ and LOD were estimated from the FAME Mix standard solution dilution, showing that the curves kept a linear behavior until the 0.004 mg/mL concentration defined as LOQ; dilutions were immediately conducted to determine the minimum concentration detected by the equipment, which was 1:2 dilution, so LOD was 0.002 mg/mL.
Although the recovery percentages by the Bligh And Dyer method were closer to 100% compared to the SOXTEC method, the disadvantage of this, is that the extraction process is completely manual and can introduce errors by the analyst, which leads that the method of extraction must be a controlled process and be performed by trained personnel. However, it is an excellent option as an alternative method and is very useful when small amounts of sample are used, so the volume of solvent depends on the amount of sample.
Conclusions
The most accurate method for fish samples was the Bligh & Dyer 1959, because it yields better recovery percentages and shows very low variations between measures; it is also the faster method that allows assessing large numbers of samples in less time with low volumes of waste.
The validation of the quantification method was conducted using a standard FAME Mix solution with commercial tuna. It was found that this method complies with accuracy parameters because the response varies very little regardless the analyst and the number of samples, because a recovery rate over 95%. It also shows a high relation between the FA concentration present in the sample and the chromatogram response area. Additionally, it was found that the method has a wide quantification spectrum that allows assessing samples with contents rich in fat, as well as lean samples. Samples submitted to the aforementioned stress conditions, allowed full separation of each analyte and, besides, in the solvent chromatogram used, there are no signals that may affect the analyte identity. Therefore, the method is selective.
It is concluded that the B&D method and GC allow accurate and precise quantifications of PUFA in fish.

