


 English (pdf)
 Article in xml format
 Article references
 Send this article by e-mail
 Cited by SciELO
  Cited by Google
  Similars in
SciELO
Similars in
SciELO  Similars in Google
 Permalink
INTRODUCTION
In the food industry the use of additives allows to increase the shelf life of products, counteract bacterial degradation, provide attractive colors to food, and enhance the perception of flavors and scents, among others 1,2. Stevia is an additive classified as a non-caloric sweetener, which has been extensively studied in countries such as Japan and the Far East 3, and it is highly consumed in in The United States and China 4. Stevia used in beverages, chewing gum, baked goods, yogurt, as toothpastes components and mouthwashes. It is used as a sweetener in liquid, powder or tablets 5. Within its composition, stevioside is the main component of stevia, which is characterized by its sweetening power, which is from 250 to 300 times sweeter than sucrose. It is known that the main disadvantage of stevioside is its bitter taste, undesirable factor for direct applications in food matrices 6).
A viable alternative in order to hide the bitter taste of stevioside, for use in foods, could be the technology called encapsulation by double emulsion followed by complex coacervation. The technique refers to the process by which after the formation of a simple emulsion containing the component to be encapsulated, a double emulsion is formed, emulsion which is formed by adding two polymeric materials generally a polysaccharide and a protein, and appropriate emulsifiers.
Subsequently, by pH change, a phase separation occurs spontaneously, and the coacervate is formed. The coacervate is formed by the electrostatic interactions between the polymers of the wall material is formed, which causes formation of an insoluble gel state called capsules, microcapsules, nanocapsules or, depending on their size. The encapsulation process by complex coacervation ends with the coacervate dehydration, which confers stability to the capsules 7. The formation of the double emulsion can be water-oil-water type (W1/O/W2) or oil-water-oil type (O1/W/O2) 8.9,10,11.
Through this technique functional compounds can be encapsulated 12,13. Additionally that technique allows preparing micro and nanocapsules, which can be found in a solid or semisolid form, likewise allowing the controlled release of active substance from the internal phase to the external phase 13,14. Among the studies related to encapsulation technique by double emulsion system and complex coacervation applied to foods, aspartame microencapsulation has been studied 15 and other sweeteners 16,17, the same way encapsulation form of casein hydrolyzate 18, microencapsulation of ascorbic acid 19, microencapsulacion carotene β 20, encapsulation of hydrolyzate collagen 21, tuna oil encapsulation 22, peptides casein 23, applications of this technique for the meat industry 24 and microencapsulation of steviol glycosides 25. How-ever, studies for stevia by encapsulation using the mentioned technique have not been reported so the objective of this research was to evaluate the potential of the double emulsion system followed by complex coacervation in stevia encapsulation. The technology efficiency was measured by the size and shape of the capsules, and by measuring the encapsulation capacity.
MATERIALS AND METHODS
Materials
Stevia powder was used (Natursweet ipf, China) as the active compound. Commercial sunflower oil to form the first emulsion (oil phase). Soy lecithin of high viscosity as the lipophilic surfactant. Gelatin ‘E441’ (Progel, Colombia) and arabic gum (TOUR, Colombia), as components of the wall material capsule.
Elaboration of double emulsion system and stevia encapsulation by complex coacervation
An adaptation of the methodologies used by Rocha et al., 2013 15 and by Santos et al., 2015 17 was performed, who encapsulated aspartame and xylitol by double emulsion followed by complex coacervation, respectively. 8 treatments in triplicate were performed, in which stevia was encapsulated up to four concentrations, 3.5; 5; 7.5 and 10% p/p, and two concentrations of wall material, 2.5% and 5% p/p. Additionally, a control treatment was per-formed, in which stevia was not incorporated. For treatments with wall material concentration of 2.5% it was necessary to use nomenclatures ES1, ES2, ES3, ES4, respectively corresponding to the concentrations 3.5; 5; 7.5 and 10% stevia. For treatments where 5% of concentrations of wall material were used, the corresponding nomenclatures ES5, ES6, ES7 and ES8, were used respectively to the concentrations 3.5; 5; 7.5 and 10% of stevia. Aditionally, a control treatment (ES0) was performed which was developed the same as the ES1 treatment with the difference that the internal solution containing stevia was replaced by distilled water.
For the preparation of active compound, stevia solutions of 3.5, 5, 7.5 and 10% (p/p) were prepared. The solutions were stirred with a magnetic stirrer (MR Hei-Standard, Heidolph) at 28°C, until complete dissolution. As emulsifier lecithin was used in a ratio of 5g of soy lecithin/100g of the total amount of stevia, which corresponded to 0.175g, 0.25g, 0.375g and 0.5g of lecithin, for stevia concentrations 3.5; 5; 7.5 and 10% p/p respectively. Each amount of emulsifier was added to 100 mL of sunflower oil, the mixtures were stirred in Ultra-Turrax (LSK High Shear Mixer, New York) at 3000 rpm for 1 min. To prepare the first emulsion, to 100 mL of sunflower oil plus emulsifier mixture, 100 mL of stevia (at each concentration) were added. Mixtures were stirred in Ultra-Turrax at 5000 rpm for 3 min and the first emulsions were obtained.
The wall material was prepared with arabic gum and gelatin in the ratio 1:1. For the first concentration of wall material 2.5% (p/p), 2.5g of arabic gum and 2.5g of gelatin were weighed, then to 100 mL of distilled water were added each and stirred magnetically to 50°C until completely dissolution and the two solutions were mixed, the final mixture was added to the first emulsion. The same procedure was used for concentration of 5% (p/p).
To prepare the double emulsion and form the coacervate, the first emulsion was added 200 mL of wall material, using a 1:1 ratio in each treatment. The emulsions were stirred in Ultra-Turrax at 3000 rpm for 2 min. Thereby obtaining the double emulsion. The emulsion was adjusted to pH 4.0 with citric acid 0.5% (v/v), causing the formation of the coacervate, which was presented in gel form. Treatments were carried by cooling at 4°C for 24h, time in which complete separation of the two phases and formation of a firm gel was obtained.
The aqueous phase formed due to the desolvation of the polymer, was discarded. Finally, the gels obtained from each treatment were placed in Petri dishes (three dishes per treatment with 6 cm diameter) with approximately 50 mL each. Petri dishes were frozen in ultra-freezer (NEW BRUNSWICK-U101, England) for 6h at -56°C, and they were lyophilized at 0.110 mbar vacuum pressure, and -80°C in the condenser (Labconco, USA).
Morphology of the capsules
Before and after the lyophilization stage, a morphological observation of the capsules was conducted using the methodology Rocha et al. (2013) 15, and Santos et al. (2015) 17. An optical microscope (Nikon Eclipse E200, TV Lends 0.55X DS, Japan) was used. In order to determine the morphology of the capsules prior to lyophilization, samples of the gel were taken and placed on slides, which was focused with 10X objective. Microscopic images were taken by Optika Vision Pro software. To determine the morphology of the lyophilized capsules, samples were diluted in distilled water to 2% p/p, and then the images were captured, as mentioned above. Images were processed in software image1.48v.
Capsules size
The measurement of capsule size was performed by Zetasizer (Zetasizer Nano S90 Malvern, New York), for capsules before lyophilization, since the device measures sizes of capsules of diluted emulsions (liquid state), and by optical microscopy (Nikon Eclipse e200, TV Lends 0.55X DS, Japan) for lyophilized capsules. The Zetasizer equipment was calibrated by adding 2 ml of distilled water in the reading cell subsequently taken from 1 mL samples of each treatment were diluted in 250 mL of distilled water, 2 mL were placed the solution in a cell reading, and the average values obtained directly the size of the capsules by malvern Zetasizer software V7.03 18.
For microscopic measurement, in lyophilized samples, the Optika Vision Pro software was calibrated with micrometric ruler, which allowed making measurements of diameter based on geometry (circular or ovoid). For this study, the capsule diameter was measured in referenced to the circular geometry. For this, 1g of lyophilized capsules in 20 mL of distilled water was dispersed; drops of the solution were taken on a slide and observed by optical microscope, with 10X objective. Statistical analysis graphs were obtained, which were identified as: diameter of capsules before lyophilising (DCBL), diameter of lyophilized capsules (DLC) and wall material (WM).
Fourier´s transformed infrared spectroscopy (FT-IR)
Encapsulation capacity of infrared spectrometry Fourier transform was measured directly in the lyophilized product by using an infrared spectrometer (PIKE MIRacle™ coupled to Spectrum Two FTIR Spectrometer, Madison), which yielded curves with the characteristic peaks of the encapsulated component. From these curves, the software produced a percentage interpreted as encapsulation capacity, which was calculated by the difference between the areas under the curves of the unencapsulated component (stevia) and the encapsulated component (capsules).
In order to do this, 0.1 g of lyophilized capsules was taken and placed on the tip of the equipment reader, the needle was adjusted and the reading was performed using the software PerkinElmer Spectrum™10 coupled to the computer. The graphs obtained were analyzed in software Nero Photos-nap Wewer, based on wavelengths in the range of 600 cm-1 to 4000 cm-1, methodology adapted of Rocha et al. (2013) 15.
Water activity (a w ) of the capsules
aw was measured to lyophilized capsules of each treatment by a team Aqualab (AQUALAB-SERIES 3TE, USA) previously calibrated.
Solubility of capsules
The solubility was measured in lyophilized capsules. 0.5 g samples were taken and diluted in 50 mL of distilled water. The solutions were homogenized in a shaker (MR Hei-Standard. Heidolph) at 50 rpm for 30 min at 28°C. Subsequently, the solution was centrifuged (eppendorf centrifuge 5804R, Germany) to 1369550g during 5 minutes in 25 mL Falcon tubes. Capsules that did not solubilized were separated from the aqueous phase and transferred to a pre dried and weighted porcelain capsule, and subjected to drying at 105°C, until constant weight was reached 15. The solubility was calculated by Equation (1).
 (1)
(1)
Where, initial weight corresponds to the weight of the dried capsules. The final weight corresponds to the weight of the dried not solubilized capsules. Statistic analysis A completely randomized multi-level factorial design with 2 factors was used. First factor concentration of stevia, with 4 levels of concentration: 3.5, 5, 7.5 and 10% (p/p). Second factor concentration of the wall material, with two concentration levels 2.5 and 5% (p/p). Treatments were performed in triplicate, for a total of 24 treatments. The response variables were: encapsulation capacity, capsule size (measured in light microscopy and zetaziser), solubility and water activity. Data were analyzed by an ANOVA, using lineal regression model in Minitab software versión17. Tukey test was used in software InfoStat, version 2015, in order to compare treatments. The results were considered statistically significant at P <0.05.
RESULTS
Stevia capsules morphology before and after the lyophilization stage (optical microscopy)
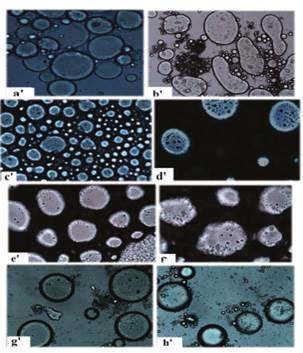
In Figures 1, 2 and 3 the distribution, shape and geometry of the capsules of all treatments can be identified. Figure 1 shows the micrographs of control treatment capsules (ES0), before and after lyophilization. Figure 2 shows the micrographs a, b, c, d, e, f, g and h of the capsules of stevia corresponding to the treatments ES1, ES2, ES3, ES4, ES5, ES6, ES7 and ES8 before lyophilization. In Figure 3 micrographs a’, b’, c’, d’, e’, f’, g’ and h’ of stevia capsules after lyophilization are presented.
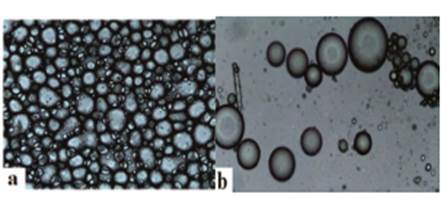
Figure 1 Micrographs of capsules without addition of stevia (control treatments, ES0). a) Before lyophilization. b) After lyophilization, taken with an optical microscope (TV lends 0.55X DS Nikon-Japan)
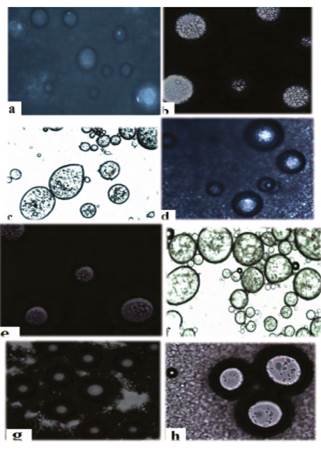
Figure 2 Micrographs of stevia capsules before lyophilization. Taken with optical microscope (TV lends 0.55X DS Nikon-Japan). a, b, c, d, e, f, g and h refer to the ES1, ES2, ES3, ES4, ES5, ES6, ES7 and ES8 treatments (see text nomenclature).
Capsule size before and after lyophilization
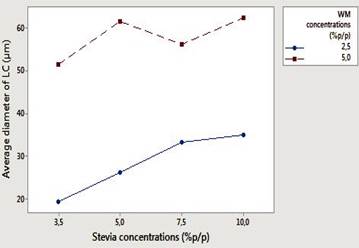
Table 1, shows the means values (8 treatments each triplicated) capsule size (nm) before and after lyophilization. In figures 4 and 5 the interaction graphs are shown for capsules before and after lyophilization respectively, of the response variable capsule size, in relation to the variation of the stevia (3.5, 5, 7.5 and 10% p/p) and WM concentrations (2.5 and 5% p/p).
Table 1 Capacity of encapsulation (%), average size of capsules before lyophilization (nm) and lyophilized capsules (µm). The values reported correspond to the averages of three repetitions
| Treatments | SCE (p/p) | WMC (p/p) | Encapsulation capacity (%) | Capsule size before lyophilization (nm) | Lyophilized capsule size (µm) |
|---|---|---|---|---|---|
| ES1 | 3,5 | 2,5 | 72.060±4.193b | 992.997±0.073d | 19.393±0.743d |
| ES2 | 5,0 | 2,5 | 82.563±2.676a,b | 1074.800±0.115d | 26.248±2.595c,d |
| ES3 | 7,5 | 2,5 | 80.556±4.633a,b | 1429.667±0.065d | 33.170±3.683c |
| ES4 | 10,0 | 2,5 | 60.676±2.421c | 2555.667±0.147b,c | 34.998±2.322c |
| ES5 | 3,5 | 5,0 | 74.653±5.041a,b | 2177.333±0.117c | 51.456±2.422b |
| ES6 | 5,0 | 5,0 | 84.371±4.041a | 2941.000±0.171b | 61.453±1.652a |
| ES7 | 7,5 | 5,0 | 51.777±2.267c | 4192.000±0.297a | 56.072±4.236a,b |
| ES8 | 10 | 5.0 | 52.077±4.660c | 4326.333±0.292a | 62.329±6.654a |
Where different letters in the same column indicate statistically significant differences between mean values (P <0.05). The letters a, b, c and d refer to the difference in capsule size, starting from smaller size (a) to larger size (d).
SCE: stevia concentration to encapsulate. WMC: wall material concentration. ES1, ES2, ES3 and ES4: Treatments corresponding to 2.5% of wall material and stevia concentrations of 3.5; 5; 7.5 and 10% p/p. ES5, ES6, ES7 and ES8: Treatments corresponding to 5% of wall material and stevia concentrations of 3.5; 5; 7.5 to 10% p/p.
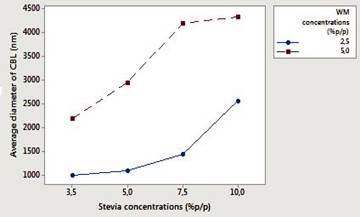
Figure 4 Interaction effect (capsules before lyophilization) among the factors concentration of stevia (3.5; 5; 7.5 and 10% p/p) and concentration of wall material (2.5% and 5% p/p), for the response variable capsule size (see nomenclature graphic text).
Fourier´s transformed infrared spectrometry (FT-IR)
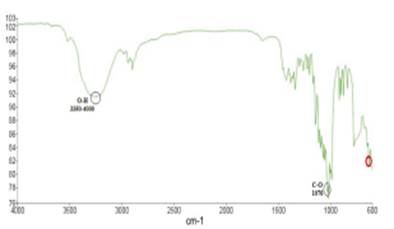
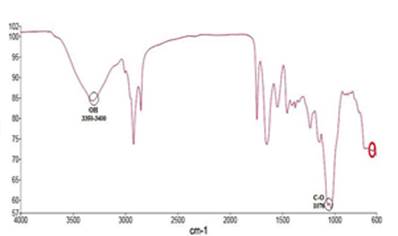
In Figures 6 and 7 shows respectively, the graphical representations of the spectra of stevia powder unencapsulated and that of the treatment with higher encapsulation capacity (ES6) obtained in infrared spectrometry
Water activity (a w )
Table 2 shows the means values (8 treatments each one triplicated) of solubility (%) and water activity (aw) after lyophilization, of the 8 treatments and the control treatment ES0.
Different letters in the same column indicate statistically significant differences between mean values (P <0.05). Temperature range in measuring aw 24.5oC to 26.4oC. (Nomenclature see Table 1).
Table 2 Solubility (%) and water activity of lyophilized microcapsules. The values correspond to the averages of repetitions
| Treatments | Concentration stevia (p/p) | Concentration WM (p/p) | Solubility | a w |
|---|---|---|---|---|
| ES0 | 3,5 | 2,5 | 25.715±2.112 | 0.588±0.019 |
| ES1 | 3,5 | 2,5 | 24.849±1.111c | 0.505±0.006 |
| ES2 | 5,0 | 2,5 | 28.268±1.378b | 0.564±0.020a,b |
| ES3 | 7,5 | 2,5 | 34.484±0.481a | 0.563±0.013a,b |
| ES4 | 10,0 | 2,5 | 33.237±1.157a | 0.576±0.008a |
| ES5 | 3,5 | 5,0 | 17.653±0.909e | 0.516±0.013b.c |
| ES6 | 5,0 | 5,0 | 19.723±1.337d,e | 0.528±0.031a,b,c |
| ES7 | 7,5 | 5,0 | 21.809±0.399d | 0.495±0.010c |
| ES8 | 10 | 5.0 | 24.660±0.572c | 0.519±0.026b,c |
DISCUSSION
Stevia capsules morphology
For the control treatment (Figure 1), in the micrograph a agglomerated homogeneous capsules of defined morphology are observed. In contrast, in micrograph b scattered round capsules of varying diameters are observed. Figure 2 shows capsules before lyophilization, which depict round morphologies (mostly), evidencing the incorporation of small droplets into globules. Each micrograph differs in terms of shape, size and number of capsules, and in turn these are different from the control treatment (Figure 1). This is evidence that the morphology of the capsules is affected by the concentration of stevia, and the concentration of wall materials.
In Figure 3, capsules after lyophilization are observed. In the micrographs a’, d’, g’ and h’, few drops incorporated into the capsules are observed. This is because lyophilized capsules were stirred when hydrating causing size reduction of the capsules, which led to the destruction of the globules formed, facilitating the loss of their structure and allowing the release of encapsulated sweetener. Micrographs identified as e’, f’, g’ and h’, retained the configuration of the external layer. In treatments with higher concentration of stevia (7.5 and 10% p/p) and low concentration of WM (2.5% p/p), well defined capsules in shape, geometry and distribution were obtained.
Similar behavior was presented at low concentrations of stevia (3.5% and 5% p/p) and high concentrations of WM (5% p/p). Similar micrographs were reported in ascorbic acid coacervate capsules 19 and aspartame 15, likewise, in double emulsion systems stabilized with polysaccharides 26. Furthermore, it is reported that the destruction of the capsules can lead to the release of the active ingredient 27, and this would explain the behavior of treatment ES2.
Capsule size
The sizes of the capsules before lyophilization were the size of nanometers, where the smallest corresponded to the ES1 treatment (Table 1), value that increased as the concentrations of both stevia and concentrations of WM increased, reaching larger diameter ES8 capsules treatment. The size of the lyophilized capsules was micrometric. The treatment group (Tukey) indicated that measurements on optical microscope showed similar behavior to that obtained by Zetasizer. Increase in the size of the lyophilized capsules both in treatments as in the standard sample, is because the capsules before lyophilizing formed a very firm gel, while after lyophilization, the capsules were diluted in distilled water, reason why, capsules increased their volume, dispersed and destroyed because of agitation.
Figures 4 and 5 shows that before and after lyophilization, the capsule size was greater as greater the concentration of stevia (10% p/p), and the greater the concentration of WM (5% p/p) were. ANOVA indicated statistically significant differences between treatments (P<0.05), showing greater variation for capsules formed before lyophilization. The graphs (Figure 4 and 5) show that, within the concentrations tested, there was not interaction between factors, however, it is predicted that the diameters of the capsules prior to lyophilization will be greater and presented effect of interaction between the factors for stevia concentration greater than 10% p/p. From the results it is inferred that the conservation by lyophilization, allows to stabilize the capsules, since the drying process gives the capsules rigidity and firmness, properties essentially strengthened in the wall material, thus allowing to establish a selective diffusion of the encapsulated component. In the encapsulation of flavors and sweeteners, small sizes of capsules provide a delay in the diffusion of the component 14,17,28,29.
The capsule size allows establishing whether or not the capsules will be detectable by the human palate. Martín et al. (2009) 30, mention that an average size particle diameter (range of 15 µm to 100 μm) is desirable because larger sizes to 100 μm may be detectable in the mouth, and sizes smaller than 15 µm, do not provide sufficient protection against external factors. Knowing the component to be encapsulated 31,32, and the wall material 12, are indispensable, as they are determining factors in the size of the capsule. Other important factors are speed and stirring time, pH determination of the coacervate and homogenizing mechanism 33,34,35. Moreover, Perez et al., (2011) 36, and Zhang et al., (2005) 37, indicate that the variation in the sizes of the capsules formed is mainly due to the degree of interaction between the polymers achieved. In addition, size variation depends on the technique and methodology used for the preparation of capsules 29,38,39. Studies conducted in microencapsulation of functional components report means capsule sizes obtained by double emulsion (before lyophilization) of 84.22 µm to 102.38 µm 15. In the ascorbic acid encapsulation, Comunian et al., (2013) 19, report diameters of capsules before lyophilization of 26.59 µm to 63.11 µm and after lyophilization diameters of 51.67 µm to 83.82 µm.
Fourier´s transformed infrared spectrometry
Table 3 shows the values of wavelengths of the characteristic functional groups of a commercial reference sample stevia powder reported according Bravo et al., (2009) 40. It also shows the spectrum obtained by Moreno & Solano, (2008) 41 in the characterization of stevia extract in plant biomass. In reference to the values of Table 3 the points where the presence of the characteristic functional groups of encapsulated stevia identified were located.
Table 3: Fourier´s transformed infrared spectrum in commercial stevia biomass extract.
| Spectrum FT-IR of commercial stevia pow- | Spectrum FT-IR of plant biomass of stevia | ||
|---|---|---|---|
| der stevia (Bravo et al., 2009). | (Moreno & Solano, 2008). | ||
| Frequency (cm) | Functional Group | Frequency (cm) | Functional Group |
| 3350.07 | O-H | 3400 | OH |
| 2929.98 | C-H | 2926 | C-H (group CH3) |
| 1727.99 | C=O | 1627 | C-C aromatic |
| 1447.90 | C-H | 1421 | C-H (group CH2) |
| 1074.52 | C-O-C | 1076-1005 | C-O |
Through FT-IR analysis the encapsulation capacity of stevia was obtained, which by ANOVA variance analysis reported that each level assessed presents statistically significant differences for P<0.05. The percentages of encapsulation capacity of this study were compared to yield percentages reported in recent studies, finding lower results in the encapsulation of aspartame with 71.70% 15, in the microencapsulation of lycopene with yields from 56.7% to 65.3% 7. Very similar results re-ported in the microencapsulation of β-carotene with 82.51% 20. Higher yields were obtained in the encapsulation of drugs such as indomethacin (96.3%) and sodium diclofenac (85.66%) 27. While other studies evaluate the encapsulation technique by double emulsion followed by complex coacervation in terms of efficiency 19.
Martín et al., 2009 30, mention that it is possible to obtain round microcapsules with sizes up to 4 µm and with a 90% of the active material incorporated at the end of the encapsulation process. Madene et al., 2006 28 indicate that between encapsulation processes, the technique of complex coacervation allows to incorporate functional compounds in microcapsules in order to provide protection to the encapsulated principle, hence the importance of encapsulating stevia in order to conceal the bitter taste that this component presents 6.
The spectra in the infrared region may vary according to the main components present in the extracts of stevia, however, peaks have been identified representing the presence of some functional groups of stevia for certain wavelengths 41, as shown in Table 3. Thus for the present study was obtained the Figure 7, in which the O-H functional group was identified to a range of wavelength 3350 cm-1 to 3400 cm-1 as reported by Moreno & Solano, 2008 41 and Bravo et al., 2009 40, similarly, the representation of the C-O group in the region of 1076 cm-1 was obtained, in which for a more pronounced peak reference is made to the presence of stevioside, while if the peak is shorter is because of the presence of rebaudioside A. The specification is met when the values are reported in % of transmittance 42. Furthermore, the formation of the located peaks between 1500 cm-1 to 1640 cm-1 is noticeable, which represent amides groups, formed by interaction between the carboxyl groups of the gum and the amino group of the protein, thus confirming the formation of the coacervate 15. Finally, the point marked in the 650 cm-1 region is mentioned to be part of any component of the stevia but has not yet been identified with certainty the type of glucoside present 42. In Figure 6 the representation of the spectrum for stevia unencapsulated was obtained which was taken as reference and served as the base to identify analogies regarding Figure 7.
Water activity (aw)
In the variable aw no significant statistically differences between treatments ES2, ES3 and treatments ES5, SS8 (P<0.05) were shown. As for the values reported in Table 2, it can be inferred that lyophilized microcapsules reached a range aw between 0.495 and 0.576, which shows that the microcapsules of stevia are stable against degradation mechanisms, since it is reported that with aw minor or equal to 0.6, microbiological stability is guaranteed 19. Very close values were obtained close to the one re-ported in ascorbic acid encapsulation (0.318-0.515) and lower values in the encapsulation of lycopene (0.26 to 0.29) 7.
Microcapsules solubility
The property of solubility in lyophilized microcapsules was evaluated in order to establish their behavior when added in water, as shown in Table 2, statistically significant differences (P<0.05) between concentration levels of stevia and in the concentration levels of WM were obtained. Furthermore, there was a significant increase in the solubility as the concentration of stevia increased, which is due to the high degree of solubility of the stevia in its pure state 4, so that greater quantities of stevia favor the interaction with hydrophilic molecules and thereby improves its affinity with the aqueous medium, however, the microcapsules corresponding to treatments with a higher concentration of WM (ES5, ES6, ES7 and ES8) are less soluble which is related to encapsulation capacity when lower solubility greater capacity, as reported in studies of encapsulation of casein hydrolyzed 18 and encapsulation of xylitol 17. Moreover, Saravanan & Rao, (2010) 27 mention that the active components with high water solubility have less stability and rapid release compared to encapsulated insoluble compounds by complex coacervation. In the present study, it was found that the treatments ES5, ES6, ES7 and ES8 were less soluble in compared to the control and in turn to the ES1, ES2, ES3 and ES4 treatments. The solubility behavior percentage varied in relation to the concentration of WM, because the viscosity properties, solubility and emulsifying properties are favored when using gums and gelatins together and at high concentrations 28. In addition, interactions between biopolymers determine to some extent the stability of microcapsules formed by complex coacervation 29.
CONCLUSIONS
The morphological characteristics of the microcapsules, analysis by infrared spectrometry and properties such as capsule size, solubility and water activity allows to conclude that it is possible to encapsulate stevia by applying the double emulsion system (W/O/W) followed by complex coacervation. The treatment with morphological characteristics which showed the formation of droplets within the microcapsules and higher encapsulation properties capacity and lower solubility was the ES6 treatment, which allows concluding that low concentrations of stevia and concentration of 5% p/p of wall material, allows to decrease solubility and increase the content of stevia into capsules, favoring the incorporation of the sweetener.

