


 English (pdf)
 Article in xml format
 Article references
 Send this article by e-mail
 Cited by SciELO
  Cited by Google
  Similars in
SciELO
Similars in
SciELO  Similars in Google
 Permalink
INTRODUCTION
In the dry-cured ham process, the post-salting step consists in the penetration of ions of sodium and chloride inside the deeper areas of the ham 1, The rate of ions diffusion depends on the fat content of the ham, therefore the time of the step is variable 2. At the industrial level, the post-salting is empirically controlled by mass difference. Therefore, to quantify the salt content and diffusion in the ham it is necessary to carry out destructive determinations or the application of advanced and complex technologies, such as: computed tomography 3, magnetic resonance imaging 4,5, magnetic resonance microscopy 6. However, impedance spectroscopy is a low cost technique that has shown good results in the evaluation of meat products 7. It bases its operation on applying an electrical stimulus to the electrodes, observing its response and determining its properties, interactions and dependencies with certain factors 8. The electrical response may vary depending on: charges present, microstructure, texture, geometry and electrolytes. Electrical impedance measurements determine or infer information about the tissue, provided that the event under analysis presents a change in dimension, in its electrical properties or conductivity 9. The experimental procedure for measuring impedance spectroscopy consists on applying a small sinusoidal electrical signal (voltage or current) to an electrode and measure its response at different frequencies resulting in an impedance value for each frequency 10. The aim of this work was the application of impedance spectroscopy for the characterization of hams during the post-salting step.
MATERIALS AND METHODS
60 salted hams of three categories: fat, semi-fat and lean, were provided at different post-salting times (8, 10, 12 and 14 weeks) by a meat manufacturing company. The hams had a mean weight of 10.9 ± 1 kg and a pH between 5.7 and 5.9. At each sampling time electronic and physicochemical determinations were performed.
Analytical determinations
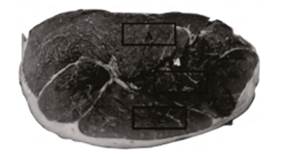
The analytical determinations were carried out on four zones obtained from a slice of approximately five centimeters of thickness extracted from the widest section of the ham as described in a previous work 11. The zones were: A, near the lean surface, B in an intermediate zone and zone C, near to subcutaneous fat (Figure 1). The R sample, represents whole of the piece, it was obtained from the grinded rest of the ham.
Changes in the total mass of the ham (ΔMt post-salting) throughout the post-salting step were estimated from the weight (M) of the ham (at sampling time t and 0) (Equation (1)):
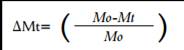 Equation
(1)
Equation
(1)
Moisture content was determined according to the Association of Official Analytical Chemists AOAC official method 12. Fat content was carried out by extraction in the Foss-Soxtec 2055® equipment with petroleum ether following the AOAC official method 12. Water activity (a w) was measured at 25°C from the grinded samples; a dew point hygrometer (DECAGON Aqualab CX-2®, ± 0.003, Pullman, WA, USA) was used. The salt content was quantified following the method described in Girón et al., (2015) 13. All determinations were done in triplicate. The total sodium chloride concentration in the liquid phase (z NaCl ) was estimated from the weight fractions of water (x w) and sodium chloride (x NaCl) (Equation (2)).
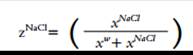 Equation
(2)
Equation
(2)
Electronic measurement
A low-cost, flexible, light, non-destructive measurement system was developed by the Interuniversity Research Institute for Molecular Recognition and Technological Development (IDM) at the Universitat Politècnica de València (UPV) 14. This impedance spectroscopy measurement system applies an electric signal to the sample and measures the response in a frequency sweep between 1 Hz and 1MHz, generating a sinusoidal signal, with an amplitude of up to 1 Vpp. The system consists of a software application that runs on a computer and the electronic equipment, doing a frequency sweep getting modulus and phase of impedance, for each frequency 256 points are calculated which correspond to the evolution of the signal. A Fourier analysis is executed in order to calculate the amplitude and phase, from this data, the software calculate the modulus and phase for all the frequencies. Frequency values of impedance spectroscopy used by other authors were taken into account 15,16. A double electrode was used, composed of two stainless steel needles 15 mm long and 1 mm in diameter, separated by a distance of 10 mm in a nonconductive frame previously used in other studies 17.
Statistical analysis
A multifactor ANOVA was conducted in the first part of the study for each physicochemical parameter to evaluate the effect of post-salting time, ham type, and sampling zone. The least significance difference procedure (LSD) was used to test for the differences between averages at the 5% level of significance. The data were statistically processed using Statgraphics Centurion XVI statistical package. (Manugistics Inc., Rockville, MD, USA).
Principal Component Analysis (PCA) was conducted in order to evaluate the electronic data. Partial least squares regression (PLS) was carried out in order to correlate the physicochemical information with the electronic measurements. The accuracy was given by the root mean square error for calibration (RMSEC), cross validation (RMSECV) and coefficient of determination (R2) for calibration (C) and cross validation (CV). Selection of the main frequencies was obtained from the iPLSDA genetic algorithm of interval selection (). All multivariate analyses were performed using PLS Toolbox 6.3 (MATLAB PLS Tool-box. Eigenvector Research, Inc., Wenatchee, Washington, USA).
RESULTS
Physicochemical characterization
At the end of the post-salting step, the mass variation (ΔMt post-salting) for each ham type showed an average value of -0.178 kg ± 0.007 fat, -0.200 kg ± 0.006 lean and -0.205 kg ± 0.004 semi-fat. Figure 2 shows the fat content of the samples at 8, 10, 12 and 14 weeks of post-salting
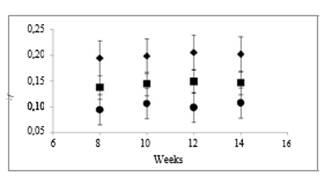
Figure 2 Mean values ± standard deviation of fat content (xf ) for the R zone at 8, 10, 12 and 14 post-salting weeks. Ham type: fat ((), lean ((), semi-fat (()
Figure 3 shows moisture content (x w, g/g), salt content (x NaCl, g NaCl/g), and water activity (a w) in A, B, C and R zones at 8, 10, 12 and 14 weeks of post-salting.
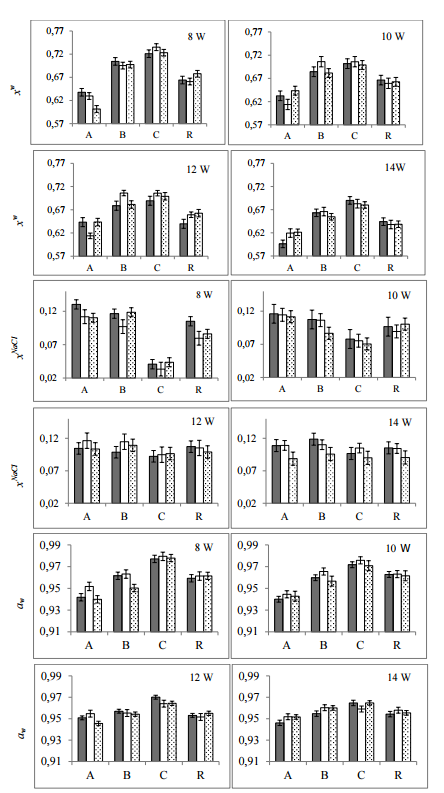
Figure 3 Mean values ± standard deviation of moisture (x
w), chloride (x
NaCl) contents and water activity (a
w) for each sampling zone and ham type: fat ( ), lean (□) and semi-fat (
 ) at four post-salting times, weeks (W).
Figure 4 shows sodium concentration values in the meat liquid phase (zNaCl) after 8, 10, 12 and 14 weeks of post-salting in zones A, B, C and R in the different ham types.
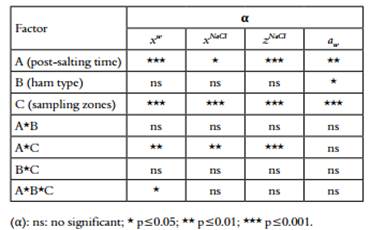
Table 1 shows the results obtained in the multifactor ANOVA for each physicochemical parameter
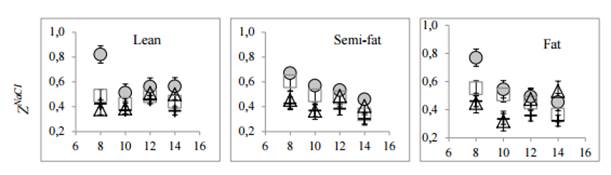
Figure 4 . Mean values ± standard deviation of sodium chloride concentration in the liquid phase (z NaCl) at 8, 10, 12 and 14 post-salting weeks. Zones: A (●) B (□), C (∆), and R (+).
Electronic measurements
Figure 5 shows the average values of the impedance response were measuring the different ham types for B zone, differences between the electronic responses of the three groups of hams tested are shown in both modulus and phase.
Figure 6 shows the PCA analysis of the electronic data (modulus and phase) in A, B, and C zones at 8, 10, 12 and 14 weeks of post-salting for the different ham types.
Table 2 shows the statistics values for partial least square discriminant analysis employing all the frequencies of impedance spectroscopy and selected by iPLS algorithm at eight and ten post-salting week.
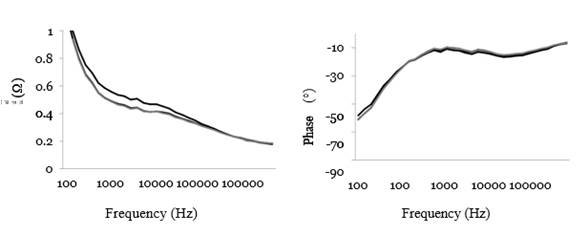
Figure 5 Bode plots for mean values for B zone four post-salting times of impedance measurements of modulus (left) and phase (right); for each ham type: fat (---), lean ( _ ) and semi-fat ( _ ).
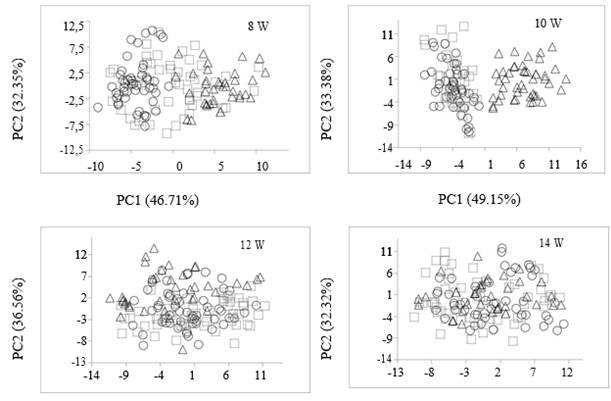
Figure 6 Principal components analysis (PCA) for the impedance signal with modulus and phase data for each post-salting time, weeks (W), zones: A (○), B (□), C (∆). in A, B, C and R zones at 8, 10, 12 and 14 weeks of post-salting.
Table 2 Statistics values for partial least square discriminant analysis employing all the frequencies of impedance spectroscopy and selected by iPLS algorithm at eight and ten post-salting weeks.
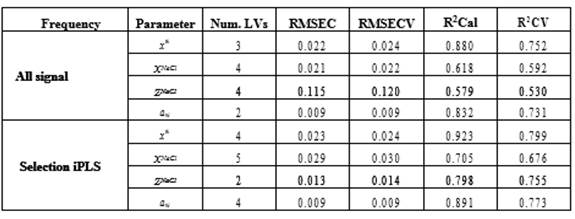
RMSEC: Calibration Root Mean Square Error, RMSECV: Cross validation Root Mean Square Error, R2Cal: Calibration Correlation coefficient, R2CV: Cross validation Correlation coefficient.
DISCUSSION
Mass variation (ΔMt post-salting) showed that fat hams presented smaller reduction of mass for each sampling time, compared to lean and semi-fat hams, similar values were found by other authors 19 for 50 post-salting days.
The fat content (x f) for each ham category was confirmed. Higher values were obtained for fat and semi-fat samples. There were statistical differences (p≤0.05) between lean and fat pieces. As expected, C sampling zone presented greater fat content than B and A zones; this is because zone C is located near the subcutaneous adipose tissue.
No significant differences were found for the moisture content among the post-salting times (p≥0.05). The average moisture content (zone R) decreased with time because of the drying process 20. The time and zone factors show significant differences (p≤0.05) as well as their interaction. Moisture values between different ham types for the same sampling zone presented significant differences (p≤0.05). The external zone (A) that is directly exposed to salt, and therefore its water content dropped rapidly 21 presenting the greatest variations. Values obtained for the salt content (x NaCl) were similar to those presented by other authors 22,23. There were significant differences (p≤0.05) between the sampling areas after the eighth and tenth post-salting weeks. These differences were reduced over time because of the diffusion process 24. Salt concentration at fourteenth week was same for all sampling zones. No significant differences were found for ham types (p≥0.05). In terms of a w hams presented the same behavior throughout the post-salting step. Sampling time, ham type and sampling zone influenced the water activity values (p≤0.05); factors interaction did not present significant differences (p≥0.05). Regarding salt concentration in liquid phase (z NaCl) (Figure 4), post-salting time and zone, and their interaction, were statistically significant (p≤0.05).
During the post-salting step the values of z NaCl and a w tend to be equal due to the salt transfer from the surface to the inner part of the ham, which is mainly due to the evaporation of the water, which allows salt uptake and changes in the moisture content 25,26. At the end of post-salting step (fourteen week) no significant differences (p≥0.05) were observed between sampling zones and ham types. Therefore, processing conditions for the tray salting and post-salting steps were correctly performed; nevertheless, a drying step is needed in order to obtain further reduction of moisture and a w values to ensure a good product.
Electronic characterization.
Electronic response (Figure 5) obtained for modulus showed a different signal for the lean hams compared to fat and semi-fat hams, the range of frequencies between 100 and 10000 Hz presented the highest difference for lean hams, differences diminished when comparing the phase measurements for the samples, similar results were found for A and C zones. The statistical analysis for the impedance signals showed a discrimination according to the sampling zones (A, B, C). However, the sensor was not able to classify the samples base on the ham type. Depending on the post-salting time, the signal could generate different groups. For eight and ten weeks (Figure 4) measurements of zone A were located on the left side of component one (46.71 and 49.15%), while measurements of zone C were located to the right side. At twelve and fourteen post-salting weeks, the discrimination observed in the previous weeks was reduced to disappear. The changes on the signal are also similar to those occurred on the physicochemical parameters that tends to an equilibrium on salt and moisture content between the sampling zones at the end of the post-salting 11. In order to explain the observed differences of the signal for eight and ten weeks, a PLS regressions were performed between the electronic information and the physicochemical parameters (Table 2). Moisture content (R2CV xw = 0.75) and the water activity (R2CV aw = 0.73) presented better statistical description, this fact agrees with other authors who had already studied the impedance spectroscopy (14, 27). With the purpose of improving the study, an iPLS selection (100 to 1000 Hz) was performed 28. All the physicochemical parameters presented better cross validation results. Moisture content (R2CV xw = 0.79) and water activity (R2CV aw = 0.77) shown the best performance from the evaluated parameters (Table 2). The impedance spectroscopy technique genera-ted different signals between the zones of analysis during the first two post-salting times, eight and ten weeks, in which physicochemical differences were also observed as a consequence of the variation in the salt concentration between zones. However, it is necessary to increase the research in this area to improve the obtained results, in order to develop a sensor to control the dry-ham manufacturing process and guarantees the consumers safety.

