


 English (pdf)
 Article in xml format
 Article references
 Send this article by e-mail
 Cited by SciELO
  Cited by Google
  Similars in
SciELO
Similars in
SciELO  Similars in Google
 Permalink
INTRODUCTION
World aquaculture production has been increasing continuously in the previous decades and has reached 158 million tons in 2012; 86% of the total production was directly used for human consumption 1. This increase has been largely due to the understanding that consumers have gained about the health benefits associated with the consumption of this type of food 2. This growth has generated important environmental impacts as aquaculture industries discard residues that correspond to between 40% and 60% of their total production 3-5. These residues are important sources of protein and mainly consist of filleting waste (15-20%), skin and fins (1-3%), bones (9-15%), heads (9-12%), viscera (12-18%) and scales (5%) 6. However, most of these discarded fish by-products have been used to manufacture low-value products, such as animal food, fish flour and fertilizers.
The methods that are being used to take advantage of these types of byproducts include hydrolysis, bioremediation, silage and filtration. Hydrolysis improves the quality and functional characteristics of byproduct proteins 9,10, and it has been employed mainly to obtain hydrolysated proteins with better nutritional characteristics and a greater contribution of bioactive compounds. These hydrolysates, apart from having an excellent equilibrium of amino acids, a rapid absorption and a good digestibility 11, also have fatty acids such as omega-3 12,13. These hydrolysates are a source of bioactive peptides that can confer biological benefits, such as high blood pressure control, antioxidants, immunomodulation, anti-stroke, and anticarcinogen, depending on the sequence and number of amino acids (frequently 2 to 20), (2, 8, 16). Additionally, enzymatic hydrolysis can modify the physicochemical properties of proteins, such as solubility, oil/water holding, foaming, and sensory properties 10.
Despite the invaluable contribution of kinetics to the area of enzymatic hydrolysis of fish proteins, there are very few studies involving the kinetics of these reactions (14) and even fewer involving protein hydrolysis of the viscera, which is a complex raw material due to the high levels of fat 17 and the interaction of this compound with proteins 18.
In the present work, the kinetic study of protein hydrolysis in red tilapia (Oreochromis sp.) viscera (RTV) using the alcalase enzyme is presented with the objective to evaluate the effect of the substrate and enzyme concentration on the percent of degree hydrolysis (DH) while maintaining the temperature and pH at a constant level.
MATERIAL AND METHODS
All chemicals used were of analytical grade. The viscera were supplied by the ecological park “El Gaitero” in San Jerónimo-Colombia and were transported under refrigeration to the laboratory, where they were subjected to size reduction in a food processor (Black & Decker, USA) and stored at -20ºC until use. The microbiological analyses were made previously, and the moisture, fat, ash and total protein analyses (6,25xN) were carried out according to the methods in AOAC 19. The enzyme used in this work was Alcalase 2.4 L alimentary grade (Novozymes, Denmark), a non-specific bacterial endo-peptidase from Bacillus licheniformis with Subtilisin Carlsberg as the main component of the enzyme. This enzyme has been used for the hydrolysis of proteins in different species of fish (20, 21), including tilapia 22,23,24. However, the wide range of alcalase enzyme operating conditions suggest that there is a need to determine the optimal conditions for each substrate in particular to reach the highest DH in each case 24.
The enzymatic activity of commercial complex alcalase 2.4 L was 2.45 ± 0.07 AU/g, which was determined according to the method of Takami et al. 25 with a slight modification. In this method, the enzymatic unit (U) is defined as the amount of enzyme that produces 1 µg of tyrosine in 1 minute 25. In this procedure, 0.25 mL of enzyme aliquot was incubated with 2.5 mL of 0.6% casein solution in buffer Glycine:NaCl:NaOH (50 mM, pH = 8.7 and T = 60°C). The reaction was stopped by the addition of 2.5 mL of TCA solution (0.11 M trichloroacetic acid, 0.22 M sodium acetate, 0.33 M acetic acid), and this mixture was centrifuged for a period of 15 min. Then, the supernatant was mixed with 2.5 mL of 0.5 M Na2CO3 and Folin-Ciocalteu reagent for 30 min. The optical density was measured at 660 nm using a spectrophotometer UV-1700 Pharma Spec of SHIMADZU® and a standard curve of tyrosine solution from 0 to 1000 (mg/L).
Kinetic experiments were performed in a 1 L magnetically stirred, jacketed, glass batch reactor with stable pH and temperature that was connected to a thermostatic regulator. The pH control and temperature record were conducted with a glass combined electrode LL with a fixed frosted diaphragm (temperature from 0°C to 80°C) connected to an automatic titrator Titrando 842 (Metrohm, Suiza) 9 that was monitored by a computer using Tiamo 1.2.1 software. The reaction medium was constantly stirred with a magnetic stirrer 801 (Metrohm, Suiza) at 300 rpm and each experiment was conducted over 6 h in which every consumed volume of base was recorded every 5 min to determine the corresponding DH at each point. Upon completion, the enzyme was inactivated by heating at 95°C for 15 min. Later, the reactor product was centrifuged to obtain four fractions: oil on the top, followed by an emulsion, the protein hydrolysate and then sludge at the bottom 18,21. All experiments were performed in triplicate.
The RTV were mixed with distilled water in a proportion of 1:1 (w/V). The quantity of water added is an important variable in the hydrolysis process because a low volume of water can not only diminish the hydrolysis due to inaccessibility of enzyme to substrate but also the high levels of viscosity of the mixture can lead to a reduced amount of hydrolyzed protein 26. The RTV that were previously treated consisted of 9.48% protein, which corresponds to a substrate concentration of 47.4 g/L, and was diluted in water to obtain protein concentrations of 12.5, 21.25, 29.5 and 37.5 in g/L. The reaction was initiated by the addition of the alcalase enzyme into the reactor at 53.45°C and a pH of 9.5. The initial enzyme concentration (e 0 ) ranged from 5 g/L to 20 g/L, which has been previously defined in the literature 18,21-23,27. Given the values of enzyme concentrations shown above, the DH tends to remain constant 24,28,29.
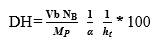
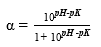
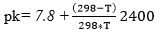
The degree of hydrolysis (DH) is defined as the ratio of the number of peptide bonds cleaved (per weight unit), h, to the total number of peptide bonds (per weight unit), ht. The reaction at alkaline pH was monitored to determine the DH (%). The DH was calculated by the pH-stat method based on the base volume consumed to maintain a constant pH using Equation 1 described by Adler-Nissen 30 through Equation 2 and Equation 3 22,23 assuming ht = 8.6 31. The addition of 1N sodium hydroxide solution allowed for the neutralization of protons formed in the dissociation of free terminal carboxylic groups, which are distributed according to the equilibrium of the proteinization of free α-amino groups 30.
 (Equation 1)
 (Equation 2)
 (Equation 3)
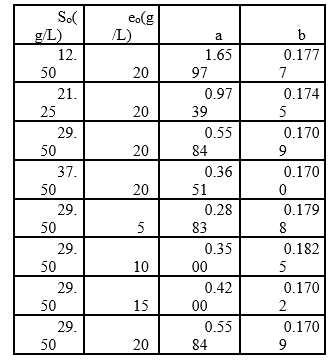
In the above equations, Vb is the volume of base consumed (L), NB is the normality of the base (Eq-g/L), Mp is the mass of the protein (Kg), and α is the average dissociation grade of the released groups α-NH2 in the reaction, which is dependent on pK as shown in Equation 2 and also depends on the temperature T (K) given by Equation 3 9. The experimental arrangement (Table 1) was prepared to evaluate the effect of the substrate and enzyme concentration on the DH.
Table 1 Experimental arrangement at different initial concentrations of substrate and enzyme in the RTV-alcalase 2.4 L enzyme mixture (pH=9.5, T=53.45°C).
A mathematical model was developed on the basis of the enzymatic action mechanism, which involves an exponential relationship between the hydrolysis rate (r) and the initial concentrations of substrate and enzyme (S 0 y e 0 ), with the adjustable parameters a and b 9. The value of these parameters was determined using the “lsqcurvefit” function of MATLAB 98® “toolbox” using non-linear correlations. The kinetic constants of the mechanism were estimated through a linearization, which allowed for the calculation of the different intercepts and slopes of straight lines resulting from plotting S0 versus the inverse of b parameter, eo/So versus a/b and So versus S0/r (ratio of the initial concentration of substrate to the initial rate of reaction (32.
RESULTS AND DISCUSSION
Figure 1 shows the experimental results of the DH as a function of the initial concentration of enzyme (eo) and the time (t). The DH increased with time at all levels of evaluated enzyme concentration. This increase is typical in this type of process 10,20.
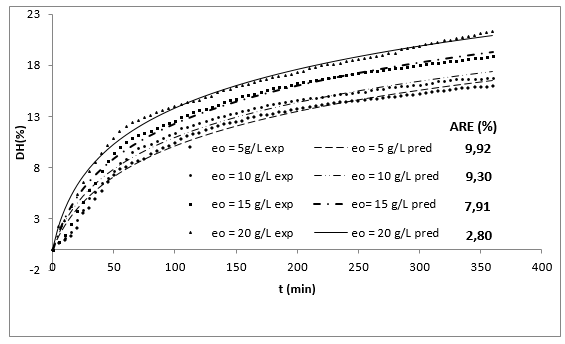
Figure 1 Effect of enzyme concentration on the DH in the enzymatic hydrolysis of RTV with alcalase 2.4 L as a function of time (So=29.5 g/L, T=53.5°C, pH = 9.5).
Additionally, increasing the initial enzyme concentration causes an increase in the DH, reaching values close to 22%, which are greater than those obtained by Gbogouri et al. 33, who found a DH between 11.5 and 17.3%, in the hydrolysis of salmon heads with alcalase. The results of Souissi et al. 34 described protein hydrolysis with a DH of 6.62, 9.31 and 10.16% from the heads and viscera of sardines (Sardinella aurita) with treatment with the alcalase enzyme. This result is important if it is considered that the greater DH in those substrates can be associated with increased essential amino acid levels and therefore with an increased nutritional value of derivate food products 21. Additionally, the high DH of fish by-products has been associated with a great ability to capture radicals and a better reducing capacity of hydrolysates 35,36. Generally, the relationship between low molecular weight peptides (high degree) and biological activity has been widely documented. More interesting applications in this topic have been found for peptides with molecular weights from 1 to 4 KDa (Table 1 shows that the value of parameter a is directly proportional to eo, whereas the parameter b is independent of this concentration and it is possible to consider it a constant with an average value of 0.1756. This result has been associated with an inhibition of substrate kinetics 42,43.
For a large DH obtained with high enzyme concentrations, a greater soluble protein concentration must be present in the hydrolysates 20, considering that high enzyme concentrations reduce the loss of denaturalized protein which is precipitated after hydrolysis. Moreover, the reaction increases the formation of small peptides that represents more COO- and NH3 + groups 10. However, with a high DH, the presence of available amino groups could be increased and act as substrates for the Maillard reaction in which the amino groups of proteins are linked to the aldehyde or ketone groups of sugars, forming colored nitrogenous polymers known as melanoidins, which could be unhealthy 44. On the other hand, with a low DH it is possible to take advantage of other functional properties because the large peptides tend to be located at the oil/water interface 10,33.
Figure 2 shows the experimental results of the DH as a function of the substrate concentration. These four curves show that when the substrate concentration is increased the DH is reduced. On the other hand, each substrate hydrolysis concentration rate [d(DH)/dt] decreases with time, which could be explained as a result of three factors 45-47: (a) a decreased concentration of peptide bonds that are susceptible to the hydrolysis of proteases, (b) the possible inhibition of the enzymes caused by the hydrolysis of substrate, and (c) thermal denaturation. In this case, the DH tends to possess limited values that are different at each level of substrate concentration evaluated. Therefore, the controlling factor is the velocity and not the decrease in available peptide bonds.
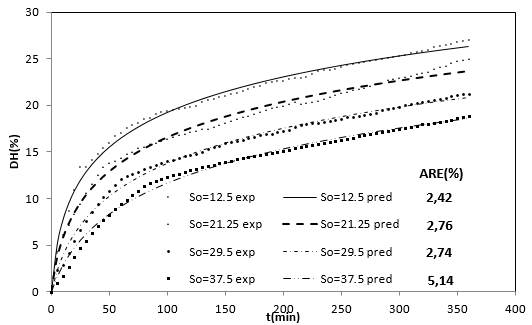
Figure 2 Effect of the substrate concentration on the DH of the RTV-alcalase system with time (eo=20 g / L, T=53.5°C, pH = 9.5).
On the other hand, the enzymatic deactivation phenomenon was decisive for the decreased hydrolysis rate with alcalase 2.4 L with other types of substrates 47, as well as for substrate inhibition 43. From the behavior of the DH as a function of substrate concentration in Figure 2, a substrate inhibition mechanism can be proposed.
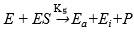
Equation 4 presents a simplified reaction mechanism of protein enzymatic hydrolysis and Equation 5 shows that the rate of reaction depends on the irreversible stage 42,45, and46.
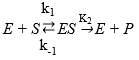 (Equation 4)
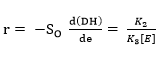
where E refers to the enzyme, S represents the substrate, ES is the symbol for the complex enzyme-substrate intermediate and P is the product. The rate of the hydrolysis process 42 is shown as:
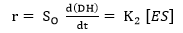 (Equation 5)
where r is the hydrolysis rate, So is the initial concentration of substrate (g/L) and K2 is the kinetic constant of the product formation reaction.
The equilibrium constant of dissociation of the ES, denoted by KM, is directly related with K-1 y K2 as shown in Equation 4. For this reason, this constant is defined as (K2+K-1)/K145.
Then, the Equations for the mechanisms of the substrate and the product inhibition are 46:
 (Equation 6)
 (Equation 7)
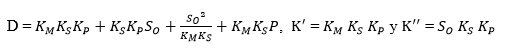
where the dissociation constant of compound SES is denoted by Ks and this parameter can be defined by the ratio between K-3 and K3 and the dissociation constant of EP is defined as KP = K-4 / K445,46; therefore, the EP concentration is:
 (Equation 8)
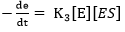
Qi and He 46 proposed that the inactivation of the protease mechanism is:
 (Equation 9)
where Ea and Ei are the active enzyme and inactive enzyme during the process, respectively.
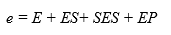
Based on a kinetic analysis of this reaction, it is possible to express:
 (Equation 10)
where e represents the total enzyme concentration.
From the definition of the equilibrium constant of the dissociation of ES, it is possible to find an expression for the concentration of ES:
 (Equation 11)
The SES concentration [SES] can be found from the expression of the dissociation equilibrium for this species shown in Equation 6; replacing [ES] from Equation 11 provides:
 (Equation 12)
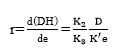
Dividing Equation 5 by Equation 10 gives:
 (Equation 13)
The enzyme balance of the system would be:
 (Equation 14)
Substituting the concentrations of each species from Equation 8, Equation 11 and Equation 12 into equation 14 makes it possible to find the models to estimate [E] and [ES] as a function of e and the different constants of the process, assuming that [S] = So:
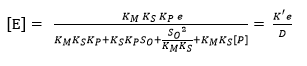 (Equation 15)
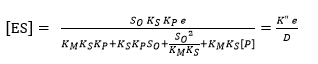 (Equation 16)
Substituting Equation 15 into Equation 13 shows:
 (Equation 17)
Finally, from the initial condition, if the DH = 0 then e = eo, integration of Equation 17 provides:
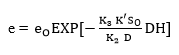 (Equation 18)
where,
Substituting Equation 18 into Equation 16 forms an exponential expression of [ES] that can be obtained when replaced in Equation 5 to provide a model to estimate the change in the ratio of the DH as function of the same DH. The comparison of this expression with the Equation 19, which has been used to adjust curves for this type of protein enzymatic hydrolysis 46,48, provides a method to obtain the overall expressions to estimate the kinetic parameters a and b using the Equation 20 and Equation 21:
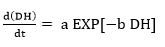 (Equation 19)
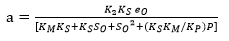 (Equation 20)
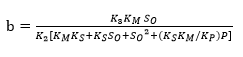 (Equation 21)
Figure 1 shows an opposite effect of the substrate concentration on the DH, indicating possible substrate inhibition (without product inhibition). From a kinetic point of view, this effect means that the complex SES is obtained and therefore the equilibrium constant dissociation value Ks should be close to zero. The same situation occurs with the compound ES and, from Equation 5, KM should have a small value. Under this assumption, there is no product inhibition. The compound EP tends to dissociate, and for this reason, equilibrium constant (KP) value of the compound should be high. Thus, the expressions (KM * KS) and KS*KM / KP tend toward zero. Based on the above, the final Equations for a and b with substrate inhibition are:
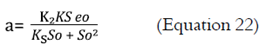
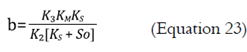
To estimate the kinetic constants Ks, K2, and Kd, the Equation 22 and Equation 23 were linearized (Figure 3). Ks was calculated through the division of the intercept by the slope, which was determined from this plot. The K2 value was estimated from the ratio of the line intercept in Figure 3 to the slope of the straight line which was obtained from the graphical plotting eo/so versus a/b. Then, it is possible to obtain the Kd value by dividing the K2 value by the intercept of the line as shown in Figure 3.
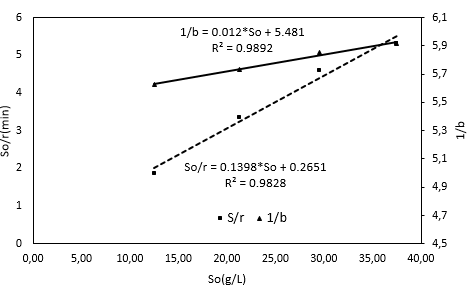
To estimate K3 it is necessary to know the values of Michaelis-Menten constants (KM and rmax) using the double reciprocal approach of Hannes-Woolf shown in the Equation 24 32:
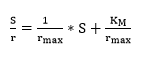 (Equation 24)
Using the last Equation, it is possible to obtain a straight line, which is shown in Figure 3, and determine the slope and intercept of the line. This determination makes it possible to calculate the K3 and KM values because the Kd value is also known. The correlation coefficient value of the straight line in Figure 3 is close to 1, which indicates that the linearization process was acceptable.
The values of the ratios of the initial substrate concentration to the reaction rate corresponding to the initial concentrations of substrate were evaluated in each test. The reaction rates were obtained from the initial section in each curve in Figure 2.
Setting So data versus So/r, in Figure 3 shows an rmax value of 7.1531 g/(L min). The KM value is shown below with a correlation factor (R2) of 0.9828, which supports the validity of using the double reciprocal transformation by Hanes-Woolf 32 to represent the data of this study. The KM value and the graphic behavior shown in Figure 3 supports the substrate inhibition hypothesis proposed for the reacting system 49, which has been documented by different authors with other substrates but with the same enzyme 43. One explanation for the substrate inhibition is found in the presence of fat in RTV, which can interact with the proteins to produce a lipid-protein complex and reduce the accessibility of the enzyme to the protein 18. On the other hand, there is the possibility of a hydrophobic interaction between proteins and substrates that reduces the accessibility of the enzyme 41,50).
The Kinetic constant values for hydrolysis of RTV-alcalase 2.4 L at 53.5°C and at a pH of 9.5 were: Ks = 456.75 g/L, Kd = 0.2224 min-1, K2 = 1.2191 min-1, KM = 1.8963 and K3 = 0.1173 min-1.
Replacing the kinetic constant values in the Equation 22 and Equation 23 and substituting these expressions into the Equation 19, provides:
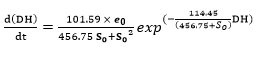 (Equation 25)
The use of the Equation 25 at the different operating conditions provides the predicted values shown in the Figures 1 and 2, which is within the range of acceptability verified by the low average relative-error value 51.
CONCLUSIONS
Under experimental conditions, it was possible to obtain high DH and hydrolysis rates, which are directly dependent on the enzyme concentration and inversely dependent on the substrate concentration. The kinetics of the hydrolysis reaction followed a substrate inhibition mechanism, which was adjusted through a typical exponential Equation that involves two parameters (a and b) associated with the kinetic constants (Ks, K2, and Kd) under the assumption that there is no product inhibition. The Michaelis-Menten constants in the hydrolysis reaction were determined using the double reciprocal approach of Hanes-Woolf.

