


 English (pdf)
 Article in xml format
 Article references
 Send this article by e-mail
 Cited by SciELO
  Cited by Google
  Similars in
SciELO
Similars in
SciELO  Similars in Google
 Permalink
INTRODUCTION
Concern about the quality of the water for human consumption has become widespread among the population. The taste and some problems associated with drinking water have been the cause of increased demand for bottled water. Due to this, day to day, a large number of companies has manifested their interest in the production of bottled water. The consumption of bottled water has been increasing consistently over the last decade, even in countries where tap water quality is considered of excellent quality (1).
Traditional methodologies are commonly used to detect compounds and its characteristics. These methodologies show good precision, accuracy and reliability. However, this technologies are often destructive, time consuming, and require expensive equipments. To overcome above drawbacks, electronic tongues have emerged as rapid and ease to use tools very promising for evaluation of food quality (2).
With regard to water intended for human consumption, the problems associated with global warming leading to regional changes in climate and water availability are seriously affecting sustainability of supplies as well as seriously impacting on quality. Advances in chemical and microbial analysis have revealed that water contains many new contaminants that were previously undetectable or unknown, constantly presenting water utilities and regulators with new challenges (3).
As an alternative, the instrumental methods employing high end analytical instruments like high performance liquid chromatography, gas chromatography (4) and capillary electrophoresis (5) are prohibitively expensive and require skilled manpower (6). Nowadays, consumers are paying great attention to the characteristics of food such as smell, taste, and appearance. This motivates scientists to imitate human senses using devices known as electronic senses. These include electronic noses, electronic tongues, and computer vision. Thanks to the utilization of various sensors and methods of signal analysis, artificial senses are widely applied in food analysis for process monitoring and determining the quality and authenticity of foods (7).
Electronic tongues are sensor arrays combined with voltammetric methods and multi-variable analysis which are tested for large household applications (8, 9). The existent problem is the complex data analysis. Cyclic voltammetry (CV) is well-known analytical method and deliver more specific information (10). This technology is becoming extremely important, proof of this is the large number of bibliographic review works that have been published on this subject. Some of them are general and cover the different types of electronic tongues and their applications. Others, although they give an overview of this technology, focus on some specific application such as the food industry, the pharmaceutical industry or environmental applications (11).
The most common application of electronic voltammetric tongues are beverages, as is the case of the extensive number of published works related to wine (11). Other emerging approach from voltammetric electronic tongue (VE-tongue) is the analytical characterization and geographical classification of honey (12). Water analysis is another of the applications in which the electronic voltammetric tongues are having a great development (13). For example, Tønning et al., (14) used 8 sensors created by serigraphy and modified with enzymes to classify waters with different degrees of contamination. For this purpose, the time evolution of the current is measured by applying voltage steps to the electrodes. The resulting data are treated with PCA, achieving clear discrimination between the samples of each category.
Another work related to the analysis of water quality is described by Gutés et al., (15). In this case, wastewater from paper mills is measured in a continuous flow by means of the voltammetric tongue with Au, Pt and Rh electrodes.
There exists a need for better on-line monitoring of water systems given that existing laboratorybased methods are too slow to develop operational response and do not provide a level of public health protection in real time. There is a clear need to be able to rapidly detect (and respond) to instances of accidental (or deliberate) contamination, due to the potentially severe consequences to human health (16).
The use of support vector machine (SVM) has been reported to work efficiently with VEtonge in several chemometric applications (17, 18). In this sense, the aim of present research was to develop a model based on support vector machines algorithms, using data obtained by cyclic voltammetry in order to discriminate water from the public network and drinkable water quality.
MATERIALS AND METHODS
Sample collection
In this work, a total of 60 different samples of drinkable water have been considered, 30 of them from the public tap in different places around the south of Ecuador. The remaining 30 samples, were obtained from different production batches of bottled water of a recognized brand. All the samples have been subjected for evaluation.
The voltammetric technique involves a three electrode setup. The potential was applied between the reference electrode and the working electrode and the current was measured between the working electrode and the counter electrode. It has been investigated with working electrode made of glassy carbon, an Ag/AgCl reference electrode (saturated KCl, Gamry Instruments Inc.) and a high purity platinum foil was used as a counter electrode. A PAR 273-A Potentiostat, was used for electrochemical measurements.
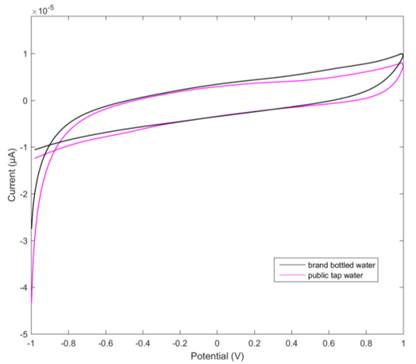
The output current has been considered for data analysis. The number of data points generated from glassy carbon electrode are 2000. The scan rate was 0.2 V/s. The resulting current has been recorded and considered for data analysis. The oxidation and reduction peaks of the water samples have been observed to be prominent (Figure 1). These peaks are due to the combined redox potentials of the constituents of water. The waveform is applied with the range from 1.0V to - 1.0V (19).
Automatic feature (potential range) selection
In chemometrics, due to the large amount of information provided by the instruments, it is necessary to substantially reduce the number of variables necessary for the construction of classification and calibration models (20). In the last decade, feature selection (FS) in the construction of models has gone from illustrative examples in terms of their operation, to become a requirement, particularly by the nature of the problems with high dimensionality such as microarray analysis and spectral analysis (21).
The selection of features contrasts with other dimensionality reduction techniques, such as principal component analysis (PCA) since the former does not alter the original representation of the variables, but simply consists of selecting a subset of the best characteristics, preserving their nature original, which allows them to be easily interpreted by a field expert (21). Considering that many of the pattern recognition techniques were not designed in their origins to deal with large amounts of irrelevant information, the application of FS techniques has become a necessity in many applications today (22).
Pre-apply a FS technique, prevent overfitting of the model, improve performance and reduce computation time and obtain a deeper understanding of the data, this adds complexity to the modeling task, since instead of just optimizing the parameters of the model, now we have to find the optimal characteristics that define the model, and in the case of regression it is used to look for the variables that maximize the fit of the model (21, 23, 24).
A group of techniques commonly used for FS, are filters that evaluate the relevance of a characteristic, analyzing the intrinsic properties of the data, in general a score of relevance is calculated and those characteristics with lower score are eliminated (21, 25), there are two types: univariate and multivariate (26).
The univariate filter is a simple but efficient paradigm, since the output ranking is easy to understand, it is usually defined a threshold method to select those that meet a condition above or below it. Filters work independently of the model and use the intrinsic properties of the data (25). Univariate filters have the advantage that they are fast, scalable and independent of the classification / regression technique used, however they have the disadvantage that they ignore the dependency and correlation between characteristics (27). The univariate filter method can be applied using a t-test (28), F-test (29) or the Wilcoxon rank sum test (25). Calculates a p-value that represents the statistical significance of each variable in the model, so the variables are ordered depending on their p-value (21).
Support vector machines algorithms
The supervised machine learning algorithms are used when there is sufficient knowledge about the desired results, in order to build a strong model capable of correctly assigning the class to which a new data entry belongs (30).
A trained algorithm is able to transfer the learned dependency between the input patterns and the expected results in the new data sets. The performance of the classifier can be evaluated by the proportion of correctly classified patterns in the test, ie the data that were not used during the training (31).
Support vector machines (SVM) are new supervised machine learning algorithms that are used to classify data sets into two different classes, separated by a hyperplane (30).
The SVM can be used either in regression or classification models, since its operation is based on learning from a set of training samples whose classes are known (32, 33). Developed the foundations of the SVM, in a study on the theories of statistical learning, later, Boser et al., (1992) proposed a method to create non-linear classifiers (34). Current SVM standard models were proposed by (35).
The SVM models are intended to obtain models with little structural risk of error with respect to future data, originally designed to solve binary classification problems but now its application has been extended to regression, multiclassification, clustering and other tasks (32). This technique is intended to find an optimal hyperplane capable of distributing the data in the classes to which they belong. Intuitively, it seems obvious to conclude that when faced with a linear classification problem there is a high probability of obtaining several solutions that correctly classify the data.
The optimal hyperplane is used to separate the two classes can be defined from a small amount of data from the training set called support vectors, which determine the optimal margin of separation (35). Figure 2 illustrates the aforementioned concepts.
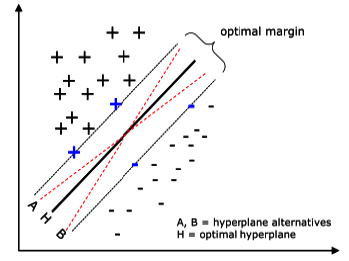
Figure 2 A problem separable in a two-dimensional space. Support vectors (highlighted in blue) define the margin of greatest separation between classes.
The choice of the best hyperplane was resolved in 1965 (36) with the criterion that the optimal hyperplane is defined as the linear decision function with the maximum margin between the vectors of the two classes. However, in most problems, the data is not linearly separable and the use of strategies such as the identification of other separation dimensions is required. Core functions are used to transform the original multidimensional space into another one, where the classes are linearly separable. In practice, support vector machines are trained using different cores to select the one that has the best performance for the problem posed (37).
In the present work, preliminary tests were carried out by the trial-error method (38), to determine the most suitable calculation kernel. A radial basis function - RBF (Gauss), was chosen as the kernel of the model, to perform the exhaustive evaluation. Normally polynomial kernels and RBF are among the most used; the latter has a sigma parameter (σ) that can be tuned to adjust the size of the kernel (39). Preliminary tests were carried out to select the range of best sigma values, which was between one and six; this range was used for the exhaustive evaluation.
SVM has a compensation parameter of C, which can be modified and affects the quality of the classification, since it determines the severity with any classification error should be penalized; in general, very high values of C can lead to problems of overfitting, which reduces the ability to generalize SVM (37). In order to evaluate this parameter without overfitting the classifier, values below 0.25 were selected.
Model optimization
A 5-fold cross-validation was applied in order to evaluate how the model would perform in a set of independent data. This also reduces the risk of overfitting the model (40). By partitioning the data in this way, the training and test subsets of each fold contain representative samples of the two classes in a random and stratified manner. The process of partitioning into 5-fold cross-validation, divides the data into k subsets; one of them is used as a subset of the test and the others (k-1) are used as training subsets (37). This process is repeated for k folds, with each of the possible subsets. In this work 100 repetitions of 5-fold cross-validation, were performed, so that for this study, 1.25 million models based on different configurations of the SVM parameters were evaluated in order to determine the optimal configuration.
Finding the best combination of parameters of an SVM is key in the construction of a prediction model to be highly accurate and stable (41, 42). The parameters of the RFB kernel are adjustable in the SVMs in order to control the complexity of the resulting hypothesis, and in this way avoid the overfitting of the model (43, 44). The combination of parameters C and σ, determines the performance of the model, to find the optimal combination can be used several approaches (44, 45).
In the present work, a grid search approach was applied for parameter optimization. This method is widely used in machine learning techniques and uses a brute force approach in which all combinations of parameters in a range are tested (46), in order to find the best combination, based on the performance measures, explained above.
Classification performance analysis
The accuracy is usually the only metric performance, which is used to evaluate the performance of machine learning techniques; this precision value is a statistical measure that is used to determine if a binary classification test (true or false) is able to identify or exclude a condition correctly (47). The accuracy is usually the only metric performance, which is used to evaluate the performance of machine learning techniques; this precision value is a statistical measure that is used to determine if a binary classification test (true or false) is able to identify or exclude a condition correctly (48). However, in order to compare the rate of false positives and false negatives, other performance measures are used (49). The specificity in this context is the ability to detect water samples from the public network as false and the sensitivity is the ability to detect bottled water samples as true.
To select the optimal configuration of the models, Analysis of variance (ANOVA) and multiple range tests (MRT) were performed with the Tukey Honest Significant Difference (HSD) method for a value of p<0.01. In each step of the methodology, a selection of the parameters that provided the best performance was made. In order to improve the ability of the model to generalize, the metrics were calculated from the confusion matrix of the test set, that is, data different from those used for the training, reducing the possibility of overtraining.
RESULTS AND DISCUSSION
In this work a methodology is presented to optimize a classification model based on SVM, for the authenticity evaluation of bottled water. The voltammograms were labeled according to the type of sample in order to perform the supervised training of the classification algorithm. Figure 3 shows the voltammograms of the bottled water samples and the tap water samples. In this figure you can see the voltammograms of public water was combined to compare with brand bottled water samples. The cyclic voltammograms of public water represent similar curves; however, the redox curves obtained in negative potential range (-1.0V ~ 0.0V) gradually shifted to the direction of lower current density (Figure 1). This is because, the amount of minerals in public water affects its ability to dissolve oxygen and therefore decrease the cathodic peaks.
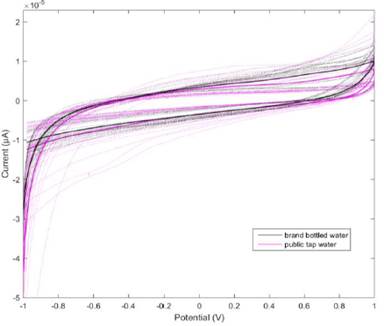
Figure 3 Cyclic voltammetry graph, black lines belongs to brand bottled water samples, magenta lines belongs to public potable water samples.
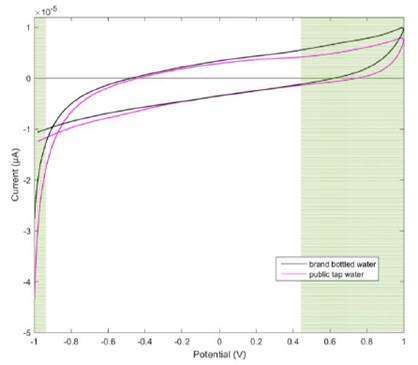
A univariate filter algorithm (28) was used for the selection of the potential ranges in which the differences between the voltammograms of the two groups evaluated are better evidenced. In Figure 4, the result of applying the univariate filter for the automatic selection of the potential range in which the differences between voltages of different groups are accentuated, which is from -1V to -0.94V and from 0.45V to 1V.
Voltammetric electronic tongue signals and support vector machines for pattern recognition are used for classifying public tap water and brand bottled water samples in order to determine its authenticity. The resulting voltammograms of tap water and bottled water, are in good agreement with those reported in the literature for tap water (50) and for acidulated water (51). The water molecules presents in drinkable water represents a redox property different from tap water. If we analyze the cyclic voltammograms obtained in the potential range between 0.7V to 1.0V, we can observe a gradual displacement of the current to lower values comparing bottled water with tap water.
Most chemical species present in tap water, results in a difference in current densities compared to those observed in samples drinkable water. This behavior is accentuated due to the differences in the currents of reduction of the dissolved oxygen that is found in greater quantity in bottled water. Meanwhile, Figure 1 shows absolute values of current (I) that increases in the case of public water samples 9.94e-6 μA compared with 7.99e-6 μA, both at 0.9916V. The reason could be the largest concentration of chloride ions in the public water samples that have a higher contributions to the conductivity (10).
In preliminary tests it was determined that the classification algorithm to be used is SVM with a radial basis function (RBF) kernel. A grid search algorithm was used to select the best combination of the parameters σ and C of the SVM, a range between 0 and 30 with intervals of 1 was defined for both parameters. The results of the average of the 100 repetitions of 5-fold cross-validation in the test set can be reviewed in figures 5, 6 and 7. Figure 5 shows the mean accuracy in the test set of 100 repetitions of the 5-fold cross-validation, it can be seen that with a C parameter value greater than 5 and a value of σ between 6 and 18, good results are achieved accuracy results.
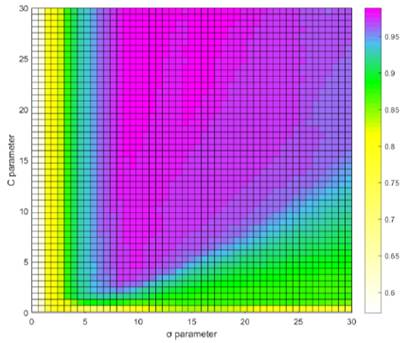
Figure 6 shows the mean specificity in the test set of 100 repetitions of the 5-fold cross-validation, it can be seen that with a value of the C parameter greater than 0 and a value of σ greater than 10, good results are achieved of specificity.
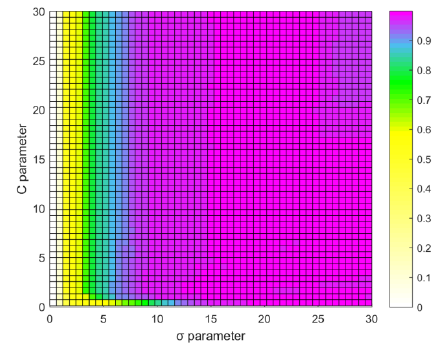
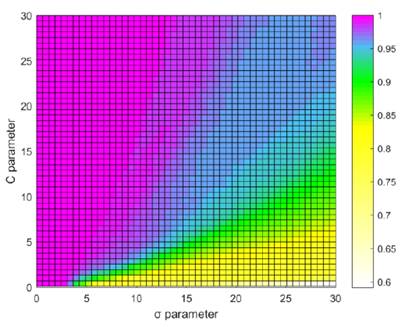
Figure 7, shows the mean sensitivity in the test set of 100 repetitions of the 5-fold cross-validation, it can be seen that with a value of the C parameter between 0 and 30 and a value of σ between 0 and 15, it is reached good sensitivity results.
From the results of grid search, six pairs of values have been pre-selected for the parameters of σ and C, (10, 15); (10, 20); (10, 30); (15, 15); (15, 20) and (15, 30) whose results are similar. The final decision was made after performing an ANOVA test of 100 repetitions of 5-fold cross-validation, 3000 models were evaluated with the parameter combinations described above for the SVM (Table 1).
Table 1 Multiple comparison of different values of σ and C parameter for the performance metrics assessed.
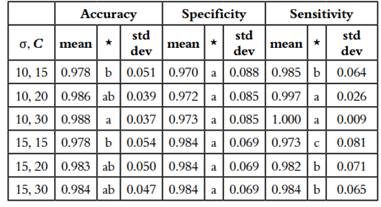
Rows with different letters differ significantly according to Tukey’s Honest Significant Difference method for a value of p <0.01.
Although the combination (σ = 10, C = 30) presented the best results in accuracy 0.988 ± 0.037, specificity 0.973 ± 0.085 and sensitivity 1 ± 0.09. Finally, a combination of parameters (σ = 10, C = 20) was selected as optimal parameters, since there was no significant difference between this and the combination (σ = 10, C = 30). According to (52) it is better to select lower values of the parameter C in order to avoid overfitting.
The univariate filter applied to the voltammograms for the automatic selection of the potential range in which the samples of both classes differ best, was from -1V to -0.94V and from 0.45V to 1V. There are no previous works that indicate the range of potential in which it is possible to differentiate samples of bottled water from any tap water samples.
The model that obtained the best performance in terms of accuracy (0.986), specificity (0.972) and sensitivity (0.997), was the one that uses the RBF kernel, with a parameter σ equal to 10, and a parameter C equal to 20. The results were obtained in the test set, which gives validity to the model given that the training was performed with different data to this set, in this way, the proposed model is able to classify new samples from the dependency learned between the patterns of entry in accordance with the raised by (31).
The optimization of the parameter σ and C in the SVM models applied to voltammograms of water samples generate an improvement in sensitivity, accuracy and specificity. however, considering that the higher the value of C, the greater the probability of overfitting (37), the authors selected values of σ equal to 10, and of C equal to 20, even though the combination that produced results with a higher mean was (σ = 10, C = 30).
CONCLUSIONS
In this paper, glassy carbon working electrode cyclic voltammetry is used for discriminating between drinkable bottled water and water from the public network, using an optimized SVM. The novelty of the proposed method is that of the model classifies automatically the water samples using the learned pattern contained in several points of voltammogram.
The cyclic voltammetry applied as a method of electrochemical analysis, shows that the water molecules present in the samples of a brand of bottled water, have redox properties different from those of tap water. The range of the potential in which the samples of bottled water and tap water differs best is from -1V to -0.94V and from 0.45V to 1V.
Our results show that it is possible to evaluate the authenticity of bottled water, by classifying cyclic voltammetric signals. It was observed that the absolute values of current (I) increases in the case of public water samples 9.94e-6 μA compared with 7.99e-6 μA, both at 0.9916 V. The reason could be the largest concentration of chloride ions in the public water samples that have higher contributions to the conductivity.
The optimal SVM model consisted of an RBF kernel, σ = 10, C = 20, whose results in Accuracy, Specificity and Sensitivity were 0.986, 0.972 and 0.997, respectively. The optimization of the parameters of the SVM is fundamental to improve the accuracy, specificity and sensitivity in the problems of classification of water samples using voltammograms

