


 English (pdf)
 Article in xml format
 Article references
 Send this article by e-mail
 Cited by SciELO
  Cited by Google
  Similars in
SciELO
Similars in
SciELO  Similars in Google
 Permalink
Introduction
Coffee is one of the most appreciated and consumed beverages in the world (1); however, in its various states, it is susceptible to present a risk of contamination by mycotoxins (2). Mycotoxins are secondary metabolites produced by filamentous fungi that are present in agricultural products due to inadequate food handling and poor storage methods (3,4). Several toxigenic fungi such as Fusarium spp., Aspergillus spp., and Ochratoxigenic species have been found in coffee plants, coffee beans, and roasted coffee worldwide (3). Thus, mycotoxins contents have been reported in coffee (e.g., sterigmatocystin (STG), aflatoxin B2 (FB2), aflatoxins (AFs), and ochratoxin A (OTA)) (3). To date, several potentially toxigenic fungal toxins such as those mentioned above, have been found in Colombian coffee beans, including all steps of coffee processing (5), which indicates these toxins in Colombian coffee samples could be present.
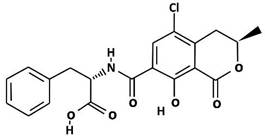
OTA is one of the most important and harmful mycotoxins (2), which is a metabolite produced by filamentous fungi of the genus Aspergillus and Penicillium, in particular, A. ochraceus and P. verrucosum (6,7). OTA is nephrotoxic, hepatotoxic, embryotoxic, teratogenic, neurotoxic, immunotoxic, genotoxic, and carcinogenic in many species with species and sex-related differences (2), so the presence of this toxin in coffee is a public health concern, particularly for heavy drinkers (8). OTA is a low molecular weight ubiquitous secondary metabolite, a weak organic acid consisting of phenylalanine amino acid and a dihydro-isocoumarin linked by a peptide bond, giving interesting chemical characteristics such as low aqueous solubility and high in organic compounds (8) (Fig. 1).
In Colombia, coffee has an important participation in the national economy. According to the National Federation of Coffee-Growers (FNC), the Arabian coffee exportation represents 11.3 % of world exports (9), and the product goes to more than 50 countries (10). Colombian regulations established the maximum OTA limits for roasted and soluble coffee, with values of 5 μg/kg and soluble 10 μg/kg, respectively (11), in agreement with the same limits established by international regulations such as the European Commission (12). Regarding the coffee for consumption, there are different formats on the market, such as roasted ground or whole grain, with various roasting degrees (light, medium, or high) and different grinding levels. On the other hand, consumers can find instant or soluble coffees, which could be agglomerated, freeze-dried, and fine powdered. It is also possible to find decaffeinated, flavored, special coffees, among others (13).
There are deeply sensitive and specific analytical techniques for the OTA quantification in different matrices, such as high-performance liquid chromatography (HPLC), liquid chromatography-mass spectrometry (LC-MS), gas chromatography (GC), and thin-layer chromatography (TLC). However, these require complex equipment, long assay time, high costs (14,15), and consequently, the lack of such techniques reduces the internal control capacity in coffee production. Therefore, the enzyme-linked immunosorbent assay (ELISA) has become the most widely used immunoassay technique due to its high performance, specificity, robustness, and easy automation (14). This technique is based on a competitive and heterogeneous essay, where the toxin from the sample competes with a labeled toxin (such as a toxin-enzyme conjugate) for a limited number of antibody-binding sites (16) and has been compared with HPLC, finding that both methods are consistent (17,18). However, although the ELISA technique has been used for the OTA determination in coffee (19,20), there are still no reports evaluating its relationship with the physical and physicochemical properties of coffee. This research aimed to determine the OTA presence in different types of coffee destined for beverage preparation and marketed in Colombia by applying the ELISA method and analyzing for the first time its relationship with physical, physicochemical, and microbiological properties.
Materials and methods
Reagents and materials
Immunoaffinity columns covered with sepharose gel suspension conjugated with monoclonal antibodies specific for the OTA; microtiter plate with 96 wells (12 strips with 8 wells each) coated with specific antibodies against OTA; 6 OTA standard solutions: 0 part per trillion (ppt) (zero standard), 50 ppt, 100 ppt, 300 ppt, 900 ppt, 1800 ppt in aqueous solution; peroxidase conjugate OTA; conjugate buffer; substrate/chromogen (tetramethylbenzidine); stop solution (corresponding to 1N sulfuric acid); 10 mM wash buffer phosphate, pH 7.4 (0.05 % Tween 20), were obtained from test-kits of RIDASCREEN® Ochratoxin A and RIDA® Ochratoxin A (R-Biopharm, Darmstadt, Alemania). All other inorganic reagents, chemicals, and organic solvents were of analytical grade.
Samples
Eight coffee samples were selected (Table 1) according to availability in the Colombian market. The coffee type per preparation was considered (soluble or roasted for extraction), and the kind of industrial process reported by the manufacturer. Three of the samples acquired corresponded to roasted coffee, which included whole beans, subdivided into premium or excelsior (WB1) and standard (WB2) coffee, and ground roasted coffee (GR). The whole beans samples were ground in a coffee mill (Wega®, Medellín, Colombia). The other five samples corresponded to dehydrated coffee extracts for instant soluble drinks, classified as follows: spray-dried coffee (SD), freeze-dried (FD), and agglomerated coffee (A), and including aspects such as origin denomination, excelsior, and decaffeinated coffee. Two groups were formed; the first corresponded to roasted whole beans and ground coffee, and the second to instant soluble particulate coffees. All coffee samples were stored at room temperature; in a cool, dry storage area. All commercially packaged coffees were opened fresh on each trial day.
Table 1 Selection of types of coffee for beverage preparation
| Types of coffee | Preparation of beverage for consumption | Code | Commentary |
|---|---|---|---|
| Whole roasted beans | Infusion grinding and extraction | WB1 | Excelsior |
| WB2 | Standard | ||
| Ground roasted beans | Extraction by infusion | GR | Standard |
| Dehydrated Particulate Coffee Extract | Spray Drying - Fine Powder For instant beverage | SD1 | With caffeine |
| Spray Drying - Agglomerate. For instant beverage - | A1 | Denomination of origin | |
| A2 | With caffeine | ||
| Freeze-dried - Agglomerate. For instant beverage - | FD1 | Decaffeinated | |
| FD2 | With caffeine |
Analysis of ochratoxin A levels using the ELISA method
Sample preparation
Performed according to provider guidelines RIDASCREEN®Ocratoxin A in combination with RIDA®Ochratoxin A columns (R-Biopharm®, Darmstadt, Alemania) (21). 5 g of ground coffee were weighed and mixed with 5 mL 0.13 M NaHCO3 buffer solution, pH 8.1, and methanol/water (25/75 v/v) using an immersion mixer (Imusa®, Medellín, Colombia) and vortex (Daigger Vortex-Genie 2®, Bohemia, NY, USA). Then centrifuged for 10 min/4000 g (Sorvall ST 16R®, Bogotá, Colombia), the supernatant was filtered with a paper filter (Whatman® No.1 ø=180 mm, Medellín, Colombia) and 5 mL of the filtrate (corresponding to 1 g of sample) was diluted with 5 mL of PBS buffer (Phosphate-buffered saline), pH 7.4. Solid-phase extraction was applied with RIDA® Ochratoxin A column, treated with 2 mL of PBS/methanol (90/10 v/v) without allowing the matrix to dry, then the column was fed stepwise with 10 mL of the diluted sample, and it was drained at a flow rate of 1 drop/s employing vacuum application, with 20 inHg Regulator vacuum pump (BIO-RAD®, California, EE. UU) coupled to solid-phase extraction system with maximum vacuum capacity of 20 inHg. The eluent was collected in a vial that was subsequently diluted in a 1:30 (1 + 29) ratio with NaCO3 0.13 N buffer and protected from light for further analysis.
ELISA Determination
The method was applied according to the protocol of the supplier of the quantitative test kit for OTA, R-Biopharm, RIDASCREEN®Ocratoxin A (R-Biopharm®, Darmstadt, Alemania), which has a detection limit of 1.25 µg/Kg, a recovery percentage of approximately 100 %, and specificity for OTA of 100 % (22). Quantification was performed by photometric measurement at 450 nm using an absorbance microplate reader EL800 (BioTek Instruments INC®, Winooski, VT, EE. UU), where the absorption is inversely proportional to the OTA concentration in the sample. The calibration curve was obtained with 6 standard solutions of OTA (0, 50, 100, 300, 900, and 800 ng/Kg), and all the data obtained from the experiment were processed through the RIDA®SOFT Win software (Art.Z9999, R-Biopharm®, Darmstadt, Alemania) specific for OTA.
Physicochemical analysis
Moisture content, water activity (aw), and pH measurement
A moisture analyzer (Axis®, Bogotá, Colombia) was used to determine the moisture content, based on thermogravimetric analysis using an analytical balance with an infrared lamp (23). The aw of the medium was measured by the hygrometric principle method, using the aw measuring equipment (Pawkit®, São Paulo, Brasil), previously calibrated with the salts LiCl (0.250 aw) and NaCl (0.760 aw) (24). The pH value was measured at 25 °C using a pH meter (Trans Instruments BP3001®, Singapore) (25).
Percentage total dissolved solids (%TDS) and extraction yield (%EY)
Soluble coffee beverage (26) and roasted and ground coffee were prepared using the drip method (27), where 7 g of coffee was weighed on a paper filter, and 100 mL of boiling water were added, slowly, continuously, and with circular movements in a time of 30 s. The TDS content of all the coffee samples was made using the coffee TDS refractometer (VST inc®, Boston, EE. UU) (21), and the %EY was estimated using the Vst Coffee tools software (26).
Physical properties analysis
Colorimetric parameters
Colorimetric parameters were determined with a colorimeter-spectrophotometer (ColorFlex®EZ HunterLab, Reston, USA), with a spectral range of 400 - 700 nm, and standard illuminant D65, measuring CIE L*a*b* (CIE L* (white/black), CIE a* (redness/greenness), CIE b* (yellowness/blueness)).
Free-flow (FLD) and compacted bulk densities, and porosity
Free-flow (FLD) and compacted bulk densities (CBD) were determined according to Colombian Technical Standard NTC (NTC) 4912 (28). Porosity was determined according to concepts and methods reported for particles in assembly (29).
Particle size
The average particle size (APS) was determined according to NTC 2441 (30), through fraction separation according to the particle size distribution using sieves powered by a Ro-Tap®, Laval, Canadá.
Statistical analysis
Samples were evaluated in triplicate, coded, and randomly analyzed. Principal component analysis (PCA) and cluster analyses (CA) were used to quantitatively investigate the relationships between the coffee samples concerning their physical, physicochemical, and safety properties (OTA content), and principal components with eigenvalues greater than one were selected. CA was made through Ward’s methods using square Euclidean distances. ANOVA was applied to the results, and differences between samples were established using the LSD test with a level of significance of 95 %. The correlations between the variables were evaluated using the Pearson correlation test. For this purpose, the coffee samples were grouped into two groups, the first corresponding to roasted coffee, while the second referred to soluble coffee. All statistical analyzes were performed in StatGraphics Centurion XVII®.
Results
Ochratoxin A analysis and physicochemical properties
As shown in Fig. 2, a standard competitive inhibition curve was established by plotting B/B0 (%) against OTA concentrations with the RIDA®SOFT Win version (Art.Z9999, R-Biopharm®, Darmstadt, Alemania), where B is the absorbance at 450 nm in the presence of OTA and B0 is the absorbance at 450 nm in its absence. It is important to mention that the curves obtained by the method do not follow a linear model (22,33).
The results obtained from the analysis of the physicochemical properties and analysis of OTA are shown in Table 2. A highly variable incidence of OTA in coffee samples is observed, where soluble coffees presented significantly (p < 0.05) higher OTA contents compared to roasted coffees. The presence of OTA was detected in 100 % of the samples analyzed, for which all showed significant differences (p < 0.05), and two of the samples evaluated (25 %) exceeded the limits set by legislation for OTA content in coffee, one of these was for roasted and ground coffee (GR) exceeding the maximum permitted level of 5 µg/Kg (11,12), with a value of 5.287 µg/Kg. The other sample referred to an agglomerated soluble coffee (A2) that exceeded the maximum permitted level of 10 µg/Kg (11,12), with a value of 15.449 µg/Kg. In contrast, the lowest OTA value was obtained for the WB2 sample with a 0.868 µg/Kg content.
Table 2 Physicochemical properties and OTA content in Colombian commercial coffees
| Sample | Moisture (%) | pH | aw | %TDS | %EY | OTA (µg/Kg) |
|---|---|---|---|---|---|---|
| Roasted | ||||||
| WB1 | 3.006 ± 0.109c | 4.930 ± 0.020a | 0.510 ± 0.010d | 1.100 ± 0,100b,c | 13.330 ± 0.060b | 1.343 ± 0.016b |
| WB2 | 1.500 ± 0.116a | 8.730 ± 2.370b | 0.440 ± 0.010c | 0.700 ± 0.100a | 8.530 ± 0.060a | 0.868 ± 0.009a |
| GR | 4.416 ± 0.119g | 5.230 ± 0.140a | 0.520 ± 0.010d | 1.900 ± 000f | 14.170 ± 000c | 5.287 ± 0.187d |
| Soluble | ||||||
| SD | 3.347 ± 0.055d | 4.660 ± 0.000a | 0.430 ± 0.010c | 1.400 ± 0.100d | - | 7.557 ± 0.626g |
| A1 | 3.882 ± 0.006f | 4.670 ± 0.010a | 0.450 ± 0.010c | 1.300 ± 0.100d | - | 5.820 ± 0.213e |
| A2 | 4.382 ± 0.100g | 5.120 ± 0.110a | 0.450 ± 0.020c | 1.000 ± 000b | - | 15.449 ±0.102h |
| FD1 | 3.605 ± 0.167e | 5.020 ± 0.150a | 0.330 ± 0.020b | 1.200 ± 0.100c,d | - | 3.491 ± 0.058c |
| FD2 | 2.673 ± 0.148b | 4.770 ± 0.050a | 0.280 ± 0.050a | 1.600 ± 0.300e | - | 7.077 ± 0.021f |
Data were expressed as mean ± standard deviation (n = 3). Different letters in the same column indicate a significant difference (p < 0.05). %TDS: Percentage total dissolved solids, %EY: extraction yield. For sample codes refer to Table 1.
In Fig. 3, the strengths of the correlations between all the variables analyzed in the coffee samples are shown. The OTA content for roasted coffee samples showed, according to Babu et al. (2014) (34), very strong, significant, and positive correlations (p < 0.05) with parameters such as %TDS, porosity, CBD, moisture content. Moreover, strong with colorimetric parameters a* and b*, to moderate with %EY; in the same way, a strong, significant, and negative correlation (p < 0.05) with the APS. While for soluble coffee (Fig. 3.b), the OTA content showed only a significantly strong negative correlation (p < 0.05) with the parameter b*, and moderate with the APS, while with the moisture content, it showed a significant moderate positive correlation (p < 0.05).
On the other hand, the moisture content and aw ranged between 1.500 - 4.416 % and 0.44 - 0.52 for roasted coffee, and 2.673 - 4.382 % and 0.28 - 0.45 for soluble coffee, respectively. The moisture content was variable, while the aw was significantly (p < 0.05) higher in roasted coffees than soluble. In the case of roasted coffee, the moisture content presented very strong, significant, and positive correlations (p < 0.05) with the %TDS, %EY, OTA content, strong with aw and porosity; and moderate with CBD, while it presented a strong, significant and negative correlation (p < 0.05) with pH. The aw also presented a significant positive correlation (p < 0.05), very strong with %EY, and a strong one with %TDS, as well as a strong, significant, and negative correlation (p < 0.05) with pH. On the other hand, in the case of soluble coffee, the moisture content presented a strong, significant and negative correlation (p < 0.05) with the parameter L* and the %TDS, while a strong, significant and positive correlation (p < 0.05) with aw and moderate with OTA content. The aw also presented a significant negative correlation (p < 0.05) and very strong with L*, strong with APS, and moderate with %TDS. In contrast, it presented only a positive significant moderate correlation (p < 0.05) with CBD.
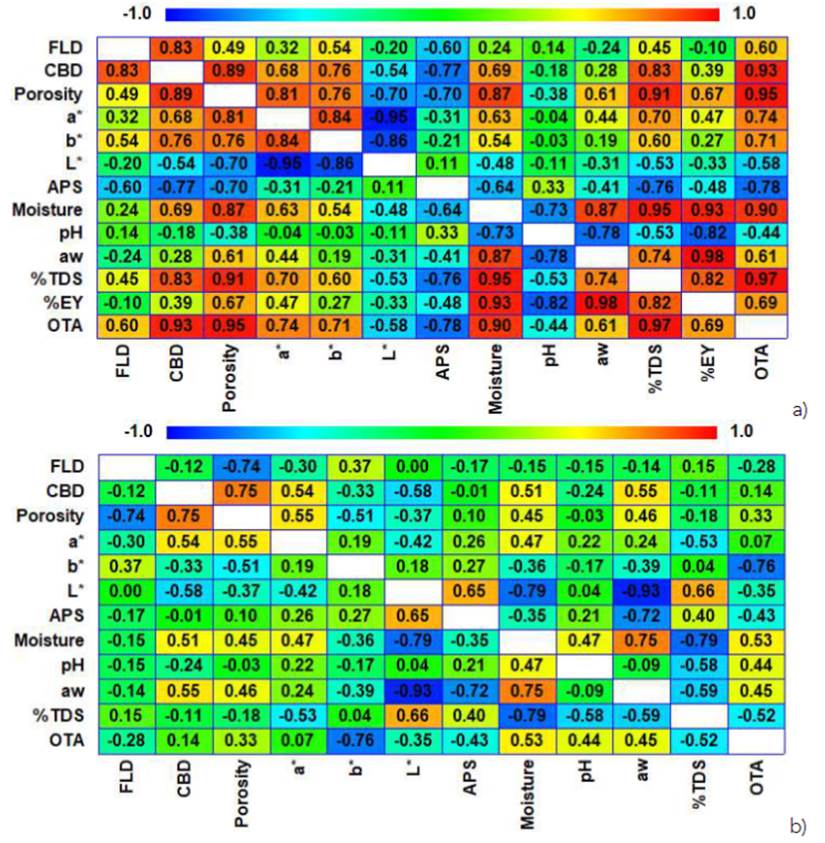
Figure 3 Correlation matrices between parameters related to physical, physicochemical properties, and OTA content for (a) roasted and (b) soluble coffee. FLD: free-flow densities, CBD: compacted bulk densities, APS: average particle size, %TDS: percentage total dissolved solids.
The pH ranged between 4.93 - 8.73 and 4.66 - 5.12 for roasted and soluble coffee, respectively, and roasted coffees showed higher values (p < 0.05) than soluble coffees. In addition to the previously mentioned correlations, the pH presented strong significant negative correlations (p < 0.05) with %EY for roasted coffee and moderate with %TDS for soluble coffee. Regarding %TDS, values in the range of 0.7-1.9 and 1.0 -1.4 % were found in roasted and soluble coffee, respectively. In the case of roasted coffee, the %TDS, in addition to those mentioned above, presented a significant positive correlation (p < 0.05), very strong with porosity, and strong with CBD, %EY and a*; while a strong significant negative correlation (p < 0.05) with the APS. On the other hand, the %TDS in soluble coffee, in addition to the aforementioned correlations, only presented significant moderate correlations (p < 0.05) positive with L* and negative with a*. For its part, the %EY ranged between 8.53 and 14.17 % for roasted coffee in which, in addition to the previously mentioned correlations, it presented a significant moderate positive correlation (p < 0.05) with porosity.
Analysis of physical and microbiological properties
The tests corresponding to the yeast and mold counts for all the coffee samples analyzed showed data lower than 10 UFC/g (Table 3), indicating compliance with Colombian regulations for coffee (31,32).
Table 3 Physical properties and yeast and mold counts of Colombian commercial coffees
| Sample | FLD (g/mL) | CBD (g/mL) | Porosity | APS (µm) |
|---|---|---|---|---|
| Roasted | ||||
| WB1 | 0.275 ± 0.013b | 0.306 ± 0.006c | 0.104 ± 0.049a,b | 614.330 ± 90.530c,d |
| WB2 | 0.319 ± 0.013c | 0.347 ± 0.011d | 0.080 ± 0.023a,b | 613.670 ± 109.280c,d |
| GR | 0.337 ± 0.009c | 0.459 ± 0.007e | 0.267 ± 0.009c,d | 415.330 ± 90.890a,b |
| Soluble | ||||
| SD | 0.231 ± 0.010a | 0.250 ± 0.007a | 0.075 ± 0.047a | 291.670 ± 66.610a |
| A1 | 0.205 ± 0.021a | 0.323 ± 0.009c,d | 0.363 ± 0.073d | 518.670 ± 26.160b,c |
| A2 | 0.202 ± 0.026a | 0.280 ± 0.034b,c | 0.277 ± 0.040c,d | 425.670 ± 34.990b |
| FD1 | 0.226 ± 0.005a | 0.246 ± 0.002a | 0.083 ± 0.017a,b | 614.000 ± 36.040c,d |
| FD2 | 0.207 ± 0.036a | 0.252 ± 0.013a | 0.182 ± 0.126b,c | 648.670 ± 67.300d |
| Sample | Color | Yeast and mold yeast counts (UFC/g) | ||
| a* | b* | L* | ||
| Roasted | ||||
| WB1 | 6.330 ± 0.910a | 5.530 ± 1.560a | 25.180 ± 3.150b,c | <10 |
| WB2 | 6.280 ± 1.680a | 6.750 ± 1.850a,b | 24.860 ± 4.850a,b,c | <10 |
| GR | 8.490 ± 0.370b | 9.500 ± 1.280b | 20.680 ± 1.020a | <10 |
| Soluble | ||||
| SD | 10.440 ± 0.210c | 16.650 ± 1.120d | 24.850 ± 1.400a,b,c | <10 |
| A1 | 13.520 ± 0.050e | 16.480 ± 0.960d | 21.790 ± 0.800a,b | <10 |
| A2 | 12.820 ± 0.260d,e | 12.930 ± 0.910c | 22.980 ± 1.330a,b | <10 |
| FD1 | 12.470 ± 0.070d,e | 20.610 ± 0.870e | 29.070 ± 0.610c | <10 |
| FD2 | 11.650± 1.640c,d | 16.490 ± 4.210d | 34.650 ± 3.070d | <10 |
Data were expressed as mean ± standard deviation (n = 3). Different letters in the same column indicate a significant difference (p < 0.05). For sample codes refer to Table 1. FLD: free-flow densities, CBD: compacted bulk densities, APS: average particle size.
The results obtained from the analysis of physical properties are shown in Table 3. For roasted coffee, FLD and CBD ranged from 0.275 - 0.337 and 0.306 - 0.459 g/mL, respectively. FLD only presented a strong, significant, and positive correlation (p < 0.05) with CBD, while CBD presented a significant and positive correlation (p < 0.05) strong with porosity and b*, and moderate with a*; and strong negative with the APS. In the case of soluble coffee, the FLD and CBD ranged between 0.202 - 0.231 and 0.246 - 0.323 g/mL, respectively, highlighting that the FLD and CBD of soluble coffees were lower (p < 0.05) compared to that of roasted coffees. The FLD only showed a strong, significant, and negative correlation (p < 0.05) with porosity. CBD showed a strong positive and significant correlation (p < 0.05) with porosity and moderate with a*, while it presented a moderate, significant, and negative correlation with L*.
In roasted coffee, porosity and ASP varied in a range of 0.080 - 0.267 and 415.33 - 614.33 µm; porosity, in addition to the correlations previously shown, presented a strong, significant and positive correlation (p < 0.05) with a* and b*, and a strong negative correlation with L* and APS. In the case of soluble coffees, the porosity and the ASP varied in a range of 0.075 - 0.363 and 291.67 - 648.67 µm; in addition to the aforementioned correlations, porosity showed a positive significant moderate correlation with the color parameter a*, while ASP also showed a significant positive correlation with L*. For roasted coffee, the colorimetric parameters a*, b*, and L* ranged from 6.28 - 8.49, 5.53 - 9.50, and 20.68 - 25.18, respectively, highlighting that soluble coffees presented higher values (p < 0.05) of a* and b* compared to roasted coffees. In addition to the correlations indicated above, parameter a* had a significantly strong correlation (p < 0.05) positive with b* and a negative correlation with L*, while b* had a significantly strong negative correlation (p < 0.05) with L*. For soluble coffee, the colorimetric parameters a*, b*, and L* ranged from 10.44 - 13.52, 12.93 - 20.61, and 21.79 - 34.65, respectively.
Principal components analysis (PCA) and cluster analysis (CA)
PCA was applied to evaluate the relationship between physical, physicochemical properties, and OTA content in coffee. Three principal components (PC) were obtained, which explain 95.34 and 75.65 % of the total variance for roasted and soluble coffee, respectively. Fig. 4 shows the biplot (PC2 vs. PC1, PC3 vs. PC1) of samples and coffee variables.
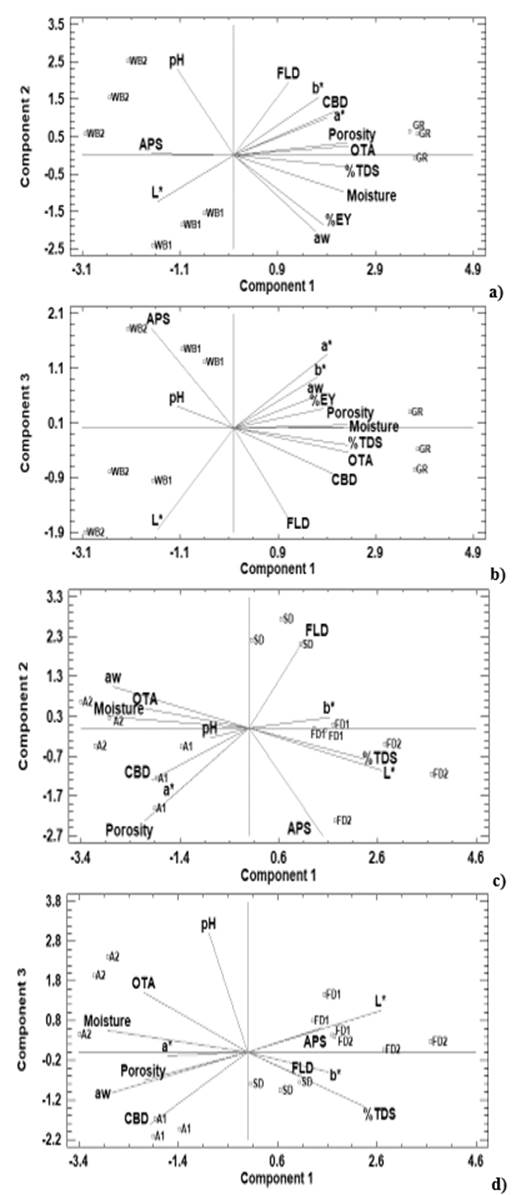
Figure 4 Principal component analysis (PCA) of the Colombian commercial coffees according to the physical determinations, physicochemical properties, and OTA content (a) PC2 vs. PC1 of roasted coffee, (b) PC3 vs. PC1 of roasted coffee, (c) PC2 vs. PC1 of soluble coffee, (d) PC2 vs. PC1 of soluble coffee. FLD: free-flow densities, CBD: compacted bulk densities, APS: average particle size, %TDS: percentage total dissolved solids, %EY: extraction yield.
For roasted coffee (Fig 4.a and b), PC1, which explains 62.54 % of the total variance, is mainly defined by the positive influence of the OTA content, %TDS, porosity, moisture, CBD, %EY and negatively by APS, which also presented a very strong and strong correlation with the OTA (Fig. 3.a), confirming an OTA relationship with properties related to the solute extraction capacity of the matrix. PC2 explains 20.582 % of the variance and is mainly characterized by pH, FLD, color (a*, b*, c*) and aw, so they are probably not associated with OTA content. The PC3 that explains 12.22 % of the variance is mainly characterized by physical properties such as color (a*, b*, c*), density (FLD and CBD), and ASP. For soluble coffee (Fig. 4.c and d), the PC1 that explains 42.12 % total variance is mainly defined by the influence of the moisture content and aw, OTA, color (a*, b* and c*), %TDS, and porosity. The PC2 explains 17.94 % of the total variance, which is defined by the FLD, ASP, porosity, and a*. The PC3 that explains 15.59 % of the total variance, is explained by the pH, OTA, CBD, and %TDS. The PCA formed three groups of samples, specifically GR, WB1, and WB2 (Fig. 4.a and b) for roasted coffee; and SD, A, and FD for soluble coffee (Fig. 4.c and d).
The CA was performed based on the principal component analysis (PCA). Fig. 5 shows the distribution of samples within the groups according to PC1 and PC2, which were harmonically grouped according to the type of coffee associated with its commercial presentation and industrial process, OTA content, and ASP. In the case of roasted coffee (Fig. 5.a) two groups were distinguished, in whole beans (Cluster 1) and ground (Cluster 2), which in turn corresponded to coffees with a high content of OTA, porosity, %TDS, %EY, and low ASP (Cluster 1); and coffees with low OTA content, porosity, %TDS, %EY, and high ASP (Cluster 2). For soluble coffee (Fig. 5.b) three groups were observed, the group of coffees spray-dried in fine powder and agglomerated (Cluster 1 and 2), where cluster 1 grouped the two types of soluble coffee with more OTA content and less ASP; and the other group consisted of freeze-dried coffees (Cluster 3), which in turn had the lowest OTA content and the highest ASP, likewise, as seen in Fig. 5.c, the CA clearly confirmed the separation between roasted coffee (Cluster 1) and soluble coffee (Cluster 2), which similarly represented the coffees with lower (Cluster 1) and higher (Cluster 2) OTA content. This method of dimension reduction could provide beneficial information to determine the relationship between OTA content and physical and physicochemical properties associated with the extraction capacity of coffee solutes.
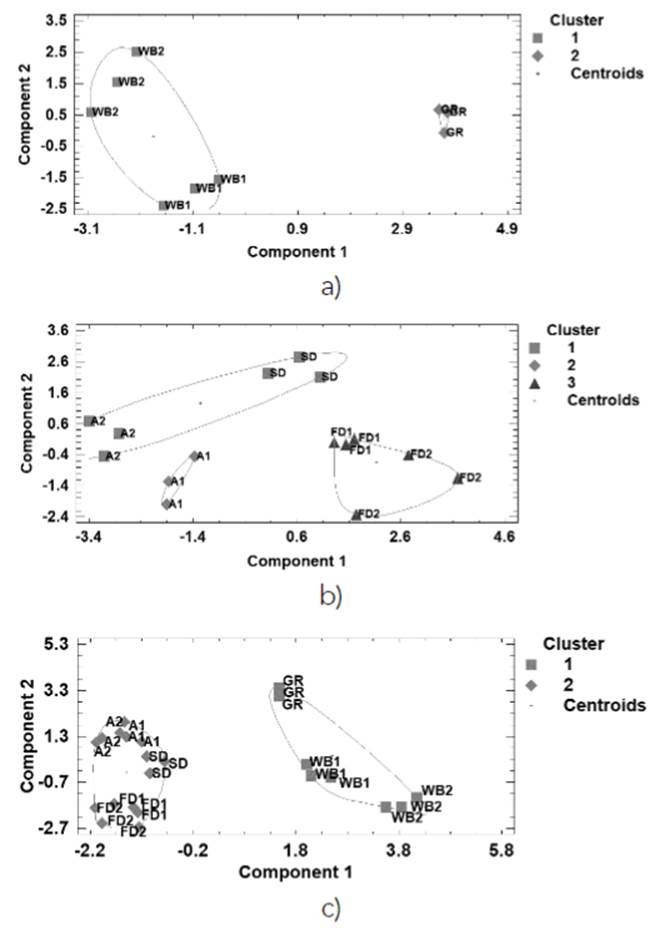
Figure 5 Clusters formed from Colombian coffee samples according to PC1 and PC2. (a) roasted coffee, (b) soluble coffee, (c) roasted and soluble coffee. For sample codes refer to Table 1.
Discussion
The highest presence (p < 0.05) of OTA in soluble coffee compared to roasted coffee could be because soluble coffee is subjected to a concentration process of the extract previously obtained from roasted coffee. Therefore, the OTA concentration could double its value (35), like other soluble components (13). Also, soluble coffee is usually made with “pasilla” (defective quality coffee), while roasted coffee with few quality defects that corresponded to excelsior coffee (WB2) and presented approximately 11 times less OTA content. The OTA content in Colombian coffee was also studied by Diaz et al. (2004) (36), who used immunoaffinity columns and HPLC, and found an average OTA content of 10 µg/Kg for green coffee and a mean and maximum concentration of 6.8 and 19.4 µg/Kg for soluble coffee, respectively, a similar result to the obtained in the present study. In other research, Franco et al. (2014) (19) used the ELISA method to detect OTA in Panama green coffee, finding OTA contents in the range of 4.90 - 37.73 µg/Kg, three of which exceeded the limits defined by European legislation (12). Regarding the toxicological aspect, and considering the assumptions proposed by Galarce-Bustos et al. (2014) (37), the per-capita coffee consumption in Colombia is 2.85 cups per day (38), therefore a daily intake (ID) of OTA is estimated from a coffee drink made from samples with the lowest (WB2) and highest (A2) OTA content, of 0.247 and 4.403 ng, which represent 1.46 and 25.89 % of the total ID (IDT) established by the Scientific Committee on Food of the European Commission EFSA (17 ng/kg body weight/day) (39), or 1.77 and 31.45 % of the IDT established by the Joint FAO/WHO Expert Committee on Food Additives (14 ng/kg b.w/day) (40).
OTA content was grouped and positively correlated with %EY, %TDS, ASP, porosity, CBD, and moisture. Castaño et al. (2000) (41) found that at low ASP, higher %EY, and soluble solids content from the coffee drink were obtained, because at low ASP there is a greater area for mass transfer, which could explain the relationship between OTA content and %EY, %TDS, and ASP. The above-mentioned indicates that their relationship is based on the ability to extract solutes from coffee. Similarly, these authors reported that the lowest %EY and soluble solids content were obtained from low-quality coffee (pasillas), which in fact, are susceptible to yeast and mold contamination due to their post-harvest handling and consequently higher OTA contents, which is consistent with the results obtained in the present study. Likewise, it has been reported that at low APS, there is high porosity (42). Also high CBD is obtained when there are high porosity values (29), which determines the mass transfer during extraction (42), confirming the possible explanation of the relationship of porosity and CBD with the OTA content given its solubility at high extraction temperatures. Although the moisture was related to the OTA content, the variables aw, pH, and color (a*, b*, and c*) were not grouped with the OTA content. Therefore, this probably did not influence the OTA’s presence, which indicates that there was probably no production of OTA in processed and packaged coffee, as confirmed by the results of the yeast and mold counts.
Conclusions
Through the application of the ELISA immunoassay technique, the quantification of OTA in coffee samples from the Colombian market was achieved, obtaining a variable range of OTA, where soluble coffees presented a higher (p < 0.05) OTA contents than roasted coffees and 25 % of the samples exceeded the limits established by the regulations, representing 1.77 and 31.45 % of the IDT of OTA defined by JECFA. The OTA content presented a significant and positive grouping and correlation (p < 0.05) with %EY, %TDS, ASP, porosity, and CBD, confirming the interdependence of these variables, which are associated with the extraction capacity of coffee solutes. In contrast, the other physical properties studied did not show important relationships with the OTA content. The yeast and mold count showed values within the regulations’ limits, showing that the OTA present in the coffee samples comes from stages prior to the coffee production and packaging process.

