


 English (pdf)
 Article in xml format
 Article references
 Send this article by e-mail
 Cited by SciELO
  Cited by Google
  Similars in
SciELO
Similars in
SciELO  Similars in Google
 Permalink
Introduction
The Colombian dairy chain is currently facing important regulatory good agricultural practices (GAP´s) problems that hinder the control of unauthorized practices, such as milk adulteration by whey addition. The mentioned conduct promotes unfair competition that leads to differences in the quality of the product and price fluctuations (1). This is why it is necessary to regulate the technical specifications of milk concerning the addition of whey and establish effective measurement methods.
Adulteration in milk production includes water, salt, glucose (or other sugar), urea, pH adjusters, melamine, malto-dextrose, whey (from the cheese-making), and other substances added to correct the protein amount and/or density values. Considering the whey is a by-product of cheese production, adulteration of milk with this substance can be recognized as an attractive solution (2).
Decree 616 of 2006 establishes the requirements that milk must-have for human consumption, which is obtained, processed, packaged, transported, marketed, sold, imported, or exported in Colombia. In addition, chapter IV, Article 14 indicates explicitly the prohibition of adding whey to milk at any stage of the production chain and the commercialization in the national territory of products intended for human consumption with the name "milk", when they present modifications in its natural composition or the addition of unauthorized substances such as whey milk (3). However, it does not establish limits, quantities, or concentrations of whey that allow establishing the adulteration of milk.
Within the last years, the possible addition of whey as an adulterant in milk, mainly used to increase the product’s volume to get economic gain has been a source of controversy (4). As whey is a natural component of milk, and due to its colligative properties, it mixes easily with it and cannot be accurately differentiated with basic control tests (5). The said use has several drawbacks; among the main ones is the fact that the whey production characteristics are not known, thus compromising the microbiological and hygienic quality of the product. Furthermore, its sanitization is not ensured, the technological properties of whey proteins do not allow the same yields in obtaining dairy products, promote unfair competition in prices and ultimately deceive the consumer by not being a product according to the definition of milk in Decree 616.
Whey protein composition indicates a heterogeneous mixture of different individual proteins, with their specific functional and physiological characteristics (6). Whey proteins are a mixture of different individual whey proteins, which are β-lactoglobulin (Molecular mass 18,3 kDa), α-lactalbumin (14,0 kDa), immunoglobulins (150 - 1000 kDa), bovine serum albumin (66,0 kDa), lactoferrin (76,5 kDa), lactoperoxidase (78,0 kDa), protease-peptone (4 - 22 kDa) and glycomacropeptide (GMP) (6,8 kDa). Excluding glycomacropeptide, all other protein components are naturally present in whey, while glycomacropeptide is produced from casein during the first step of enzymatic cheese processing (7).
The casein glycomacropeptide (CMP or c-GMP) is a protein obtained as a soluble form in whey, corresponding to 15-20% of whey proteins (6). It is a hydrophilic peptide (contains about 102-169 amino acid residues) of kappa-casein that provides stability to casein micelles in milk; It is produced by the action of rennet on kappa-casein during the production of whey. c-GMP is unique within soluble serum proteins; its structure has an oligosaccharide attached to the peptide chain and a significant contribution of phenylalanine, tryptophan, and serine. In addition, it also has high levels of branched-chain amino acids such as leucine, isoleucine, and valine (8). Those are the main reasons why various authors suggest c-GMP as a marker and indicator of whey addition in milk, and the analytical methods have been based on determining the concentration of this protein (9). Consequently, methods such as gel electrophoresis (SDS-PAGE) and high-efficiency liquid chromatography (HPLC) stand out.
SDS-PAGE is a routine electrophoretic technique used to determine the molecular weight of individual proteins and peptides. However, many researchers have documented problems during the SDS-PAGE of GMP, especially during staining, as GMP does not stain appropriately with coomassie brilliant blue (CBB) (8).
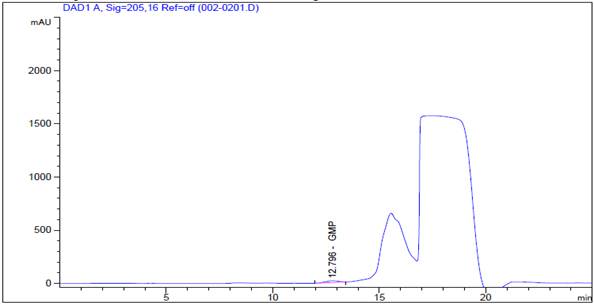
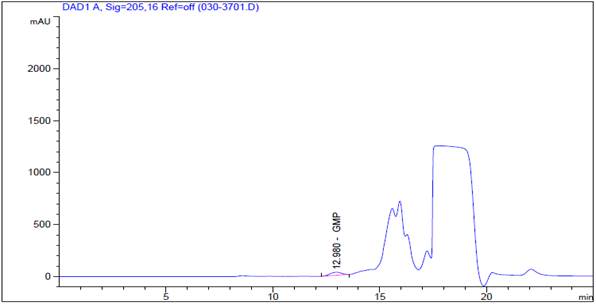
When whey is added to the milk, it does not necessarily correct the proteins or pH since the matrix has the same origin. Thus, one way to detect this fraud is by using c-GMP as a marker because it is proportional to whey addition in milk. Olieman et al. (10). proposed for the first time the use of c-GMP to detect frauds by whey addition in milk (1). The authors proposed selective milk’s proteins precipitation with trichloroacetic acid (TCA) to obtain only c-GMP in the final acid extract. The separation and identification of c-GMP were performed using a Size-Exclusion Chromatography (SEC) method, with UV detection (205nm) (1).
The currently well-accepted method for detecting whey in milk is based on the detection and quantification of glycomacropeptide protein (GMP) by HPLC (1). Therefore, implementing the high-efficiency chromatography technique for the determination of c-GMP is relevant to identifying the protein within raw milk, considering a fraction is released by natural processes related to the bacterial activity (11) or by enzymatic processes triggered by practices associated with handling and storage.
Thus, this study aimed to evaluate the potential of HPLC as an effective, sensitive, reproducible, accurate, applicable, rapid, and non-destructive technique for the quantitative detection of whey milk with adulterant in samples of raw milk via the measurement of the presence of GMP, using high-efficiency liquid chromatography. The reference method used for this analysis was based on the official physicochemical analytical method of Brazil published in Normative Instruction N ° 68 of 2006 “CMP Index” (12).
Materials and methods
Reagents
The reagents used in the analytical determination were trichloroacetic acid (TCA), potassium dihydrogen phosphate (KH2PO4), dipotassium phosphate (K2HPO4), anhydrous sodium sulfate (Na2SO4) with purity not less than 98%. Additionally, type 1 grade water was used for HPLC, Lacprodan protein concentrate (13) (Fig. 1) was used as casein glycomacropeptide (c-GMP) standard with the following information: Lot 4J1493, brand Davisco Foods, Arla Foods, whose certificate of analysis indicates purity 76% .
Taking samples for analysis
Each sample was taken from a fresh and recently milked milk canteen, using sterile packaging and subsequent conservation with 0.2% hydrogen peroxide; once collected, the sample was ensured under refrigeration (4°C +/- 2°C) until its transfer and arrival to Biotrends Laboratorios SAS facilities, where the tests were developed.
Precipitation method
The refrigerated milk was conditioned by submerging the sample in a water bath at 30°C for 10 minutes, occasionally shaking the container (inverting 5 or 6 times gently). 10.0 mL of conditioned milk were weighed in 50mL tube capacity; later, 5 mL of 24% TCA were added to the tube containing the milk. The mixture was sonicated for 20 minutes in an ultrasonic Branson model 1510 with a maximum input power from 130W. After this time, filtration was carried out through quantitative filter paper (Munktell filter discs grade 389, pore size 11μm) and 3mL of filtered liquid sample collected, then a sufficient quantity was transferred to a vial for direct injection to the HPLC and subsequent quantification (Fig. 2).
Analysis by high performance liquid chromatography (HPLC-DAD)
A diode array UV detector (DAD) liquid chromatograph LC Agilent technologies 1200 series capable of operating at 205nm, equipped with an autosampler HiP-ALS G1367B that injects between 20-100 µL were used. The size exclusion column (12) was a Zorbax GF-250 Analytical 9.4 x 250mm 4-Micron column. The mobile phase was a buffer solution pH 6.0 prepared by dissolution of 1.74 g of dipotassium phosphate (K2HPO4), 12.37g of potassium dihydrogen phosphate (KH2PO4), and 21.41g of anhydrous sodium sulfate (Na2SO4), in 700 ml of HPLC grade water, subsequently, the pH was adjusted to 6.0 using 0.1M K2HPO4 completed to 1L with type 1 water and finally the solution was filtered through a membrane of 0.45µm. For the detection of the molecule, a diode array detector at a wavelength of 205nm was used. Table 1 specifies the conditions runs.
Table 1 Size exclusion chromatography conditions
| Condition | Parameter |
|---|---|
| Injection volumen | 50 µL |
| Phase flow | 1 mL/min |
| Oven temperature | 30°C |
| Holding time | 12,9 ± 0,5 minutes |
| Total analysis time | 30 minutes |
Chemstation B 03.01 software was the tool used for data treatment and the integration parameters calculation.
Method validation procedure
Validation of the analytical method for the determination of casein glycomacropeptide (c-GMP) in milk by high-performance liquid chromatography (HPLC) was based on the recommendations of the ICH Topic Q2 (R1) Validation of Analytical Procedures: Text and Methodology (14). The criteria established to fulfill the different parameters evaluated were taken from the Official Methods of Analysis AOAC, which correspond to an RSD less than or equal to 5.3% for standards and samples prepared independently, for accuracy a percentage of recovery between 80 and 110%. The parameters applied for the method validation were linearity, detection limit, quantification limit, instrument system precision, method precision, intermediate precision, truthfulness, robustness, working interval, and uncertainty.
Results and discussion
Linearity
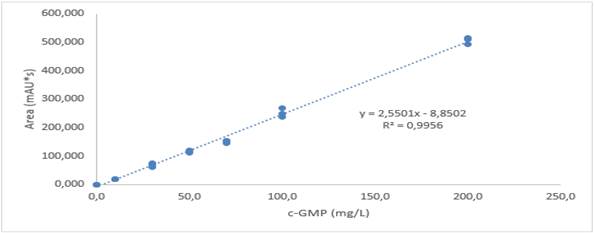
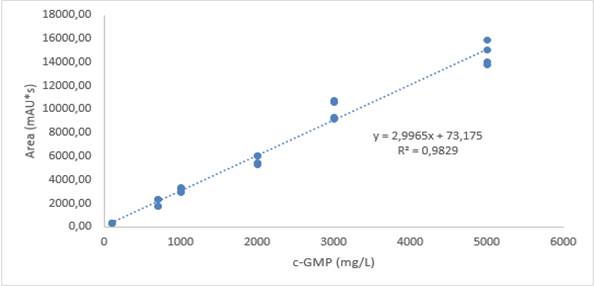
A calibration curve was made with concentrations 0, 10, 30, 50, 70, 100, 200 mg/L of c-GMP (low range) and 100, 700, 1,000, 2,000, 3,000, 5,000 mg/L of c -GMP (high range) each point of the curve was evaluated with minimum two replicates per point. A linear coefficient of determination greater than or equal to 0.95 was presented for each of worked ranges. Thus, for the low range, R2 = 0.99 was obtained (Fig. 3), and for the high range, the value was R2 = 0.98 (Fig. 4). Therefore, it was shown that there is a high correlation between the concentration of c-GMP and the area of the chromatographic peak; it is stated that in this way, the calibration curve method was able to explain the instrumental response due to the concentration of c-GMP in the analyzed standards.
Limit of quantification (LOQ)
The limit of quantification was established at a concentration of 20 mg/L because at 10 mg/L good reproducibility was not obtained (the% RSD was 54.7%). This value is lower than the “c-GMP-index”, established to the level found in raw milk in Brazil (tolerance level for milk a value of 30 mg/L) (2).
The 20 mg/ L standard was prepared and injected ten times to obtain independent results under conditions of reproducibility (same analyst, same day), and the results evaluated to have adequate repeatability (RSD less than or equal to 5.3% and a recovery percentage between 80 and 110%, according to the guideline reference AOAC 2019).
Obtained results from the limit of quantification, % recovery 103.2% and RSD 4.0%, meet the acceptance criteria established by the method for (repeatability according to the guideline reference AOAC 2019 appendix F); therefore, 20.0 mg/L is established as LOQ.
Precision
Three parameters determined the precision criteria: Instrumental system precision, method precision (analyzed by one analyst on the same day), and intermediate precision (evaluated under reproducibility conditions by two analysts on different days) (Table 2). Instrumental system precision was determined by analyzing three standards that included a concentration close to the low range of analysis (60 mg/L mean value of the linearity curve used by T.M. Campos Motta et al. (2)), medium standard (500 mg/L), and high standard (4,000 mg/L); the intermediate precision was determined in the three ranges and additionally a raw milk sample (matrix). All samples and standards were prepared, analyzed, and integrated independently by each analyst and analyzed by replicates.
In intermediate precision, the change of analyst was evaluated. We worked according to the model presented in ICH Q2 (R1) (14), where 6 replicates of samples and standards were analyzed. From the precision system and instrumental precision system and precision, results obtained demonstrate that the method is repeatable since the RSD values were less than 5.3% for the entire range and the evaluated sample. For intermediate precision, a statistical comparison was made using an Analysis of Variance (ANOVA) to assess whether there were significant differences when the analyst was changed. For each data group evaluated, it was obtained that the calculated F in all cases was lower than the critical F; therefore, it is concluded that the used method is repeatable for both analysts (Table 2).
Table 2 Results of the intermediate precision exercise are expressed in mg/ L of c-GMP.
| Parameter | Low standard 60 mg/L | Medium standard 500 mg/L | High standard 4,000 mg/L | Sample | ||||
|---|---|---|---|---|---|---|---|---|
| Analyst 1 | Analyst 2 | Analyst 1 | Analyst 2 | Analyst 1 | Analyst 2 | Analyst 1 | Analyst 2 | |
| - | 58.37 | 63.31 | 536.20 | 480.44 | 4,000.52 | 4,214.97 | 153.29 | 151.93 |
| - | 60.51 | 56.31 | 481.07 | 484.22 | 4,188.64 | 3,937.48 | 157.09 | 166.49 |
| - | 60.66 | 58.74 | 485.93 | 468.63 | 4,055.55 | 4,092.76 | 150.03 | 151.17 |
| - | 57.28 | 65.14 | 493.16 | 472.96 | 4,024.72 | 3,934.81 | 157.00 | 167.45 |
| - | 61.83 | 63.76 | 501.51 | 468.31 | 4,059.59 | 3,949.70 | 152.85 | 143.79 |
| - | 63.93 | 63.07 | 493.70 | 507.76 | 4,186.84 | 3,969.42 | 158.1 | 146.35 |
| %RSD | 3.95 | 5.54 | 3.95 | 3.09 | 2.00 | 2.83 | 2.04 | 6.54 |
Accuracy
Accuracy testing was developed on the low standard (60.0 mg/L), the medium standard (500 mg/L), and the high standard (4000 mg/L) (Table 3). Six replicas were analyzed by each analyst who participated in the validation exercise, obtaining the accuracy analysis of 12 data analyzed. The accuracy was analyzed and evaluated as the percentage of recovery found in each replicate.
As an acceptance criterion, the recovery percentage should have been between 80 and 110%.
Table 3 Results of accuracy evaluation. For each data set a recovery percentage between 80 to 110% was obtained. The method used for the c-GMP test on the working gap had the accuracy required by the method under laboratory conditions. Compliance values obtained are in relative percentage (%).
| LOW STANDARD | 60 mg/L | MEDIUM STANDARD | 500 mg/L | HIGH STANDARD | 4000 mg/L |
|---|---|---|---|---|---|
| RESULT (mg/L) | Recovery (%) | RESULT (mg/L) | Recovery (%) | RESULT (mg/L) | Recovery (%) |
| 58.37 | 97.3% | 536.20 | 107.2% | 4,000.52 | 100.0% |
| 60.51 | 100.9% | 481.07 | 96.2% | 4,188.64 | 104.7% |
| 60.66 | 101.1% | 485.93 | 97.2% | 4,055.55 | 101.4% |
| 57.28 | 95.5% | 493.16 | 98.6% | 4,024.72 | 100.6% |
| 61.83 | 103.1% | 501.51 | 100.3% | 4,059.59 | 101.5% |
| 63.93 | 106.6% | 493.70 | 98.7% | 4,186.84 | 104.7% |
| 63.31 | 105.5% | 480.44 | 96.1% | 4,214.97 | 105.4% |
| 56.31 | 93.8% | 484.22 | 96.8% | 3,937.48 | 98.4% |
| 58.74 | 97.9% | 468.63 | 93.7% | 4,092.76 | 102.3% |
| 65.14 | 108.6% | 472.96 | 94.6% | 3,934.81 | 98.4% |
| 63.76 | 106.3% | 468.31 | 93.7% | 3,949.70 | 98.7% |
| 63.07 | 105.1% | 507.76 | 101.6% | 3,969.42 | 99.2% |
According to the obtained results (Table 3), the recovery percentage was within the acceptance criteria for the concentrations evaluated. Therefore, the test method for determining c-GMP in raw milk gives accurate results in the entire range worked.
Robustness
A comparison among the obtained results in milk with and without a preservative was made to evaluate the technique's robustness. The preservative used was 0.2% hydrogen peroxide (0.67mL of 30% H2O2 per 100 mL of milk). An F test was performed to estimate whether the variances of the curves in the two different conditions are homogeneous, and subsequently, a t-student test was performed to evaluate whether there are significant differences in the obtained curves.
In the F test applied to the curves was obtained, a Fcal (0,52) < Fcri (2,47); therefore, the variance of the two slopes is homogeneous. A t-student test was performed to establish a significant difference between the two treatments (with and without the addition of a preservative). It was found that tcal (1,49) < tcri (2,02); therefore, the obtained curves (with addition and without preservative addition) are not significantly different.
Work interval
The interval is defined between the limit of quantification found experimentally in the validation exercise, and the highest sample or standard worked during the process.
According to the obtained results, it is established that the working range for the c-GMP assay, taking into account standard purity used (76%) in liquid milk, is from 15.2 mg / L to 3,800 mg / L.
Uncertainty
The uncertainty was estimated following the guidelines of the guide for the expression of measurement uncertainty - GUM. The associated uncertainty of the calibration curve that included the residual analysis of the curve obtained experimentally and the reference material was independently calculated (Fig. 5) (µcombined =2,0725), additional values calculated were uncertainty associated with sample preparation (µcombined=0,00014057) and uncertainty from validation data (Instrumental repeatability µcombined=0,012, intermediate precision µcombined=0,0116). The expanded uncertainty calculated considering a confidence level of 95% and a coverage factor of K = 2 was 4.1mg / L of c-GMP.
Conclusions
The method for determining c-GMP in raw milk was reviewed and validated using high-efficiency liquid chromatography with a UV detector and size exclusion column. The results of the validation of the method showed that the linearity criteria (R2> 0.95) are suitable for the high and low range, instrument system precision, method precision (% RSD <5.3%), limit of quantification, and accuracy (percentage of recovery between 80-110%).
This method can be used in raw milk, without any sanitization or stabilizer addition; hence, it is helpful for monitoring and control throughout the production chain: supplier selection, monitoring, and verification.
c-GMP quantification employing high-efficiency liquid chromatography by size exclusion is an appropriate methodology for industries due to its short analysis time, easy sample and standards preparation, adequate instrumental response, as well as the conditions of precision and reproducibility.
The revised and validated chromatography technique becomes a technique that is aligned with official control methodologies in countries like Brazil. This methodology quantifies c-GMP as an indicator of whey adulteration in concentrations between 15.2 mg / L to 3,800 mg / L.
The results of the validation exercise demonstrated that under the specific conditions of the laboratory, it behaves according to the characteristics for the intended use and responds to the needs of c-GMP determination utilizing high-performance liquid chromatography with a size exclusion column.

