1. INTRODUCTION
The natural products and by-products market has experienced positive growth in recent years. Consumers are increasingly aware of good eating habits and health care (1). Propolis is a natural resinous substance made by bees from their salivary secretions mixed with certain plants’ extracts or exudes (2). Its composition depends on the phytogeographic origin and constitutes a rich source of bioactive compounds with pharmacological action (3). Among the propolis compounds reported by different authors are flavonoids, aromatic acids, fatty acids, phenols, terpenoids, aldehydes, alcohols, aliphatic acids and esters, amino acids, sugars, vitamins, and minerals (4-6).
Various epidemiological studies have shown that the consumption of foods and/or medicines rich in antioxidants, such as propolis, is associated with a lower risk of suffering from chronic diseases and some types of cancer (7) as a result of their antioxidant, antimicrobial, anti-inflammatory, and cytotoxic capacity. Propolis can be considered a functional food due to the characteristics described before and its positive effect on preventing certain diseases. Besides, it can be regarded as a food preservative due to its antimicrobial and antioxidant activity (8).
In the Apidae family, Stingless bees belong to the tribe Meliponin; their sting is highly reduced, and they defend their nest by biting. Furthermore, they pollinate an estimated 40-90% of the native or cultivated species in the tropics (9). These bees produce honey, pollen, wax, and propolis (10). Their particular type of propolis has raised interest due to the detection of molecules such as cinnamoyloxy mammeissin (11), which has cytotoxic and anti-inflammatory activity (12). In addition, a recent study reports compounds such as triterpenes, gallic acid, caffeic acid, and quercetin, mostly in propolis from different regions of Brazil and Argentina (13).
The chemical composition determines the bioactivities of any propolis (A. mellifera or Meliponini ), which depends on the botanical sources, the biogeographical zones where the hives are installed, and the bee species (10,12). Particularly, Meliponini propolis presents new natural molecules with valuable bioactivity (10).
According to the National Service of Agri-Food Health and Quality (SENASA), among the leading propolis producers in the world are countries such as China, Uruguay, Argentina, and Brazil. In Colombia, the propolis production is not comparable to the countries mentioned, and its production is focused mainly on informal markets and homeopathic medicine.
The volumes of propolis produced and marketed are scarce, and there are no production figures (14). This is attributed to little knowledge and a lack of standardized methods for collection and extraction (14). The beekeepers’ interest is mostly limited to the main marketable products, such as honey, pollen, and wax.
It is necessary to search for an economical, easy, and viable extraction method accessible to all beekeepers, which allows us to think about diversifying the industrial applications of this product, as is already being done in other countries. The extraction of raw propolis by room temperature maceration was widely used. Currently, one of the advanced techniques used in propolis extraction is ultrasound-assisted extraction (15). An important advantage of this method includes shorter extraction time, higher extraction yield, and lower solvent consumption compared to conventional methods (16). This method works on the principle of making cavitation bubbles that collapse and produce higher shear, which results in a complete extraction. Ultrasound contributes to the fragmentation of the extracted material and, thus, enhances its exposure to the solvent (17,18).
Hence, the objective of this work was to compare the characteristics and yields of propolis extracts from stingless bees using two different methods: conventional extraction and ultrasound-assisted extraction.
2. MATERIALS AND METHODS
2.1. Materials
Crude propolis samples were collected from hives of Tetragonisca angustula, Melipona eburnea and Scaptotrigona spp located in La Mesa (Cundinamarca - Colombia, 4°41’38” N y 74°25’49” W, 1350 m.a.s.l.). The place is a premontane humid forest with an annual average of 24 °C and precipitation of 1,260 mm, with organic coffee and citrus production systems under shade.
The propolis samples were ground and classified using a sieve to obtain an adequate granulometry (0.200 mm) to increase the surface area and homogenize the raw material in the extraction processes. The samples were stored at 0°C and kept in amber glass jars.
Ethanol and reagent DPPH were purchased from Sigma Aldrich (St. Louis, MO, USA). Folin-Ciocalteu reagent was bought from Panreac (Barcelona, Spain), and gallic acid was acquired from Merck (Darmstadt, Germany).
2.2. Extracts Obtaining
The extracts from the three propolis samples Tetragonisca angustula (Angelita), Melipona eburnea (Melipona). and Scaptotrigona spp (Scaptotrigona), were obtained by conventional extraction (ANG, MEL, and SCT) and ultrasound-assisted extraction (ANG-US, MEL-US, and SCT-US). Two samples of propolis were analyzed for each bee specie, and three different extractions for each sample.
The method of Pobiega et al. (2019) was used with modifications (18). Thus, 1 g of each pulverized propolis sample was dissolved in 30 mL of a 70 % ethanolic solution. Samples were shaken (500 rpm) at 25 °C for 15 days using a magnetic stirrer.
For the ultrasound-assisted extraction, samples were treated as described above and sonicated using a BRANSON, CPX1800, with 40 kHz frequency for 30 minutes every 24 hours for 15 days.
The suspensions were frozen at −20 °C for 24 h and subsequently filtered using gravity and a filter with a pore size of 2.5 µm to remove waxes and less soluble substances. The solutions were evaporated to near dryness (90 % solid) in a water bath at 50 °C and stored in amber glass flasks to avoid the oxidation of antioxidant compounds.
2.3. Characterization of propolis
2.3.1. The yield of extraction:
The extraction yield was calculated with the value of soluble solids using a moisture analyzer (Citizen MB 200, India)
2.3.2. Total Polyphenols Content
The total polyphenols content of the propolis extracts was determined by the Folin-Ciocalteu method (19). Briefly, 400 μL of propolis extract were mixed with 2 mL of Folin-Ciocalteu reagent (1:10 diluted). Then, 1.6 mL of sodium carbonate (7% w/v) was added to each sample. After 30 min, the absorbance was measured at 760 nm using a spectrophotometer (X-ma 1200 Human Corporation, Loughborough, UK). The results were expressed as gallic acid equivalents (GAE) per gram of sample.
2.3.3. DPPH•-scavenging activity
Antioxidant activity was tested as described in Brand-Williams et al. (1995) (20). A volume of 100 μL of each propolis extract was mixed with 3.9 mL of 1,1-diphenyl- 2-picrylhydrazyl (DPPH•) ethanol solution (25 mg DPPH• / L). Absorbance was measured at 515 nm until the reaction reached a plateau. A calibration curve was performed using gallic acid as a standard, and the results were expressed as the mg GAE per gram of sample.
2.3.4. Physical properties of propolis
The appearance and shape of the propolis extracts were established visually and through photographic images. The pH was assessed using a digital pH meter (Oakton Instruments, Vernon Hills, IL, USA) (AOAC 981.12). The color was measured using a tristimulus Minolta colorimeter (Konica-Minolta CR-10, Japan) and reported in CIELab parameters (L*, a*, and b* values), where L* was used to denote lightness; a*, redness and greenness, and b*, yellowness and blueness. Hue angle values were calculated using the following equations:
2.3.5. Inhibition halo antibacterial test
Isolated strains of S. aureus (ATCC 25923) and E. coli (ATCC 25922) were cultivated in 150 mL of a TSB nutrient broth (Tryptone Soy Broth) and incubated at 37 °C for 12 h until reaching a concentration of 108 -109 CFU / mL. The determination of the antimicrobial activity of the propolis extracts was performed using the agar diffusion method described by Pranoto et al. (2005). Also, 1:10 dilutions of these inoculums were prepared with sterile 1 % peptone water (Oxoid) to achieve 107-108 CFU/mL. The above-described inoculum was tested by depositing 50 µL of extract (5 mm diameter) and an inhibitor control disk to each bacterium. The plates were incubated for 16 hours at 37 °C. After the incubation period, the plates were photographed to evaluate the “inhibition zone” of the extracts (21). Tests were done in duplicate.
2.3.6. Statistical Analysis
The statistical analysis was performed using Minitab v. 16 statistical software (PA, USA). Analysis of variance (ANOVA) and Tukey’s pairwise comparisons were carried out using 95 % confidence. The experiments were performed at least in triplicate, and the data were reported as mean ± standard deviation.
3. RESULTS AND DISCUSSION
3.1 The yield of extraction, antioxidant capacity and total polyphenol content
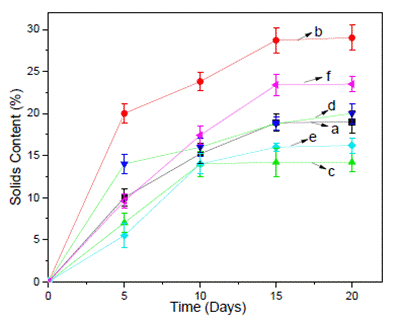
Figure 1 shows the yield of the extraction process of the different propolis obtained with conventional and ultrasound-assisted extraction over time. The values were determined gravimetrically using a moisture balance, and the results were expressed in % of the solids content.

Figure 1 Conventional extraction: (a) ANG, (c) MEL, and (e) SCT and ultrasound-assisted extraction (b) ANG-US, (d) MEL-US, and (f) SCT-US.
The solids content of the extracts ranged from 13% to 18% when using conventional extraction and 20% to 28% with ultrasound-assisted extraction. The extraction yields obtained by ultrasound-assisted extraction were higher than those obtained by conventional extraction.
All the extracts showed an increase in solids content directly proportional to the extraction time. Around the 15th day, the maximum content of solids extracted for all propolis was obtained. Afterward, a plateau was observed for the two extraction methods studied. In particular, the ANG-US propolis extract showed the highest concentration of solids, followed by SCT and MEL.
Different authors observed similar results when they used ultrasound as the extraction method (22-24). These were attributed to the acoustic cavitation effect that provides greater solvent penetration in the sample, facilitating extraction. In particularly, Yuan et al. (2019) found that the ultrasound-assisted extraction method took much less extraction time and high antioxidant activity than the pharmacopeia method (cold-maceration) (24).
Table 1 presents the antioxidant activity and the total contents of polyphenols in ethanolic extracts of propolis obtained by conventional and ultrasound- assisted extractions.
The mean content of phenols ranged from 1,884 to 925 mg GAE/100 g for the extracts obtained by conventional extraction and from 2,218 to 1035 mg GAE/100 g for those obtained by extraction assisted by ultrasound.
Meanwhile, the antioxidant activity ranged between 1,884 and 925 mg GAE/100 g and 35 to 545 mg GAE/100 g for the extracts obtained by conventional extraction, and between 2,218 to 1,035 mg GAE/100 g and 52 to 732 mg GAE/100 g for those obtained by assisted ultrasound extraction.
Table 1 Antioxidant capacity and total polyphenol content of propolis.
| Metod | Sample | Antioxidant activity (mgGAE/100g sample) | Total Polyphenol Content (mgGAE/100g sample) |
| Conventional extraction | ANG | 545 ± 16.4a | 1,884 ± 62a |
| MEL | 35 ± 2.1b | 372 ± 64b | |
| SCT | 141 ± 5.5c | 925 ± 15c | |
| Ultrasound- assisted extraction | ANG | 732 ± 12.3 d | 2,218 ± 34d |
| MEL | 52 ± 5.8 e | 1,592 ± 54b | |
| SCT | 148 ± 6.5 c | 1,035 ± 23c |
a,b,c,d,e Different letters in each column correspond to significant differences (p < 0.05).
Basyirah et al. (2018) reported a total polyphenol content between 9 to 16 mg GAE / g of Stingless Bee for propolis extracts obtained by ultrasound (25). Rebiai et al. (2014) also reported a total polyphenol content in propolis methanolic extract from the Ghardaia and Khanchla provinces of Algeria of 1,423.32 and 493.49 mg GAE/100 g, respectively (26).
Overall, extracts obtained by assisted extraction- ultrasound were richer in phenolic content and antioxidant activity. However, independently of the method used, the ANG extract presented higher values of antioxidant activity and polyphenol content when compared to the MEL and SCT extracts (Table 1). Different authors also reported this behavior when using ultrasound to extract active compounds from propolis (18,23,24,27,28) total phenolic, total flavonoid compounds and cytotoxicity to cancer cell lines of propolis extracts from two extraction methods were investigated in this study. Propolis was collected from Phayao province and extracted with 70% ethanol using maceration and sonication techniques. The antioxidant activity was evaluated by DPPH assay. Total phenolic and flavonoid compounds were also determined. Moreover, the cytotoxicity of propolis was evaluated using MTT assay. The percentage propolis yield after extraction using maceration (18.1% and different plant sources (16,29-31) a native plant from South America, has been studied due to its potential antioxidant activity. This study sought to optimize the conditions for extraction of the bioactive compounds from Macela. The solvents 50% (v/v.)
Cunha et al. (2004) reported similar polyphenol content for the same sample of propolis extract obtained by two different extraction methods (32). Cibanal et al. (2017) studied ethanolic extracts of propolis samples of different origins and harvest times using the same extraction method. (33). They obtained different amounts of total polyphenols for each of the extracts evaluated. Pujirahayu et al. (2014) indicated that those variations might be due to differences in the origin of propolis, types of bees, food resources, and harvest time (34).
3.2 Physical properties
All extracts had a pH of around 5 independently of the source and the extraction method used. This value is characteristic of ethanolic extracts of propolis (35). Similar pH values were reported by other authors who attribute them to the presence of acidic phenolic-type compounds (34-36).
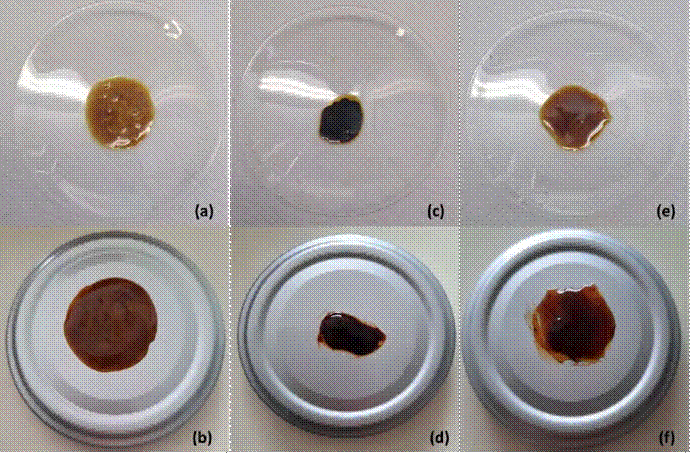
In general, the rubbery appearance of the extracts obtained by both extraction methods was similar and coincide with that reported by other authors (34,37). In particular, the ANG extract showed an increased gummy and sticky appearance (Table 2).
Table 2 Physical properties of propolis extracts
| Conventional extraction | ||||||
|---|---|---|---|---|---|---|
| Sample | Appearance | Color | pH | |||
| L* | a* | b* | h° | |||
| ANG | Gummy sticky | 37.25 ± 2.30a | 19.45 ± 3.40a | 14.05 ± 3.40a | 35.65 ± 1.90a | 5.6 ± 0.3a |
| MEL | Gummy | 9.45 ± 0.21b | 7.75 ± 0.49b | -17.02 ± 0.70b | 294.30 ± 2.26b | 5.2 ± 0.3a |
| SCT | Gummy | 27.00 ± 0.28c | 18.75 ± 0.63a | -1.60 ± 0.28c | 355.11 ± 0.98c | 5.5 ± 0.2a |
| Ultrasound-assisted extraction | ||||||
| ANG | Gummy sticky | 38.65 ± 2.33 a | 16.7 ± 0.14a | 3.50 ± 0.14d | 11.85 ± 0.35d | 5.6 ± 0.4a |
| MEL | Gummy | 16.85 ± 0.77 d | 7.45 ± 0.63b | -17.30 ± 3.60b | 293.40 ± 3.53b | 5.5 ± 0.2a |
| SCT | Gummy | 31.60 ± 0.56 c | 20.85 ± 0.77a | 5.20 ± 0.14d | 14.00 ± 0.14d | 5.6 ± 0.2a |
a,b,c,d Different letters in each column correspond to significant differences (p < 0.05).
Color variation was observed between the different soft extracts obtained. The extracts from Angelita and Scaptotrigona showed higher luminosity values (L *), that is, a lighter color when compared to the Melipona extract. All the extracts were kept in the same RGB (Red Green Blue) color space. However, changes in the tone angle (° h) were observed (Table 2). This corresponds to a description of characteristic colors (Figure 2), as follows: ANG (dark moderate red), MEL (very dark blue), SCT (very dark desaturated pink), ANG-US (desaturated dark red), MEL-US (very dark desaturated blue), and SCT-US (very dark desaturated red).

Figure 2 Photographic images of the visual appearance of the different propolis extracts: Conventional extraction: (a) ANG, (c) MEL, and (e) SCT and ultrasound-assisted extraction (b) ANG-US, (d) MEL-US, and (f) SCT-US. (a) ANG, (b) ANG-US, (c) MEL, (d) MEL-US, (e) SCT, and (f) SCT-US
Other authors described a visual appearance of various types of propolis similar to that described in our work. Dark brown color was the description used by Pujirahayu et al. (2014) for ethanolic propolis from a hive of Trigona sp. Meanwhile, Ali et al. (2012) reported propolis colors between dark brown and reddish-brown (38). The authors attributed the differences in color depending on the apiary location (geographical origin, flora, and vegetation of the area) and in its composition of flavonoids and polyphenols [40,41].
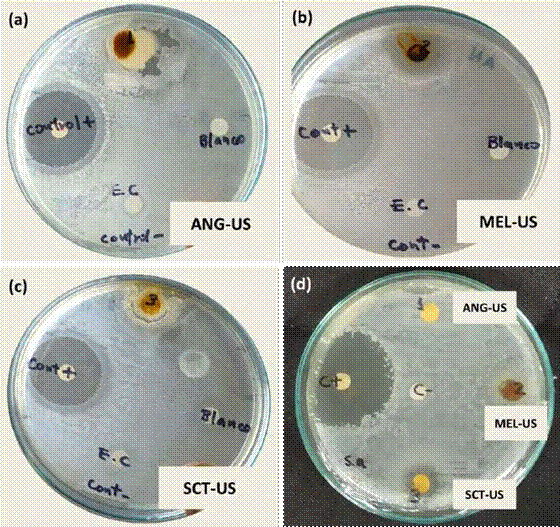
The inhibitory activity of extracts varied depending on the bacterial species. E. coli was more sensitive to the extracts studied than the S. aureus strain. Only the Scaptotrigona (SCT-US) extract showed antimicrobial activity against this last strain (Figure 3).

Figure 3 Inhibition halos of the different extracts obtained by the ultrasonic assist. Strains: (a, b, and c) E. coli (E.C.) and (d) S. aureus (S.a.).
The inhibition zones produced by the propolis extracts ANG-US and SCT-US over E. coli were small due to the thickness of the material, which made the seeding process difficult. However, the MEL-US extract showed the largest inhibition zone compared to the positive control. The SCT-US extract developed an inhibition zone over S. aureus, showing a defined halo.
Various authors reported inhibition for E. coli and S. aureus strains when they evaluated different propolis (18,35,41-43). Pobiega et al. (2019) reported inhibition for these strains with propolis from Poland (18); Dantas Silva et al. (2017) showed inhibition of Brazilian red, green, and brown propolis over the S. aureus strain (44). Seibert et al. (2019) also studied green propolis of Brazilian origin and found microbial inhibition over S. aureus (45).
Overall, our results are important for propolis use as a natural food preservative because opportunistic pathogens, such as those evaluated here, can cause a broad spectrum of infections and food-borne diseases (45,46).
CONCLUSIONS
The propolis extraction method affects yields and processing time and can vary the antimicrobial properties of extracts and the phenolic compounds’ content. The ultrasound-assisted method was suitable for enhancement and extracting more bioactive compounds from propolis.
All extracts obtained by ultrasonic-assisted extraction showed an inhibitor effect against the E. coli strain. While for the S. aureus strain, only the SCT-US extract showed the formation of a characteristic inhibition halo.
These results are promising for the food industry since propolis extracts could be a functional and active ingredient in different food formulations.


