


 Inglês (pdf)
 Artigo em XML
 Referências do artigo
 Enviar este artigo por email
 Citado por SciELO
  Citado por Google
  Similares em
SciELO
Similares em
SciELO  Similares em Google
 Permalink
The Covid-19 pandemic has become the greatest health crisis in recent human history (Souza et al., 2020), affecting not only healthcare systems but also industrial and economic sectors worldwide (Silva & Pena, 2021). Persistent exposure to its effects has been observed, producing disseminated fear and mental health repercussions (Yarrington et al., 2021), which demand constant (and intense) adaptation. The particularities of the pandemic’s burden and the varied adaptive demands have led researchers to direct attention to an extraordinary stressor at this historical moment, the fear of Covid-19, especially because of its potential influence on mental disorders (Buneviciene et al., 2022; Giordani et al., 2022; Luo et al., 2021).
The fear of Covid-19 has become a globalised and cross-cultural experience, affecting many countries and different groups. A specific scale was developed for assessing it (Fear of Covid-19 Scale (FCV-19S), Ahorsu et al., 2020), and it has been used worldwide in more than ninety studies (Alimoradi et al., 2022). Based on those investigations, there is evidence of the widespread impact of the fear of Covid-19 on psychological adjustment and psychiatric outcomes, especially when considering depression and anxiety disorders (Alimoradi et al., 2022; Luo et al., 2021; World Health Organisation (WHO), 2022a). Higher rates of anxiety symptoms were observed than before the pandemic (Buneviciene et al., 2022), and depression also showed an increase over the previous period (Feter et al., 2021).
Since the beginning of the pandemic, Brazil has been a focus of concern because various socio-demographic peculiarities seem to have influenced the impact of the pandemic in the Brazilian population. In 2020, when the virus arrived, there was a rapid spread. A low adherence to social isolation policies and an unequal access to testing (Souza et al., 2020) were noticed. In 2021, a peak in the death rate and a sustained increment in the number of new cases were observed. Brazil constantly maintained a position among the countries with the highest number of cases and deaths in the world (WHO, 2022b). Starting in 2022, the Omicron variant has spread aggressively across the country, causing a higher increase in Covid-19 cases. Despite that, probably due to specific factors associated with the severity of the new variant, the high level of contagion in the previous years and massive vaccine coverage, the number of deaths became less than the number of cases (WHO, 2022b).
In these exceptional times, mental health care may be regarded as critical throughout the Covid-19 crisis and it is a challenge for the global community in dealing with the repercussions of the psychological adjustment of confronting the pandemic (Pfeifer et al., 2021; WHO, 2022a). Therefore, to track mental disorder symptomatology in Brazil seems a pivotal target and different and innovative methods of handling data are welcome for the study of mental health issues. Accordingly, network analysis seems to be an interesting approach to dealing with topics such as one-off and ongoing interactions between the fear of Covid-19 and anxiety- and depression-related symptoms throughout the pandemic.
Initially introduced by Borsboom and Cramer (2013), the network analysis perspective proposes that psychiatric disorders should be considered as a constellation of interacting behavioural, cognitive, and affective responses that develop over time. This perspective focuses on the behavioural characterisation of mental disorders as the disorder itself, not the manifestation of a latent psychological cause, or a psychological symptom (Borsboom, 2017). Said proposal has already produced significant research data on different disorders, for instance, anxiety and depression (Contreras et al., 2019).
Consider this stylised example: a young person recovered from Covid-19 and subsequently developed a persistent fear of reinfection. Because of this, the youth avoids public places, social events, and close interpersonal interaction. This, in turn, may make them less prone to social engagement, hindering the formation of social bonds, which may contribute to feeling depressed or apathetic. These events may cause their grades to go down and promote friction with parents, which may be accompanied by feelings of not belonging and self-injurious behaviours. Hence, instead of viewing each of these behavioural events as symptoms of an underlying cause (e.g., depression), the network analysis perspective proposes a dynamic understanding of behavioural interactions and feedback loops that may lock the individual into a psychological-functioning that produces mental suffering (Borsboom, 2017). This network of interacting behavioural events persists over time and generates enduring deterioration of adaptive skills and sustained activation of stress.
In a network, each behaviour is defined as a node, and the connections between behavioural patterns (the effect one has over the other) are defined as an edge (Borsboom & Cramer, 2013). Usually, in a network analysis of psychiatric disorders, nodes are items of psychological assessment tools (inventories, questionnaires, etc.) measuring behavioural intentions or evaluations. A priori, any variable related to the phenomenon of interest may be considered a node (Epskamp et al., 2018). When the network is established, it is possible to ascertain several different indicators of its structure, such as the relative strength of each node in the dynamic of the network, the stability and replicability of the structure for different individuals or different nested networks, and so on (see Isvoranu & Epskamp, 2023). It is relevant to note that, although initial research on the network analysis of mental disorders was mainly concentrated on exploratory efforts, generating a hypothesis of association patterns among elements (nodes), recent works have expanded to compare network structures across different populations or within the same population in different periods. This has required the development of statistical techniques that compare network structures, edge strength, and global strength invariances. Those analytic strategies were implemented with the R package NetworkComparisonTest (Van Borkulo et al., 2022), which allows to contrast conditions within and/or between networks, such as the behaviour of certain psychological constructs and the psychiatric outcomes between the different Covid-19 pandemic moments.
We analysed the relationships between the fear of Covid-19 and anxiety- and depression-related symptoms based on three different surveys of the Brazilian adult population in the three first years of the Covid-19 pandemic. For this purpose, we performed a network analysis considering pandemic independent samples (one per year) with the objective of estimating the relationships of fear behaviours and mental health symptoms. It is expected, through network analysis, to provide a broader perspective on how the observed anxiety- and depression-related symptoms interacted with the fear of Covid-19 throughout the pandemic.
Method
Scenario and participants
Three cross-sectional surveys (time-point samples) were conducted in the years 2020 (Time-point 1 (TP1)), 2021 (Time-point 2 (TP2)), and 2022 (Time-point 3 (TP3)) in Brazil. The full sample integrates all the 27 states of the country and people from more than 1,000 cities. Data were collected and stored on the Survey Monkey platform by means of an electronic invitation (Instagram, Facebook, and WhatsApp) to participate in the study. To be eligible, participants had to be adults (18 or older) and living in Brazil during the period of the data collection. This study was approved by the Brazilian National Commission for Research Ethics (nº 3.955.180), and all subjects provided their electronic informed consent.
Based on an independent observation sampling method, the full sample comprised 4,560 individuals, with 88.2% females (n = 4023) and a mean age of 36.2 years (SD = 13.38). TP1 was composed of 1,520 participants (33.3%), and the data were obtained in the first week of June (2020), after nearly three months from the official first reported case of Covid-19 in Brazil (March 2020). TP2 had 1,523 participants (33.4%), and the data were collected in the second week of March (2021), one year after the Brazilian government declared Covid-19 a national public health emergency. TP3 was performed in March 2022, two years after the pandemic started in Brazil, and had 1,517 participants (n = 33.3%). A Chi-Square test was applied to compare proportions by gender and it was found that TP2 had a few more females than TP1 and TP3 (89.9% versus 87.4% and 87.3%; p = 0,037). For comparing the mean of age between the samples, an ANOVA One-way test was applied. Results showed differences in all contrasts: TP2 (M = 39.0; SD = 13.5) was older than TP1 (M = 31.6; SD = 12.1) and TP3 (M = 37.8; SD = 13.3) (both at p < 0.001). TP3 was also older than TP1 (p = 0.018).
Measurements
The Generalised Anxiety Disorder-7 item Scale (GAD-7; Moreno et al., 2016; Spitzer et al., 2006) consists of sentences describing the frequency of anxiety-related symptoms during the previous 2-week period. Each item may be scored on four ordinal levels: “not at all” (0), “several days” (1), “over half of the days” (2), and “nearly every day” (3). The total score ranges from 0 to 21 and higher scores indicate a higher frequency of the anxiety symptoms. In the current study, the GAD-7 showed high indices of reliability, with Cronbach’s Alpha (a) and McDonald’s Omega (Ω) both at 0.90.
The Patient Health Questionnaire-9 (PHQ-9; Kroenke et al., 2001; Osório et al., 2009) evaluates the presence of depression-related symptoms over the previous two weeks. Nine questions are scored from 0 to 3, similar to the GAD-7. A total score from 0 to 27 reflects the presence and severity of the symptoms. We found satisfactory reliability (α and Ω of 0.90).
The Fear of Covid-19 Scale (FCV-19S; Ahorsu et al., 2020; Faro, Silva, et al., 2022) describes thoughts and feelings related to the risk perception of contamination and/or exposure to the Covid-19 virus. It consists of seven items scored from 1 to 5 (“strongly disagree,” “disagree,” “neither agree nor disagree,” “agree,” and “strongly agree”). The total score goes from 7 to 35, and higher scores reflect a greater fear of the Covid-19 virus. The reliability of the FCV-19S was satisfactory (α and Ω of 0.87).
Network estimation
Network analyses were performed in R (version 4.1.2), applying the packages bootnet 1.5, qgraph 1.9.1, and NetworkComparisonTest 2.2.1 using Rstudio (version 2022.02. 0+443). Descriptive statistics were completed in JASP 0.11.1. In the network structure, the items of the GAD-7, PHQ-9, and FCV-19S are represented as nodes, and the correlations between the items are the edges. The estimator EBICglasso was applied, which reduces weak statistical relationships to zero and allows for identifying only the most relevant edges in the network. All variables were regularised as a polychoric correlation matrix using the command “cor_auto” (qgraph) due to the ordinal level of the responses to the instruments.
The “strength” of the nodes was calculated, by centrality analysis, following directions on the most stable and straightforward indicator to be computed for identifying critical nodes in the network. This index, found by the sum of the all edge-weights that a node is related to, shows the magnitude of the correlations among them. The accuracy and stability of the network were evaluated by bootstrapping analysis (nonparametric with 1,000 samples) for the centrality and edge-weight parameters. First, confidence intervals (CI 95%) were calculated for the edges to estimate their true values, with small ranges indicating more accuracy. Second, difference tests based on the bootstrapping were estimated, and the absence of zeros in the CI (95%) indicated a significant difference between the edge-weights or node strengths throughout the simulated subsamples. Finally, the CS-coefficient analysis was carried out in order to detect the constancy of the centrality index throughout the bootstrap subsample.
Contrasts between the TP1, TP2 and TP3 networks were analysed using the package NetworkComparisonTest (Van Borkulo et al., 2022). One thousand permutations were performed, and three parameters were compared: structure (Network Structure Invariance (NSI)), global strength (Global Strength Invariance (GSI)), and centrality index (Edge-Weight Strength (EWS)). Bonferroni correction was applied to estimate the statistical significance (p < 0.05). Three comparisons were done: TP1 vs. TP2; TP1 vs. TP3; TP2 vs. TP3.
Transparency and openness
We report the method, platform, and software used for the data collection, all statistical analyses, and the instruments applied. Datafile, all analytic code, additional results, Tables or Figures are reported in the online supplemental materials. The datasets generated during and/or analysed during the current study are available in the OSF repository, https://osf.io/7v96n/
Results
Descriptive statistics
Table 1 presents descriptive data by samples. At TP1, three FCV-19S items showed values above 70%: iFCV2 (It makes me uncomfortable to think about coronavirus-19; 77.7%), iFCV1 (I am most afraid of coronavirus-19; 75.9%) and iFCV5 (When watching the news and stories about coronavirus-19 on social media, I become nervous or anxious; 73.5%). TP2 had the same three items with the highest values but with percentages over 80%: iFCV1 (85.2%), iFCV2 (83.3%), and iFCV5 (80.6%). Although TP3 did not show any item of the FCV19-S with a percentage superior to 70%, the most frequent ones were also the same for TP1 and TP2: iFCV2 (62.8%), iFCV1 (59.7%), and iFCV5 (51.9%). Notably, iFCV2 was the most common thought or feeling related to the fear of Covid-19 in all samples. All scores of FCV19-S registered smaller values at TP3.
Table 1 Descriptive Statistics of the Fear of Covid-19 Scale (FCV-19S), Generalised Anxiety Disorder Scale 7-items (GAD-7), and Patient Health Questionnaire 9-items (PHQ-9)
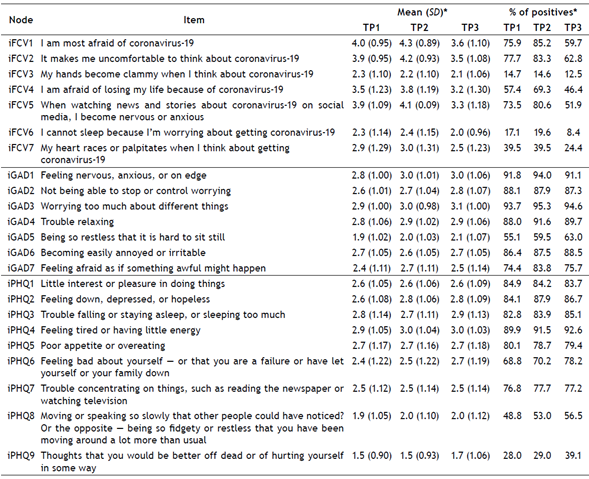
Notes. TP1 = Time-point 1 (June 2020, n = 1520); TP2 = Time-point 2 (March 2021, n = 1523); TP3 = Time-point 3 (March 2022, n = 1517).
* Most part of the item distributions presented high skewness or kurtosis.
** Proportion of items answered 4 (agree) or 5 (strongly agree) in the FCV-19S and 1 (several days), 2 (more than half of the days) or 3 (nearly every day) in the GAD-7 and PHQ-9.
Most of the GAD-7 items presented values above 70%. Some of them showed an occurrence of over 90%: iGAD1 (Feeling nervous, anxious, or on edge) and iGAD3 (Worrying too much about different things) in the three samples (91.8% and 93.7% for TP1, 94.0% and 95.3% for TP2, and 91.1% and 94.6% for TP3). Another interesting finding is that iGAD5 (Being so restless that it is hard to sit still) and iGAD6 (Becoming easily annoyed or irritable) became more frequent through the samples: 55.1% and 86.4% (TP1), 59.5% and 87.5% (TP2), and 63.0% and 88.5% (TP3).
The PHQ-9 also exhibited high values in some items, especially iPHQ4 (Feeling tired or having little energy), which presented a progressive increment (89.9%, 91.5%, and 92.6% for TP1, TP2, and TP3, respectively). Similar to iPHQ4, the following also increased through the samples: iPHQ3 (Trouble falling or staying asleep, or sleeping too much; 82.8%, 83.9%, and 85.1% for TP1, TP2, and TP3, respectively), iPHQ6 (Feeling bad about yourself - or that you are a failure or have let yourself or your family down; 68.8%, 70.2%, and 78.2% for TP1, TP2, and TP3, respectively) and iPHQ8 (Moving or speaking so slowly that other people could have noticed? Or the opposite - being so fidgety or restless that you have been moving around a lot more than usual; 48.8%, 53.0%, and 56.5% for TP1, TP2, and TP3, respectively). Another increase was found in iPHQ9 (Thoughts that you would be better off dead or hurting yourself in some way), even with lower values; it started from 28.0% at TP1, increased to 29.9% at TP2, and 39.1% at TP3.
Network analysis
Figure 1 plots the network of the three time-points under analysis. The networks were composed of 23 nodes and 253 edges. Only 57 were correlations above 0 at TP1, and 52 at TP2 and TP3. The largest edge-weights were found within the set of nodes for each scale, being, basically, the same at TP1, TP2, and TP3. Considering they have the same arrangement, a visual audit suggests a progressive, more parsimonious network when comparing the densities (quantity and thickness of the edge-weights) from TP1 to TP3.
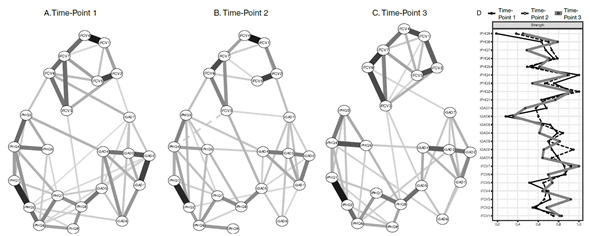
Notes. Items are represented as nodes (circles). Strength statistics (relative scores) of each node in the network (on the right side). Continuous lines (edges) are positive partial correlations and the dashed line is a negative partial correlation between the nodes. The thickness of the lines represents the strength of the correlation between the nodes (edge-weights); the thicker the line, the stronger the correlation. Absent edges between nodes means that no statistically significant partial correlation was detected after running the lasso algorithm (EBICglasso estimator). Each network represents a sample. A - Time-point 1, June 2020; B - Time-point 2, March 2021, and C - Time-point 3, March 2022. D - Centrality index plot (Strength) of all nodes within each time-point. Lines represent each sample. The closer to the right side, the higher the strength.
Figure 1 Three Estimated Networks for Fear of Covid-19 (Fear of Covid-19 Scale, FCV-19S), Anxiety (Generalised Anxiety Disorder 7-item Scale, GAD-7) and Depression (Patient Health Questionnaire 9-item, PHQ-9)
In common with the three samples, the highest correlation between nodes within the FCV-19S were iFCV1-iFCV4 (I am afraid of losing my life because of coronavirus-19) and iFCV2-iFCV5. Particularly at TP3, the relationships iFCV3 (My hands become clammy when I think about coronavirus-19) -iFCV6 (I cannot sleep because I’m worried about getting coronavirus-19) and iFCV6-iFCV7 (My heart races or palpitates when I think about getting coronavirus-19) reached their highest interaction. As a whole, the FCV-19S presented strong relationships among the nodes for all samples. If only the GAD-7 items are considered, the strongest relationships are iGAD1-iGAD2 (Not being able to stop or control worrying) at TP1 and iGAD3-iGAD4 (Trouble relaxing) at TP2 and TP3. The number of edges of the GAD-7 went from a larger intricate grouping of nodes at TP1 to fewer interactions in the other samples. For the PHQ-9, a robust edge-weight was found between iPHQ1 (Little interest or pleasure in doing things) and iPHQ2 (Feeling down, depressed, or hopeless) in all samples. Another regular and thick edge-weight throughout the samples was iPHQ3-iPHQ4. The density of PHQ-9 may receive the same observation given to the GAD- 7: it seemed to become less dense from TP1 to TP3.
At the intersection of the scales GAD-7 and PHQ-9 with FCV19-S, few edges were detected. There were four at TP1, five at TP2, and three at TP3. Moreover, iGAD7 (Feeling afraid as if something awful might happen) was the common edge between GAD-7 and FCV19-S throughout the samples. Further, iGAD5 showed relationships with iFCV3 at TP2 and TP3 but not at TP1. In addition, iFCV2 had interactions with iGAD7 at TP1 and TP2 but not at TP3. On the link between PHQ-9 and FCV19-S, there was no regular edge to the three samples. Only at TP1 and TP2, the edges iPHQ3 and iFCV6 were present. In the case of iPHQ8, there were relationships with iFCV3 at TP1 and TP3. At the intersections between the GAD-7 and the PHQ-9, there were fewer edges from TP1 to TP2 (from seven to four), but the quantity was maintained at TP3 (four), with a similar density.
The centrality analysis indicated there was relative similarity through visual checking, especially among the main nodes (Figure 1). The highest strength by scale, which means the most central nodes per instrument, were as follows: iPHQ2, iFCV7, and iGAD2 for TP1, iPHQ2, iFCV6, and iGAD1 for TP2, and iPHQ4, iFCV7, and iGAD3 for TP3.
The case-dropping bootstrapping did not present significant changes during the simulation of the subsets to the three time-points. These results indicate the stability of the network, which is CS-coefficient for strength and edge-weights that are above 0.5, as follows: 0.60 and 0.75, 0.60 and 0.75, and 0.67 and 0.75, respectively, for TP1, TP2, and TP3. Bootstrap analysis also demonstrated that edge-weights and nodes-especially the former-exhibited narrow CIs (95%) and significant statistical differences from one another in the most powerful edge-weights and nodes (see Supplementary Materials on OSF repository). These findings support the suitable accuracy and stability of TP1, TP2, and TP3.
Network comparisons
Of the three comparisons executed, one of them did not show any significant difference in the NSI, GSI, and EWS (TP2 vs. TP3; p > 0.05). Specifically, in the EWS, TP1 vs. TP2 and TP1 vs. TP3 did not show a statistically important distinction (p > 0.05). Although the other two sample contrasts revealed that they are very similar overall-that is, the vast majority of the edges and nodes did not change their impact or role throughout the comparisons, few differences were detected. Table 2 summarises these differences between the samples.
Table 2 Edges and Edge-Weights with Statistically Significant Differences in Comparisons of Three Time-points (2020, 2021, and 2022) on Fear of Covid-19 (Fear of Covid-19 Scale, FCV-19S), Anxiety (Generalised Anxiety Disorder 7-item Scale, GAD-7) and Depression (Patient Health Questionnaire 9-item, PHQ-9)
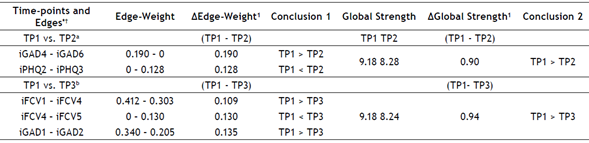
Notes. a Network Invariance Test, p = 0.01; Global Strength Invariance, p = 0.005.
b Network Invariance Test, p = 0.01; Global Strength Invariance, p = 0.005.
¹ All p-values < 0.05.
* No comparison presented statistically significant differences in the centrality index (Edge-Weight Strength (EWS)).
† There were no significant differences in the Network Invariance Test and Global Strength Invariance (p > 0.05) in TP2 vs. TP3.
In the two remaining comparisons (TP1 vs. TP2; TP1 vs. TP3), both showed differences in the NSI and the GSI. In the case of the GSI, this indicates that one of the compared networks is more strongly interconnected than the other. Here, TP1 had higher global connectivity in relation to its counterparts in the analysis, TP2 and TP3. The significant discrepancy in the NSI can be related to the distinct edge-weights of the network. There were five edge-weight differences, all of them were between items of the same scale and not among distinct measurements (Table 2). For instance, in TP1 vs. TP2, an increased edge-weight was found for iGAD4 and iGAD6 for TP1. Something similar happened between iPHQ2 and iPHQ3 (TP1 < TP2), iFCV1 and iFCV4 (TP1 > TP3), iFCV4 and iFCV5 (TP1 < TP3), and iGAD1 and iGAD2 (TP1 > TP3). Thus, TP1, TP2, and TP3 networks were very similar overall. However, some caution in this interpretation may be adopted, because a few nodes and edge-weights may receive more attention when compared to structure or density during pandemic time-points.
Discussion
This is the first study that performed a network analysis of the fear of Covid-19 and anxiety- and depression-related symptoms at three different moments of the Covid-19 pandemic in Brazil. For this reason, we assessed and compared three network structures and their indices in three samples. It was found that there were many aspects of similarity between the networks and estimated indicators, which suggested an analogy pattern in the first three years of the pandemic. The main change was detected in the network density, with a general reduction in the number of edges. There was a noted increase in anxiety- and depression-related symptoms in the samples from 2020 to 2022, reinforcing the role of specific nodes and edge-weights per time-point, unlike what was observed with regard to the fear, which showed a decrease.
Occurrence of complaints and symptoms
The harmful impact of the pandemic on psychological adjustment was realised. Thinking, talking, and listening about the pandemic were elements that triggered discomfort, with “being uncomfortable when thinking about Covid-19” appearing as the most frequent fear indicator in the three samples. The Infodemic, that is, an overexposure to information about Covid-19 (https://www.who.int/health-topics/Infodemic ), can help to understand how thinking about the Covid-19 pandemic has become almost globally ubiquitous in the last three years. The uncontrolled proliferation of information (including some false or unreal) contributes to the weakening of a more effective ability to deal with adversities related to the pandemic (Pan American Health Organisation (PAHO), 2020). This is reinforced by studies that have already pointed out the deleterious effect of the news flood on the ability to manage fear, risk perception, and the consequences of Covid-19, regardless of whether they are official sources, scientific platforms, or fake news (Freire et al., 2021; Tentolouris et al., 2021).
The findings showed the lowest frequencies of all nodes related to the fear of Covid-19 in March 2022 (TP3), which may be related to the change in the status of the pandemic in Brazil. From January 2022, official data reveal a progressive reduction in the number of cases and deaths from Covid-19 in the country, especially due to the high proportion of population the vaccinated or immunised since the beginning of the pandemic (Fiocruz, 2022). It was also found that there was a consistently high frequency of anxiety symptoms and that the depression-related symptoms tended to show increment (even starting from high percentages), which suggests that the impact on mental health still reverberates numerous issues within the pandemic context (i.e., Souza et al., 2020; Wang et al., 2022). Studies from several countries also highlight the persistence of mental health problems, even with the reduction of the risk of contagion and/or death (Ettman et al., 2022). Notably, the indicator that assesses self-harm and suicidal ideation has grown since 2020 and another study had also pointed out similar concerns in Brazil (Faro, Lisboa, et al., 2022), which reinforces the concern that this emerging issue should be monitored (WHO, 2022a).
General aspects of the network structure
Overall, interactions within the networks became less dense when contrasting the time-points. However, a similar change does not apply to the strength of the links between the edges and the nodes themselves, because there was no significant variation in the centrality index in any of the comparisons. Given this fact, it would be possible to think that the pandemic had a greater disorganising impact at its beginning, which is expected (Souza et al., 2020; WHO, 2022a; Yarrington et al., 2021) and can be translated by the greater number of connections within TP1. However, the findings suggest the development of more stable ways of dealing with adversities related to the pandemic (Fluharty et al., 2021; Shamblaw et al., 2021), which can be illustrated by the reduction of observed interactions within each instrument from 2020 to 2022.
Notwithstanding, we hypothesised that the potential improvement of stress management skills throughout the pandemic did not significantly minimise the concentration of effects on certain elements of the networks, such as edge-weights (e.g., “being afraid” (iFVC1) - “losing life” (iFCV4)) and nodes (e.g., “palpitation” (iFCV7) and “feeling down” (iPHQ2)). This suggests a more persistent impact of pandemic stress on determining aspects of the adaptive capacity instead of an unspecific repercussion. Hence, a state of overload in edges and nodes can help to understand the consistently high percentage of anxiety and depression symptoms when comparing the samples. Regarding the relationships between constructs, fear interacted with anxiety- and depression-related symptoms in a relatively balanced way in the samples, ranging from four to five interactions between TP1 and TP2 to three in TP3. Despite these links, the amount can be considered low, due to the number of possible edges between the FCV-19S with the GAD-7 and the PHQ-9 (49 and 63, respectively). This shows that even while maintaining a relationship, the interplay between measures was concentrated on a few nodes. An example is the symptom “Feeling afraid as if something awful might happen” (iGAD7); it was important between the fear of Covid-19 and anxiety in the three samples, which suggests noxious negative expectation and uncertainty during the pandemic (Seco-Ferreira et al., 2020).
In contrast, no node with a consistent relationship between symptoms of depression and the fear of Covid-19 was detected in the three samples. The most common was the edge between “cold hands” (iFCV3) and “psychomotor changes” (iPHQ8), which appeared in June 2020 (TP1) and was the only remaining one in March 2022 (TP3). Regarding psychomotor changes, their relevance in a network analysis had already been observed in other studies during the pandemic (Wang et al., 2020), indicating their prominent role in understanding mental disorders during the Covid-19 crisis. Notably, even though lockdown policies and social distancing may help to explain the peculiar importance of iPHQ8 in reflecting mental decline (Budimir et al., 2021), in the current study, this was detected in the latter sample when more restrictive displacement rules were not in effect in Brazil. In China, psychomotor changes decreased after the peak phase of the Covid-19 pandemic, and fewer restrictions on movement may explain said reduction (Wang et al., 2020). For this investigation, such an interpretation cannot be applied. Otherwise, it is possible that endorsing such depression-related symptoms reflected a fluctuation of a specific mental impairment over the last years. In particular, it does not seem to represent an intrinsic response to physical restrictive health policies but rather a way of revealing a general psychological discomfort in confronting the pandemic. For example, feeling “cold hands” (iFCV3) as an item regarding the fear of Covid-19 with consistent occurrence between the samples refers to an autonomic reaction (vasoconstriction) to aversive situations (Hornstein et al., 2022). Its representativeness in these samples deserved attention because it was an influential node regarding the presence of some type of connection with anxiety or depression, despite being, on average, the least frequent fear complaint.
In terms of better representing each construct per sample, it sounds plausible to try to relate them to the external scenario of the pandemic. In June 2020 (TP1), Brazil was dealing with the arrival of the disease and the increase in the number of cases (Castro et al., 2021), evoking the shared experience of fear through the feeling of palpitation (iFCV7), with the difficulty of controlling preoccupation (iGAD2) and the presence of sadness or hopelessness (iPHQ2) when faced with the Covid-19 outbreak. In March 2021 (TP2), the population had been at the peak in the number of daily deaths from Covid-19, which added to a new exponential increase in the infection rate (Silva & Pena, 2021). As a result, difficulties in sleeping (iFCV6), feeling at the limit of their ability to cope (iGAD1), and sadness or hopelessness (iPHQ2) reflected the stressful experience throughout that period. In March 2022 (TP3), although there was an explosion of cases in most of the country (Fiocruz, 2022), the fatality rate was lower, and more than 80% of the population had received some dose of the Covid-19 vaccine (Consortium of Press Vehicles (Consórcio Brasileiro de Veículos de Imprensa), March, 2022, https://sigmaawards.org/consorcio-de-veiculos-de-imprensa-consortium-of-press-vehicles/ ). Despite the more favourable scenario, compared to the previous two years, palpitation (iFCV7) was still present, with excessive worries (iGAD3) and the feeling of deterioration (iPHQ4) remaining as echoes of the worst moments of the pandemic. Accordingly, it is noteworthy that the assessment of the consonance between the epidemiological moment and the strongest items can help to understand the most important symptoms or complaints in the structure of the networks over the last three years.
Network comparisons
When contrasted, TP2 and TP3 showed a broad equivalence, which represents proximity between the network operations for the 2021 and 2022 samples, even though the data collections took place one year apart. This finding reinforces the idea that there was something akin to a conservation in the strength of the nodes and their interactions, which would help to explain the prolonged effects, that is, the increased occurrence of symptoms.
The differences between the networks were concentrated at TP1 when compared to the other two samples-the networks for June 2020 (TP1) were denser. As previously documented, this seems to refer to the disorganising impact of the arrival of the pandemic and its far-reaching consequences in people’s daily lives (i.e., Fluharty et al., 2021; Wang et al., 2020; Yarrington et al., 2021). More specifically, only five interactions differed in the relationship between TP1 and TP2 or TP3. All of them occurred within the measurements themselves and not between instruments. In June 2020 (TP1), it was more common to perceive themselves as easily irritated (iGAD4) and to have difficulties in relaxing (iGAD6), which was not observed in March 2021 (TP2). Feeling sad or hopeless (iPHQ2) and changes in sleep (iPHQ3) were more closely related in March 2021 (TP2), which was not detected in June 2020 (TP1). To be most afraid of Covid-19 (iFCV1) and its relationship with fearing death (iFCV4) was more intense in June 2020 (TP1) than in March 2022 (TP3). However, the relationship between fear of death from Covid-19 (iFCV4) and exposure to news about the pandemic (iFCV5) was more intense in March 2022 (TP3), but did not appear in June 2020 (TP1). Finally, the interaction between the ability to control worries (iGAD1) and feeling on edge (iGAD2) was higher at TP1 than at TP3. These variations in the intensity of the edges reiterate the notion that these manifestations accompanied the course of the risk scenario and emotional discomfort insofar as the pandemic unfolded (Ettman et al., 2022; Shamblaw et al., 2021). Nonetheless, it is worth noting these findings did not point to substantial changes in the relationships between the evaluated constructs, suggesting a pattern for the dynamics between fear and anxiety or depression.
Limitations
The generalisation of the findings deserves caution, considering that the sampling method adopted did not randomise the participants. Besides, this was not a repeated sample design, although the data were collected at three different periods of the pandemic, limiting to support explanations of causality. We point out that there was an interval of approximately 12 months between each data collection, which does not represent all the epidemiological scenarios of Covid-19 in Brazil between 2020 and 2022. Thus, the data collections focused on the more general patterns of data on the pandemic, which more appropriately applied to the entire country at those times. Another important caveat is that we did not estimate a differential impact of gender or age on fear-, anxiety- and depression-related behaviours in these samples. As we did not have balanced samples by gender and age mean, it is not possible to conclude about such effects on the networks. This is a meaningful limitation and, because the literature has also been emphasising these impacts, we suggest that future studies consider the aforesaid analysis.
Conclusions
Our findings showed that network analysis may provide in-depth comprehension of the interplay between the fear of Covid-19 and anxiety- and depression-related symptoms at different moments throughout the pandemic. The main findings seem to reflect a specific dynamic of reinforcement of some nodes and edges within-and not between-the constructs in the last three years. Therefore, we expect these results will assist clinical practitioners in fostering mental health care and psychological adjustment, especially in view of the cognitive and emotional sequelae derived from the pandemic scenario, which remains until now, and probably in the years to come, a growing public health concern. 1 2

