


 English (pdf)
 Article in xml format
 Article references
 Send this article by e-mail
 Cited by SciELO
  Cited by Google
  Similars in
SciELO
Similars in
SciELO  Similars in Google
 Permalink
Introduction
Superconductors can be classified in type I and II. Type I superconductors are materials that exhibit zero resistance and perfect diamagnetism below a critical field Bc, and become normal in higher applied fields. Their coherence length (ξ) is larger than their penetration depth (λ), so it is not energetically favorable to form boundaries between their normal and superconducting phases [1]. All the superconductors elements are type I except Niobium. On the other hand, type II superconductors are materials where λ > ξ.In this case, it is energetically favorable to form domain walls between superconducting and normal regions [1]. When a type II superconductor is in a magnetic field, the energy can be lowered producing domains of normal material containing trapped flux. When the applied magnetic field exceeds the lower critical field called Bc1, the magnetic field penetrates in quantized form creating symmetric domains (vortices). Slightly above Bc1, the magnetic field is strong in the normal core of the vortices and decreases with distance from the core [2]. By increasing the applied field the vortices overlap and when the applied field reaches a value named B c2, the material becomes normal. Type II superconductors also have zero resistance but exhibit perfect diamagnetism only below B c1. The superconductors used in practical applications like alloys, compounds and high Tc cuprate-superconductors are Type II because of they have high transition temperatures (Tc), carry large currents and can operate in high magnetic fields [3].
The nature of the superconductivity in classical superconductors has been explained by the microscopy theory of Bardeen, Cooper and Schrieffer (BCS) [4], and the phenomenological theory of Ginzburg-Landau [5] is helpful for explaining many others properties of superconductors. There are yet other approaches (models): Bean model [6,7], Fixed Pinning model [8], Kim model [9,10], etc., which have been used by many experimentalists as an aid to interpreting their experimental data. These models establish that for low applied fields or currents, the outer part of the superconductor is in a so-called critical state with special values of the magnetic field and current density, and that the inner part is shielded from these fields and currents. The Bean model for example, assumes that the current density always has a magnitude of J
c. In all the critical state models the magnetic field
 and the current density
 are coupled by the Maxwell equation

The interaction between a type II superconductor (HTS) and a permanent magnet (PM) permit to determine the levitation (repulsion) and suspension (attraction) forces between them [11]. Due to the potential applications like energy storage systems [12-14], levitating vehicles [15-19] high-speed bearings [20,21], etc., this subject has become of great interest in the last three decades. The force measurement is done by varying the distance HTS-PM and therefore many types of measurement systems have been designed to measure the force in one, two or three spatial dimensions [22-24]. Important characteristics of the superconductors like critical currents, magnetization, etc., can be deduced from these measurements [25,26]. However, since both the levitation and suspension phenomena in an HTS-PM system are determined when the interaction force has the opposite direction to gravity, which compensates the weight of the HTS or the PM, the most common measurement of this type of interaction is the one performed vertically [27].
Experiment
Figure 1 shows the experimental setup developed to measure the interaction forces in the HTS-PM system, which is based on the experimental framework described by S. O. Valenzuela et. al. [28]. A digital balance (Citizen CY 204) was used, with a resolution of 10-4 g and a maximum capacity of 220 g. The permanent magnet of Nd-Fe-B, with dimensions 4,0 x 2,5 x 0,5 cm3, was fixed 7 cm above the pan of the balance in order to avoid magnetic interference. The system also includes an endless screw, which allows moving the HTS sample in ascending and descending way. An optical sensor attached to a digital Vernier, with a resolution of 0.01 mm, measures the relative distance HTS-PM with high accuracy. The superconducting samples used were permanently immersed in liquid nitrogen and attached to a polycarbonate arm. The balance properly calibrated displays positive and negative values when the force is repulsive and attractive respectively.
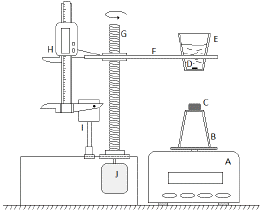
Figure 1 Experimental setup: (A) Electronic balance with digital display, (B) pan of the balance, (C) neodymium permanent magnet, (D) superconducting sample, (E) vessel with liquid nitrogen, (F) polycarbonate arm with optical sensor, (G) endless screw, (H) digital Vernier caliper, (I) support for the digital caliper, (J) DC electric gear motor in order to move the HTS sample vertically at constant velocity (between 0.2 mm/s and 1 mm/s). The balance properly calibrated displays positive and negative values when the force is repulsive and attractive respectively.
The ascent and descent measurements were carried out continuously in the FC and ZFC regimes for each sample. All of the measurements were performed cyclically from a distance of 1 mm between HTS and PM, up to a maximum distance of approximately 45 mm. The system was automated using an arduino-software, which permits to control the movement of the sample and the data acquisition, and it measures the relative position of the sample as well as the values of the interaction forces HTS-PM.
Results and Discussion
In order to test the system, two superconducting (YBCO-123) samples were used: a disk-shaped sintered sample (S) with a diameter of 10 mm and thickness 4 mm, and a rectangular melt textured growth sample (MTG) with dimensions 1,4 x 1,0 x 0,2 cm3. The X-ray diffraction patterns for both samples present the characteristic peaks and intensity relations of the YBCO-123 superconducting phase [29,30]. Other superconducting and non-superconducting phases were not detected within the experimental sensitivity. The Oxygen contents in both samples were obtained from the lattice parameters [31-33]. The obtained values were δ > 0,15 and δ ≤ 0,10 for the S and MTG samples, respectively, which agrees with the superconducting behavior observed in these samples.
Figures 2 and 3 show the behavior of the force as a function of the distance HTS-PM for the MTG and S samples, respectively. The hysteresis curves show that the behavior of the force as a function of the distance and its maximum value depend on the increasing or decreasing of the relative distance HTS-PM and on the cooling process ZFC (Zero Field Cooling) or FC (Field Cooling). It is worth to note that in the ZFC regime the cooling of the sample was done removing completely the permanent magnet of the setup.
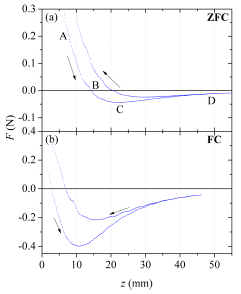
Figure 2 Force vs. distance HTS-PM for the MTG sample in the ZFC and FC regimens. In both cases, a hysteretic behavior was displayed with maximum negative values, which correspond to a maximum attractive force. The arrows show the direction of the relative displacement HTS-PM.
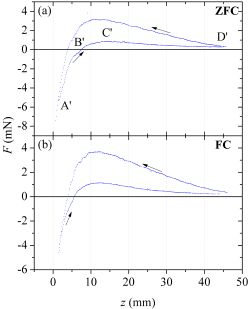
Figure 3 Force vs. distance HTS-PM for the S sample in the ZFC and FC regimens. A hysteretic behavior was observed in both cases. The maximum positive values correspond to a maximum repulsive force. The arrows show the direction ofthe relative displacement HTS-PM.
Table 1 presents the maximum values of the gap of the force ∆F for both samples in the FC regime and the distance z M at which this occurs. The hysteresis in the force is the main characteristic of the interaction HTS-PM because the gap of the force is directly related to the critical current density and the magnetization of the superconducting sample [26,34]. Therefore, the gap ∆F is an indicator of the quality of the superconductor. It is observed that the force is greater by two orders of magnitude for the MTG sample than for the S sample, which means that the quality of the MTG sample is better than the S sample.
Table 1 Experimental values of the gap of the force for both samples in the FC regime.
| Sample | Zm (mm) | μο W (T/m) | V (cm3 ) | AF (mN) |
| ± 0,1 mm | ± 0,05 T/m | ± 0,01 cm3 | ± 0,01 mN | |
| S | 12,0 | 7,44 | 0,38 | 2,22 |
| MTG | 10,0 | 8,88 | 0,28 | 240,00 |
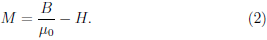
In the case when an HTS sample of volume V is moving in a magnetic field H and assuming first a homogeneous magnetization in the material and second that the induced currents are perpendicular to the applied field, the force along the z-axis is [28,35]
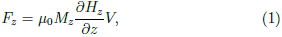
where M
z
is the constant magnetization,
 represents the field gradient along the z direction, and V the volume of the sample. The magnetic field H(z) of a permanent magnet decreases with distance z, therefore
 is always negative. Since V and μ0 are positives, then, according to equation 1, the sign of F
z
is opposite to the sign of M
z
. Furthermore, for type-II superconductors, a magnetic flux B can penetrate from its surface when a magnetic field H is applied. This produces a magnetization in the material given by
is always negative. Since V and μ0 are positives, then, according to equation 1, the sign of F
z
is opposite to the sign of M
z
. Furthermore, for type-II superconductors, a magnetic flux B can penetrate from its surface when a magnetic field H is applied. This produces a magnetization in the material given by
At point A of Fig. 2-a the hysteresis curve for the MTG sample starts with positive values of the force (M < 0); this is due to the screening of the magnetic flux in the material; in this region levitation of the sample is possible since the magnitude of the interaction force is greater than the weight of the sample (≈ 16 mN). As the distance increases the force decreases down to zero at point B. In this point, the field inside the material as well as the applied field has decreased enough to annihilate the magnetization (M = 0). At point C, the applied field decreases and the trapped field is larger, leaving the magnetization positive (M > 0); here the maximum value of the force is -43.8 mN, thus suspension is possible. At point D the force tends to zero because the field of the magnet decreases. The FC case (Fig. 2-b) can be explained in the same way as the ZFC case (Fig. 2-a). The increase of the magnitude of the force in the FC case is remarkable. In this regime, the trapped flux would be larger, which implies an increase in the magnitude of M.
In Fig. 3-a, the hysteresis curve for the S sample, starts at point A' with negative values of the force (M > 0). When the superconductor moves away the magnitude of the force decreases down to zero at point B', where the field inside the material is equal to the applied one (M = 0). At point C' the force is positive (M < 0) due to the screening of the magnetic flux. As the superconductor moves away the field of the magnet decreases causing the interaction force tends to zero, as it is observed at point D'. The levitation and suspension phenomena are not observed in this case since the interaction force is weaker than the weight of the S sample (≈ 24 mN).
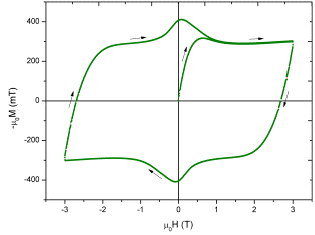
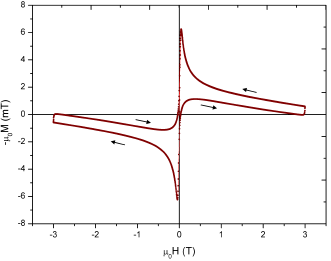
The displayed hysteretic behaviors in the F vs. z curves are related to hysteresis in the magnetization where a large hysteresis corresponds to a large flux pinning in the sample [11,28,36]. Figures 4 and 5 displayed the magnetization curves for samples MTG and S respectively. A vibrating sample magnetometer was used to measure the magnetization of the samples. As observed, a large interaction force HTS-PM agrees with a large hysteresis magnetization loop.
Conclusions
Measurements of the interaction force HTS-PM, (attraction (suspension) and repulsion (levitation) forces), were carried out with the technique developed here, which is reproducible, reliable and low cost, and it allows to determine the quality of the superconducting material for different applications. The hysteresis phenomena of the force as a function of distance, observed for both samples in the ZFC and FC regimes, are attributed to the hysteresis in the magnetization. For the MTG sample with efficient pinning centers, it is possible to observe both levitation and suspension phenomena. Levitation is a consequence of the magnetic flux exclusion (M < 0) and suspension a consequence of the trapped flux inside the material (M > 0). The interaction force was smaller by two orders of magnitude for the sintered sample with an Oxygen contain of approximately 0.55 (δ > 0,15), than the texturized sample with δ < 0,10.

