


 English (pdf)
 Article in xml format
 Article references
 Send this article by e-mail
 Cited by SciELO
  Cited by Google
  Similars in
SciELO
Similars in
SciELO  Similars in Google
 Permalink
Introduction
Measurement and logging the temperature data from the classical thermometer is a tedious process. Even though thermocouple is available, they can not be installed for automatic thermal data observation processes. In the conventional solar thermal experiments still many laboratories use thermocouples for sampling the thermal data. [1-3]. To obtain the temperature more sensibly, thermocouples are implemented in the lab level experiments. The calibrated thermocouples usually measure the temperature by obtaining the voltage difference caused by various thermal junctions. Especially for the solar thermal experimental setups, the thermocouples are widely used [4,5], but for the large level solar thermal experiments, the manual thermal data logging using thermocouples is a complex task. Hence, an automated data logging system is required. Similarly, the automated logged date is to be in the digital format. To resolve all of these requirements the Raspberry Pi based temperature monitoring system is used for solar thermal experiments.
In various laboratories, conventionally temperature is measured usually by thermometers. The output of the thermometer is observed by calibrated reading marks. For laboratory purposes, the thermometers are not suitable to obtain or handle the river of data. For any classical thermometer, large-level data acquisition and data logging over a long period is a tedious process. To resolve these issues, digital data sensing and logging system is constructed.
Configuring Raspberry Pi as a wireless sensor, that's node performance and constraints are reported by Vujovic, V., and Maksimovic, M [6]. They mention that the wireless sensor network consists of a sensor unit, processing unit, communication unit, and power unit. Raspberry Pi as a sensor web node for home automation is reported by Vujovic and Maksimovic [7]. Advantages of the Internet which can interact and communicate, maximized, safety, security, comfort, convenience, and energy savings are reported in the same work. Photo-voltaic monitoring that is essential for the implementation and optimization of solar energy as an electric source is reported by Nathan Froese [8]. The output of the PV weather monitoring system that included a low-power computer and software is stored in MS Access and MS excel. Though thermocouples are employed in any part of the experimental setup even where the thermometer cannot be implemented such as corners and the curved positions, the DS18B20 sensor wins in the race.
Construction of smart cloud robot using Raspberry Pi is reported by Shitya Prabha, et al [9]. That prototype coordinates with GPS and is controlled using an Arduino microcontroller. The system is communicated with the cloud using the Raspberry Pi. Wireless sensor network using Bluetooth low energy (BLE) is developed by Josie Hughes, et al [5]. They implemented Raspberry Pi as a gateway of the network. Solar radiation measurement using Raspberry Pi and its modelling using the artificial neural network is reported by Shanmuga Priya Selvaratnam, et al [10]. The design of a data logger and the logged data are used for validating the artificial neural network. Raspberry Pi based real-time data acquisition node for environmental data collection is reported by Kris Ramoutar, et al [11]. Temperature, humanity related data are collected using a DHT-11 sensor which is controlled by the python scripts.
To introduce general computing and computer programming for learners, Raspberry Pi provides lots of favours [12]. The temperature test system constructed by using DS18B20 is explained by Ping, L et al.[13]. DS18B20 can be implemented as an in-vehicle monitoring system using a Raspberry Pi [14]. Raspberry Pi can be used as an integrated system for measurement purposes. [15,6]. Raspberry Pi 2 single-board computer system (Model B) [17] and several temperature sensors (DS18B20) are applied to construct the proposed data measurement and logging system. Obtained results from the solar thermal experiments are analyzed in the present work.
Model
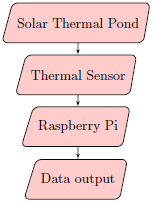
The overall aim of this work is to develop and design an automatic thermal data logging system to monitor temperatures for solar thermal experiments. The process of using a computer to collect and store data from sensors is called data logging. Such prototype instruments are called data loggers. The data logger is a microprocessor-based system that monitors and records all activities.
Peripherals
For digital logging, various computational peripherals are required. Such peripherals are arranged as a network. The Raspberry Pi is an open-source single-board computer system. It has plenty of onboard peripherals such as an A/V interface, memory, and the USB controller. They are controlled by an onboard chip Broadcomm SoC. A Raspberry Pi device has a program memory (RAM), general-purpose GPIO (40) pins, 4 USB ports, an Ethernet port, and an SD card slot.
The main part of this instrumental setup is, to choose a temperature sensor and make it interface with the Raspberry Pi machine. A temperature sensor (DS18B20) is chosen for this purpose. Designed by DALLAS, DS18B20 is a digital thermal probe or sensor. It is employed to sense the temperature. It has a unique 1-wire interface, that makes this device to be communicated easily with other devices.
It can measure temperatures from - 55°C to +125°C (-67° F to +257° F) with an accuracy of ±0.5°C from - 10°C to +85°C. It obtains power from the data line itself. This feature reduces the equirement of extra power supply [9,13,16]. As DS18B20 sensors have a unique serial number for each device, multiple sensors can be introduced on the same 1-Wire bus. Hence many temperature sensors can be installed in many different places. To interface the temperature sensor with the RPI machine, and in manipulating the data obtained from the machine Python programming language plays a key role. Python(Version 2.7) programming language is implemented for the system [18]. Python is a powerful and simple language that is applied to various software requirements and lots of applications. At the core, the source code is translated into the target code by the interpreter. Python is a portable, free, independent, and complete language.
Experimental setup
The experimental setup is designed to measure and compare the varying temperature data due to various solar thermal experimental conditions. The integrated setup consists of Raspberry Pi, temperature sensor (DS18B20), python script, and interfacing Linux machine. The requirement of interfacing components such as keyboard and mouse are avoided by a remote client system that considers Raspberry Pi as a server. The interfacing input and output operations are handled by remote VNC mode. The Raspberry Pi system is powered up with a standard USB charging adapter with 5V output. To find out the reliability of temperature sensors and logging setup, the system is tested under laboratory conditions.
Initially, an Electromagnetic heater is introduced to test the longevity of the setup under various temperatures. . Initially, one DS18B20 sensor is drenched in a beaker of distilled water. As the heater is switched on the temperature of the liquid rises. Raising data is sensed every 10 seconds and logged into a separate digital log file within the Raspberry Pi system. The result is compared with the temperature variations of the standard thermometer. Similarly, many numbers of DS18B20 sensors are added to the setup. Their corresponding temperature data is compared with the standard thermometer. In addition to the standard thermometer, variation of temperature is also verified with a thermocouple. The thermocouple measures the temperature using the below formula.
Temperature = (obtained emf / 0.04) + Ambient temperature.
From the obtained temperature, the data from the DS18B20 sensors are compared. Logged data are analyzed and plotted using an open-source plotting tool based on Linux. The obtained results prove the consistency of the thermal sensors and the sensor network.
Python Program
Python program for automatically measuring and logging the temperature data of solar thermal pond using Raspberry Pi is sketched below.
import os, glob, time, datetime
log_period = 600 # seconds
logging_folder = glob.glob('/media/*')[0]
dt = datetime.datetime.now()
file_name = Mtemp_log_{:%Y_%m_%d}.csv".format(dt)
logging_file = logging_folder + '/' + file_name
os.system('modprobe wl-gpio')
os.system('modprobe wl-therm')
base_dir = '/sys/bus/wl/devices/'
device_folder = glob.glob(base_dir + '28*')[0]
device_file = device_folder + '/w1_slave'
def read_temp_raw(): f = open(device_file, 'r')
lines = f.readlines()
f.close()
return lines
def read_temp():
lines = read_temp_raw()
while lines[0].strip()[-3:] != 'YES':
time.sleep(0.2)
lines = read_temp_raw()
equals_pos = lines[1].find('t=')
if equals_pos != -1:
temp_string = lines[1][equals_pos+2:]
temp_c = float(temp_string) / 1000.0
temp_f = temp_c * 9.0 / 5.0 + 32.0
return temp_c, temp_f
def log_temp():
temp_c, temp_f = read_temp()
dt = datetime.datetime.now()
f = open(logging_file, 'a')
f.write('\nM{:7„H:7„M:7„S>M,'.format(dt))
f.write(str(temp_c))
f.close()
print ("Logging to: " + logging_file)
while True:
log_temp()
time.sleep(log_period)
To begin with, importing of os, glob, time, DateTime modules are done. The glob module finds all the pathnames matching a specified pattern according to the rules provided by the Unix shell. glob:glob(pathname) returns an empty list of pathnames that match path names, which must be a string containing path specification. DateTime:now() is the Date-Time module, that supplies classes for manipulating dates and times in both simple and complex ways.
While the date and time arithmetic is supported, an additional concern is required on efficient attribute extraction of output formatting and manipulating. From the line filename = "templog: %Y %m % d:csv":format(dt) the RPI gets the output data as a comma-separated value (CSV) format. The lines " os.system ("modprobe wl-gpio"), os.system "modproe wl-therm") " undertake an inward communicating process of the sensor hardware. The programming line base?dir = "=sys=bus=wl=devices=" deals with the inspection of failed messages if any, and it reports the temperature in degree Celcius and Fahrenheit units every second. The code line devicefolder = glob:glob(base dir + "28 ?")[0] defines base (root) directory to location 28. There exist an if class. If the class gets a positive answer then it returns the temperature in either Degree Celcius or Fahrenheit.
In the program defreadtempraw(); calls the temporary error lines. It is opened by the "f" variable, to return those lines. Another defined parameter in terms of defreadtemp(); is defined. As an integrated result, the temperature in Celsius and Fahrenheit are distinguishingly obtained from the sensor.
Results and Discussion
To obtain the standard results from the sensor, the calibration and comparison of sensors with the standard thermometer and thermocouple are estimated. The comparison of data is plotted and verified.
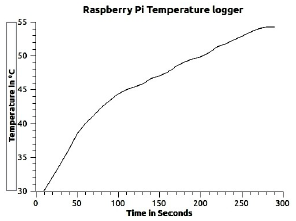
To calibrate the temperature sensor (DS18B20), it is compared with a standard thermometer (Figure 1). Initially, the raising of the temperature is manually observed for an analog thermometer. The data is digitally logged for the temperature sensor. Their differences are compared.
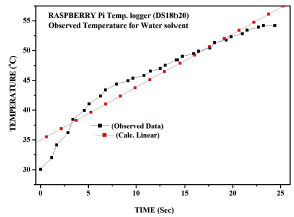
Observed data from the previous experimental condition is compared with the expected theoretical values (Figure 2). The curve fitting techniques are applied and the plot shows that the sensor provides a standard output with minimal error.
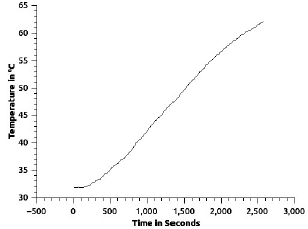
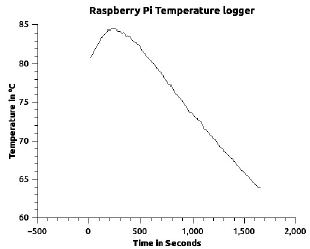
In this experimental setup, the heater is controlled to provide small temperature variations. The DS18B20 observed the changes in temperature for 3000 seconds. The curve increases gradually from 32°C. The increment is shown in the plot (Figure 3).
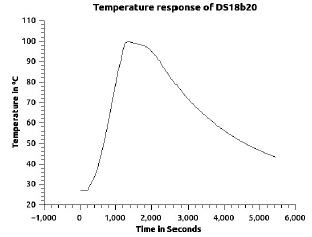
In this experimental setup, the hot liquid is set to cool in the lab environment. The initial rise in the curve shows that the latent heat of the liquid. As the liquid loses temperature to its surroundings the curve shows the decrement data (Figure 4). The decrement shows the longevity of temperature sensor DS18B20.
In this experimental setup, increment and decrement data of temperature sensor DS18B20 is reported (Figure 5). The temperature is set to increase until the liquid is boiled, then the heater is switched off. Rapid increment and exponential decrement are absorbed from the plot.
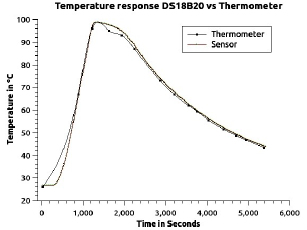
The increment and decrement temperature data are observed and compared for temperature sensor DS18B20 and analog thermometer (Figure 6). The sensor returns the temperature data with more accuracy and with minimal error. Initially, the sensor data merges with the thermometer data at the mid ranges. But in later times it seems to be merged with thermometer data. That is observed from the decrement mode of the plot. This result shows the consistency of the DS18B20 sensor.
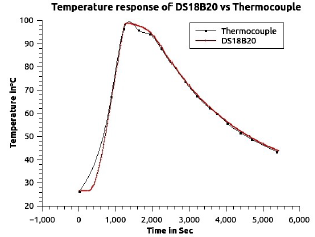
The increment and decrement temperature data are observed and compared for temperature sensor DS18B20 and thermocouple (Figure 7). This comparative data also provides the same kind of information as the thermometer. The consistency of the sensor is proven strongly with these results.
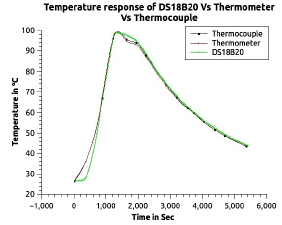
The temperature data are observed and compared for the temperature sensor DS18B20, thermocouple, and analog thermometer (Figure 8). The graph shows the merger of sensor data with thermocouple and thermometer data. The consistency of the sensor is explained. So this sensor is a good replacement for orthodox thermometers and thermocouples. From the above results, it is noted that the temperature sensor DS18B20 provides consistency over standard thermometer and thermocouple. Thus, the entire setup such as Raspberry Pi, DS18B20 sensors can be designed as an integrated system for solar thermal experiments as automatic temperature measurement and logging device. As the Raspberry Pi can be programmed with a cron job, it reduces the risk of losing the data and avoids the necessity of manual work.
As in research-level, this system can be used as a data logging and measurement device. By implementing this integrated setup, any laboratory can be equipped with an automated temperature logging system. Recently, the same setup has been adopted by a few laboratories for the temperature logging system and such results will be communicated.
Conclusion
For solar thermal experiments, the problem of continuous monitoring and logging of thermal data is solved by an automated Raspberry Pi based automatic temperature logging system. Such a system replaces the thermometers and thermocouples with sensors and the system logs the data without any human interaction. Hence, such replacement acts as an updated temperature logging system, which can be implemented as a sensor network among the solar thermal ponds to observed and log the thermal data. As the logged data is in digital format, it can proceed through any data handling applications.
The conventional thermometers or thermocouples are lagging with digital data logging over a large period. So, the Raspberry Pi-powered temperature sensor network is an opt choice for observing and logging temperature data for the solar thermal applications. From the graphs, the efficiency and consistency of the thermal sensor network are compared with a standard thermometer. The system has consistency over large data ranges too.
From the above results, it is observed that the environment plays a vital role in the linearity of output data. These effects can be minimized by having an isolated system. This proposed system can be expanded into cloud-based databases, which is an important aspect of IoT (Internet of things). The entire system can be installed in many laboratories as a low-cost temperature measurement and logging system.

