


 English (pdf)
 Article in xml format
 Article references
 Send this article by e-mail
 Cited by SciELO
  Cited by Google
  Similars in
SciELO
Similars in
SciELO  Similars in Google
 Permalink
Introduction
The obesity is considered a relevant cardiovascular risk factor, specially the central obesity. It's measured by waist (WC) and abdominal (AC) circumferences, since these are indicators of visceral fat 1,2, for general population, and particularly in the elderly population 3.
Aging is closely associated with artery stiffening, compliance and elasticity decline, culminating in increased blood pressure 4,5. Aditionally, there are also changes in the modulation of the ans on cardiovascular system, characterized by an age-related sympathetic hyperactivity and vagal withdrawal 6.
Anthropometric measures are useful tools to evaluate central obesity, especially in elders, since the aging process is associated to a body fat increase, characterized by an irregular distribution, with greater depot in abdominal site (i.e. increased visceral adiposity or central obesity) 7-9.
There are many proposed anthropometric parameters to evaluate the central obesity. Body landmarks, as the umbilical scar, are generally used to obtain these measures 10-12. The use of umbilical scar as body landmark to obtain circumference measures is motivated by the difficulty to establish the minor circumference in the waist (i.e., at the midpoint between the last rib and the iliac crest) in elders, owing to the explained changes in body composition, with greater increase of central adiposity. In these circumstances, the use of umbilical scar as body landmark may represent a good alternative for studies conducted with elders, and especially with a longitudinal study design, since changes in the anthropometrical evaluators could occur, so that the use of a subjective parameter such as the midpoint with minor circumference in the waist may reduce the measurements reliability.
Despite the explained above, circumference measures are commonly obtained at the umbilical scar, as well as 2 cm above the umbilical scar, and the terms abdominal and/or waist circumference have been used to designate these measures. Curiously, both terms have been used interchangeably, and with measures obtained at the two described sites. Notwithstanding, it is not known if the association between hypertension and circumference measures obtained from these two measure sites could diverge.
The advances in the number of researches in the area of human aging, correlating the anthropometric indicators of central obesity (e.g., WC and AC) as predictors for cardiovascular diseases (CVD) and hypertension, are associated with the use of different protocols to obtain these measures, but divergences regarding the cutoff points used for each measure site may directly influence the conclusion. From the perspective of epidemiology, it is necessary to standardize the terms of the anatomical sites to reach cutoff points, allowing a better data comparison among studies 8.
Then, this study is aimed to investigate the association between hypertension and anthropometric indicators of central obesity, obtained from two anatomical sites, in community-dwelling elders. Additionally, the predictive potential to hypertension of each circumference measure, with its respective sensibility, specificity and cutoff points were obtained and compared.
Methods
Sample
All older adults [263] (≥ 60 years) from Aiquara, Bahia, Brazil, were invited (door to door) to take part in this survey, in a convenience sample. Aiquara is located in the central south region of Bahia, with 4602 inhabitants, a Gini index of 0.5376 and a HDI value of 0.583 13.
However, bedridden individuals and/or those with severe neurological or cognitive impairment (n = 22) were excluded, and nine participants did not consent to participate. In addition, 87 had technical problems during data collection (i.e., incompleteness of information and absence of the clinical evaluation stage), limiting the hypertension classification, and/or anthropometrical measures, and/or the classification of diabetes. Thus, this study population comprised 145 elders.
Written informed consent was obtained from all participants, and all procedures were approved by the local ethics committee according to the Helsinki Declaration.
Data collection
Data collection was performed from February to April 2013. From the questionnaires, data recordings from sociodemographic characteristics including sex, age, self-reported health status (previous diagnosis of diabetes mellitus [DM] and hypertension), and medications currently in use, were used in this study. The presence of hypertension and DM were defined based on self-reported disease, with the question "has any medical professional already given diagnosis of arterial hypertension and/or diabetes?". Additionally, the use of antihypertensive and antidiabetic medications was used as confirmation criterion.
The anthropometric indicators of central obesity, WC and AC were considered as independent variables (i.e., predictor variables). Circumferences were measured twice and the average was used as the recorded value to the nearest 0.1 cm, in all participants standing with their weight equally distributed on both feet, and arms at their sides, with a tape which surrounded the bare skin, parallel to the floor at the end of normal expiration by trained health professionals.
Despite the great diversity of nomenclature and anatomical sites of measurement, in the present study the term WC was attributed to the measure of central obesity obtained 2 cm above the umbilical scar, while the AC was obtained at the umbilical scar. The choice of the described anatomical sites was based on studies by Rosato et al.10 and Nunes et al.11, who studied people aged over 50 and Henriques et al. 12, who studied a sample with a mean age of 84 years.
Statistical analysis
Categorical variables were presented as absolute and relative frequencies, while continuous variables were presented as mean and standard deviations. The comparison of WC and ac between hypertensive and normotensive elders was performed using the Student t test, while the association between the independent variables (i.e., WC and AC) and the dependent variable (i.e., hypertension) was tested using the logistic regression technique. The Odds Ratio (OR) was calculated with their respective 95 % confidence intervals (95 % CI). The predictive predisposition to hypertension from the WC and AC, for men and women, as well as the best cutoff for the studied outcome, were obtained from the ROC curve parameters. Comparisons between ROC curves were performed using the method proposed by Hanley and McNeil 14, to verify if there is a significant difference in the discriminatory power of any of the studied anthropometric indicators.
The significance level was set as p ≤ 0.05, for all analyses. Statistical procedures were carried out in SPSS version 21.0 (SPSS, Inc, Chicago, IL) and MedCalc v. 9.0.
Results
From 145 elders that comprised this study, 79 were women (54 %) and 66 were men (46 %). The prevalence of hypertension among women was 73.4 %, while among men it was 69.7 %.
Table 1 shows the anthropometric variables WC and AC of the studied population.
Table 1 Comparison of waist (WC) and abdominal (AC) circumferences between hypertensive and normotensive elders
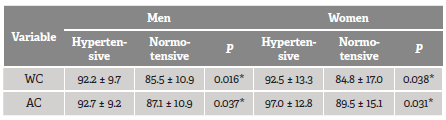
* Significative difference (p < 0.05).
Source: research data.
Results from the logistic regression are presented in Table 2, and indicated that higher values of WC (men, OR = 1.07 [1.01 - 1.13]; women, OR = 1.04 [1.00 - 1.08]) and AC (men, OR = 1.06 [1.00 - 1.12]; women, OR = 1.04 [1.01 - 1.09]), are associated with hypertension in the elders of both sex.
Table 2 Adjusted odds ratio (OR), 95 % confidence interval of the OR and the p-value from hypertension prediction model, with WC and AC included as predictive variables
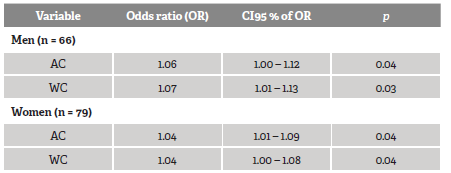
Source: research data.
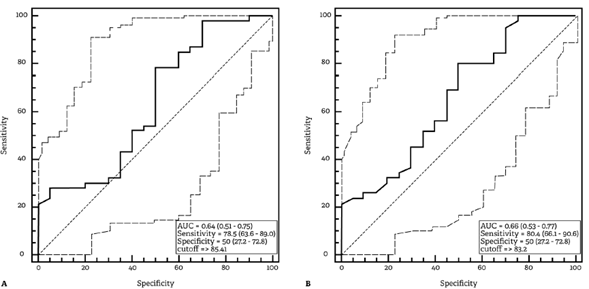
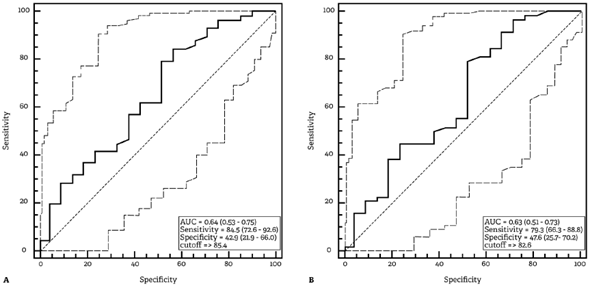
The ROC curve analysis showed that both antropometric measures related to central obesity had a good discriminatory predisposition to hypertension in the studied population. For older men, the WC presented an AUC of 0.66 (95 % CI = 0.53 - 0.77) and high sensitivity (80.4, 95 % CI = 66.1 - 90.6), while the AC exhibited an AUC of 0.64 (95 % CI = 0.51 - 0.75) and high sensitivity (78.3; 95 % CI = 63.6 - 89.0). For women, WC presented an AUC of 0.63 (95 % CI = 0.51 - 0.74) and high sensitivity (79.3; 95 % CI = 66.6 - 88.8), while the AC exhibited an AUC of 0.64 (95 % CI = 0.53 - 0.75) and high sensitivity (84.5; 95 % CI = 72.6 - 92.6). The roc curves with their respective parameters are shown in Figures 1 and 2.
Source: research data.
Figure 1 ROC curve for the predictive capacity of hypertension in men with abdominal circumference (A) and waist circumference (B) as predictors. Area under the curve (AUC), sensitivity, specificity and cutoff point are presented (p = 0.05 for AC, and p = 0.03 for WC)
Source: research data.
Figure 2 ROC curve for the predictive predisposition to hypertension in women with abdominal circumference (A) and waist circumference (B) as predictors. Area under the curve (AUC), sensitivity, specificity and cutoff point are presented (p = 0.03 for AC, and p = 0.03 for WC)
The AUC comparisons from the ROC curves obtained with AC and WC as predictors did not show significant difference in both sexes (men: p = 0.240; women: p = 0.367). Figure 3 shows the AUC comparisons.

Discussion
The present study aimed to investigate the association between hypertension and two anthropometric indicators of central obesity (abdominal and waist circumferences) in old adults. Our results showed that both anthropometric indicators of central obesity are significantly associated to hypertension in both sexes of studied population. Additionally, there was no significant difference in the predictive power for hypertension with AC or WC as predictors.
Nazare et al.15 investigated the association between anthropometric parameters (Body Mass Index and Waist Circumference) and cardiovascular risk factors in 4504 patients (2174 men and 1935 women) from 29 countries and concluded that WC was correlated with most cardiovascular risk factors. Previous studies had evaluated the relationship between obesity indicators (general and central) and hypertension in the elders 15,16, but, to the author's knowledge, there are no studies comparing the predictive power of hypertension with obesity indicators obtained in different anatomical sites in the elderly population.
The study by Moraes, Checchio and Freitas 18) verified the association between hypertension and anthropometric indicators in adults and found that the central obesity indicator was significantly associated to the hypertension. In the cited study they found that for both sexes, the prevalence of hypertension increased according to the exposure levels of the anthropometric variables and, in those with altered waist circumference, the prevalence of hypertension corresponded to almost double (male sex) or more than double (female sex).
Munaretti et al.19 studying elders from both sexes, identified that BMI and WC were significantly associated to hypertension, with BMI presenting the highest statistical association for men, but no superiority when analyzed for women. It is important to point out that the cited study did not perform direct comparisons between the predictive predisposition to hypertension and the different anthropometric indicators of obesity, being the analysis based only on the obtained odds ratio.
As previously explained, studies conducted with populations of different age groups have supported the hypothesis of a close association between central obesity and the development of CVD, especially the hypertension 17,19,20. The mechanisms involved are complex and still poorly understood, generating hypotheses such as the capacity of the visceral adipose tissue to secrete Renin-Angiotensin-Aldosterone System (RAAS) elements, and adipokines able to regulate blood pressure 11,21,22.
In the evaluation process, this association could be influenced by the choice of anthropometric parameter related to central obesity, since anthropometric measures obtained at different anatomical sites can lead to different prevalences in the obesity diagnosis and, consequently, to different levels of association with CVD.
Alves et al.24 evaluated the AC measurements obtained at the umbilicus scar and WC at the minor circumference in the waist (i.e., at the midpoint between the last rib and the iliac crest) in young adults (36 ± 11 years) of both sexes, identifying a significant association among WC, systolic blood pressure (SBP) and diastolic blood presure (DBP) in both sexes, whereas AC was significantly associated to SBP and DBP in women but only to SBP in men. In the cited study, direct comparisons of the correlation coefficients were made through the Steiger Z test only when both anthropometric measures (i.e., AC and WC) were significantly associated to studied cardiometabolic parameters (SBP, DBP, glycemia, triglyceridemia, total cholesterol and fractions), and the results did not show significant differences between the correlation coefficients, which does not allow to indicate superiority of one anthropometric parameter for the BP measurement in the study population 24.
The comparison of the predictive predisposition to hypertension from the WC and ac variables as predictors was not the objective of the aforementioned study 24; however, its results, obtained from young adults, raise a hypothesis regarding the existence of differences in the predictive capacity for hypertension by anthropometric indicators of central obesity, obtained at different anatomical sites. Our results allow to answer these hypotheses, since the AUC comparisons from the ROC curves indicated that both central obesity parameters (i.e., WC and AC) were significantly associated to hypertension in the elders, and there was no significant difference between predictive predisposition to hypertension in both sexes of studied population.
It is worth mentioning that, unlike the study by Alves et al.24, in our study, the WC measurements were obtained 2 cm above the umbilical scar, which is justified by the need to guarantee a good reproducibility of the measurements. The use of subjective parameter (e.g., the minor circumference at the midpoint between the last rib and the iliac crest) could lead to a high interindividual and intraindividual variability, whereas a standardized anatomical reference (e.g., umbilical scar) could minimize this possible methodological bias, which is essential for longitudinal studies.
Based on the used anatomical sites, the specific cutoff points were > 83.2 and > 82.6 for WC of men and women, respectively, and > 85.1 and > 85.4 for AC of men and women, respectively. The Brazilian Guidelines for Obesity 25, considering the diagnosis of Metabolic Syndrome, recommend the cutoff points: ≥ 90 cm for men and > 80 cm for women, independently of age.
Woo et al.26 evaluated the predictive capacity of WC for hypertensive elders of both sexes from China. The measurement was obtained at the minor circumference at the midpoint between the xiphoid process and the umbilical scar, and the results showed a significant association of this measure and hypertension in elders from both sexes, with an odds ratio (OR) of 1.02 (95 % CI 1.01 -1.04) for men and 1.02 (95 % CI 1.00 - 1.03) for women, which were lower than those obtained in our study. Analysis of the roc curve from Woo et al.26 showed only a moderate predictive power, considering the AUC from the analysis for men (0.57 [95 % CI 0.52 - 0.62]) and women (0.56 [ci 95 % 0.51 - 0.60]), which were also lower than the ones obtained in our study. In addition, the cutoff values were 81 and 82 cm for men and women, respectively, which represent values close to those obtained here.
Comparisons of the predictive predisposition to hypertension, using only two anatomical sites related to the central obesity could be pointed as a limitation of our study. Future studies should be carried out in order to compare the predictive capacity of other anatomical sites of central obesity and their respective cutoff points for hypertension in community-dwelling elders of both sexes. Additionally, regarding cross-sectional design, it is impossible to establish a cause and effect relationship between the variables studied and evaluated in a single moment in time.
The determination of specific cutoff points for central obesity is limited by the absence of an international normative protocol regarding the anatomical sites to take measures. Other limiting factor for the use of a global cutoff point is the age group included in the studies designed to raise this cutoff points. In fact, cutoff points obtained from young adults are widely applied to investigate central obesity in elders. Therefore, it is suggested that the cutoff points obtained here be tested for their predictive predisposition to hypertension in longitudinal studies involving the elders, in order to evaluate their applicability for the purposes of hypertension screening, making possible the generalization of results and the external validity of this study.
The anthropometric indicators of central obesity are accurate at estimating visceral obesity, which is one of the modifiable risk factors for hypertension, being easy to use and having low cost. Such characteristics are of great value, enabling health professionals to intervene early and more effectively in the prevention and/or treatment of obesity and consequent hypertension.
Conclusion
Our results allowed to conclude that both AC (measured at the umbilical scar level) and WC (measured at 2 cm above the umbilical scar) have a significant association to hypertension in the community-dwelling elders of both sexes. It was also concluded that there was no superiority of one method of measure to predict hypertension in the studied sample. In addition, cutoff points for WC were > 83.2 cm for men and > 82.6 cm for women, and AC > 85.1 cm for men, and > 85.4 cm for women.


