


 English (pdf)
 Article in xml format
 Article references
 Send this article by e-mail
 Cited by SciELO
  Cited by Google
  Similars in
SciELO
Similars in
SciELO  Similars in Google
 Permalink
INTRODUCTION
With the establishment of the North American Free Trade Agreement (NAFTA) in 1994 the demand for Mexican exports to the United States, and in particular manufacturing exports, increased exponentially. As a result, the share of Mexican imports as a percentage of overall US imports increased significantly (Figure 1). However, even with the rapid growth experienced in the manufacturing sector of the Mexican economy, some authors have pointed out that the competitiveness model of the sector, based on low wages and the concentration of exports in certain low technology manufactures, acted as a limiting factor on sustained expansion (Moreno-Brid, Santamaría & Rivas, 2006).
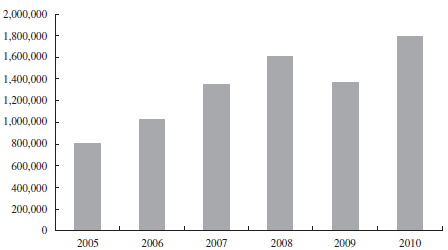
Source: Elaborated by the author using data from the World Bank.
Figure 1 Total Chinese Exports (Millions of Dollars)
Boosted by NAFTA, the economic integration between Mexico and the USA increased the variety of Mexican manufacturing exports to the USA. Geographical proximity, together with increasing foreign direct investment in manufacturing activities in Mexico improved the comparative advantages of the country's manufactures. However, during the last ten years growth in the manufacturing sector has slowed down in comparison with the rapid growth experienced in the 1990s. This loss of momentum was particularly marked in the export manufacturing sub-sectors, whose initial rapid expansion had been encouraged by the establishment of NAFTA, but which was subsequently impacted negatively by the economic recessions in the USA.
The behavior of the manufacturing export sector in Mexico is directly related to US imports, because the US is Mexico's primary trading partner. Therefore, Chinese manufacturing exports and the competition they provide within the US market have become a decisive factor if the changes in the rhythm of growth of the Mexican manufacturing sector are to be understood. Since the 1990s, trade between China and the USA has experienced a marked though uneven expansion, characterized by the exponential growth of US imports from China while US exports have grown at a much slower pace. The increasing exports from China sharpened competition within the US domestic market and affected the structure of wages in that country (Autor, Dorn & Hanson, 2013). The 2001 economic recession marked a watershed, after which the Mexican manufacturing sector started to slow down while Chinese manufacturing exports began to expand in volume and diversity (Feenstra & Kee, 2008; Guzmán & Toledo, 2005).
In particular, there has been a growth in highly specialized exports of machinery and electronics manufactures (Amiti & Freund, 2010). In the 2000s China replaced Mexico as the principal exporter of high technology manufactures to the USA (Correa & Gómez, 2009). It is worth mentioning that the composition of Chinese manufactures is similar to those of developing economies such as Mexico and that, therefore, they are in direct competition with their Mexican equivalents (Hanson & Robertson, 2008). The emergence of China as a predominant player in international trade has determined that countries such as Mexico, which are specialized in intra-industry trade, have been losing ground in the face of China's trade expansion (Jenkins, Dussels & Mesquita, 2008).
On the other hand, Chiquiar, Ramos-Francia and Fragoso (2007) point out that the increasing penetration of the US market by Chinese manufacturing responds to the loss of comparative advantages by Mexican manufactures. It therefore appears that the expansion of Chinese exports has had a negative impact on US demand for Mexican manufacturing exports. In particular, Chinese exports have surpassed Mexican exports in goods such as computers, telecommunications equipment, finished metal products, glassware, and control instruments. Mexico has the advantage in agricultural products, auto parts, automobile engines and televisions (Mendoza, 2010). In this connection it is important to point out that Mexico's proximity to the US, its lower wages and the exchange rate have enabled its automobile and auto parts exports to continue to enjoy a large share of the US market.
However, Chinese exports continue to show greater competitiveness than those of Mexico, as a result of its undervalued exchange rate and the fact that wages are lower than those paid in Mexico (although this latter advantage appears to be shrinking). According to Wood and Mayer (2011), China's expansionary trade has negatively affected the exports of labor-intensive manufactures and encouraged primary exports from developing countries. Additionally, the increasing accumulation of capital and technology in China means that its economy will probably continue to move towards producing more sophisticated manufacturing exports. Accordingly, this paper has the objective of estimating the impact of US demand for Mexican manufactures on labor demand in the manufacturing sector of the Mexican economy. It also considers the effect of the penetration of the of the US market by Chinese manufactures and Chinese commercial and wage policies.
The paper is divided into seven sections. The first comprised the introduction; section two explains the expansion of Chinese exports and their penetration of the US economy; section three analyzes competitiveness, wages and exchange rates for Mexico and China; section four describes the recent evolution of the Mexican manufacturing sector; section five presents the methodology used to estimate the impact of Chinese exports on Mexican labor demand in the manufacturing sector; section six presents the results of these estimations; the final section discusses the conclusions.
THE EXPANSION OF CHINESE EXPORTS AND THEIR IMPACT ON MEXICO'S EXPORTS TO THE USA
Total Chinese exports to the world increased at a rapid rate of 13.9% between 2005 and 2010 (Figure 1). This vertiginous expansion had a direct effect on the foreign trade of the Latin American economies; in fact, in some cases China became their most important trading partner (Hernandez, 2011). In the case of Mexico, trade with China has imposed obstacles for the future growth of the country's manufacturing sector. Indeed, the negative effect of the rapid penetration of Chinese manufacturing exports on the growth perspective of Mexican manufacturing exports to the USA should be emphasized. Between 1990 and 2006 the average rate of growth of Chinese exports to the USA, in dollars, reached 14.4%, while the corresponding figure for Mexican exports was only 9.6%. In fact, Chinese exports to the USA have surpassed those of Mexico since early 2003 (Figure 2).
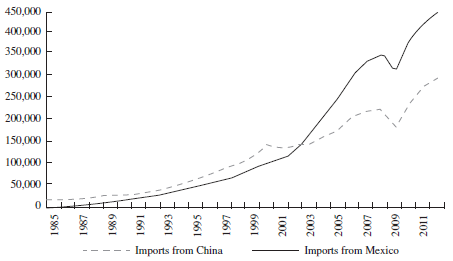
Source: Elaborated by the author using data from the US Census Bureau, US International Trade in Goods and Services.
Figure 2 Total US Imports form China and México (Millions of Dollars)
In 2000 Chinese exports to the USA represented 8.2% of total US imports; by 2012 that share had increased to 18.7%. On the other hand, Mexican exports, which represented 11.2% in 2000, only increased their share to 12.2% in 2012 (Figure 3). The kinds of Chinese exports that have gained an advantage over their Mexican competitors should also be highlighted. This may be illustrated by examining the share of the exports of both economies in total imports to the USA. The Chinese exports that have gained ground with respect to Mexican products are manufactured goods such as generators, transformers, electrical equipment, computers, telecommunications and metallic goods (Table 1). In particular, Mexican electrical equipment and computer manufacturing exports have been severely affected by the expansion of Chinese exports to the USA (Dussel, 2010).
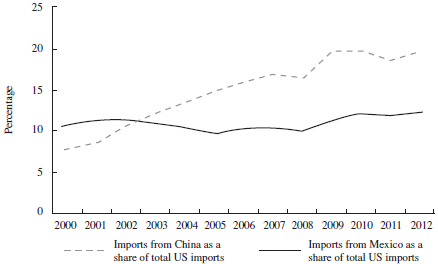
Source: Elaborated by the author using data from US Census Bureau, US International Trade in Goods and Services.
Figure 3 Chinese and Mexican Imports As a Share of Total US Imports
Table 1 Mexican and Chinese Principal Exports As a Percentage of Total US Imports (Thousands of Dollars)
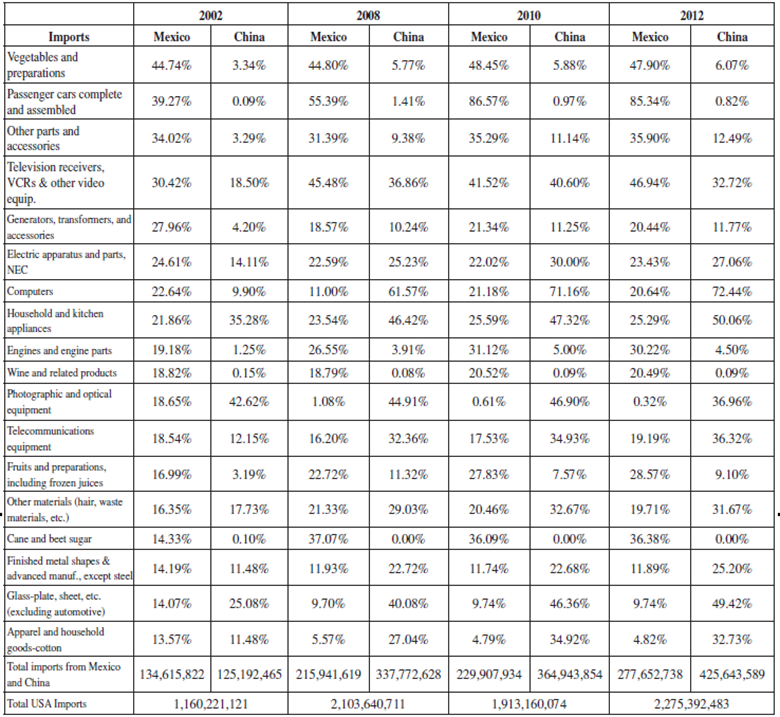
Source: Elaborated by the author using data from US Department of Commerce, Bureau of the Census, Foreign Trade.
On the other hand, Mexican exports that have either maintained or increased their share include passenger vehicles, televisions, and fruit and vegetables. It may therefore be concluded that Mexican exports have ceased to compete with exports from China in certain important manufacturing sectors, although they have maintained an important share in manufacturing activities related to the automobile industry and the agricultural sector, where localization advantages remain that reduce transportation costs. Therefore, it may be concluded that competition from China has come to affect an important part of Mexico's non-oil exports, such as primary goods and light manufactures and that, potentially, it could threaten manufacturing with higher technological content (Gallagher, Moreno-Brid & Porzecanski, 2008).
COMPETITIVENESS, WAGES AND EXCHANGE RATES IN MEXICO AND CHINA
The increasing penetration of the US market by Chinese exports has been facilitated by the fact that the Chinese economy is relatively more competitive than the Mexican. The industrial strategy followed by China has consisted of a controlled commercial policy in favor of protecting high-tech and (in Chinese terms) high wage and value-added industries while gradually phasing-out declining low wage industry (Cheng & Feng, 2000). It is important to underline, however, that the expansion of Chinese manufactures is the result not only of a favorable exchange rate, but also of factors such as globally low wages, available inputs, better communications infrastructure, and foreign direct investment, among others.
However, beyond centralized policies oriented towards encouraging the industrial development of the Chinese economy by generating advantages in infrastructure, there are important monetary factors that have impacted the comparatively low-cost advantages of Chinese exports when compared with Mexican exports. In particular, these include labor policies that favor keeping wages low and an exchange rate policy based on maintaining an undervalued exchange rate for the yuan with respect to the dollar.
The labor costs of Chinese manufactures are below wages paid in American industry. In fact, Chinese wages are located near the levels of some developing economies and below those paid in the Mexican economy. Figure 1 illustrates the manufacturing wages paid both in Mexico and China as compared to wages in the USA.
Both the Chinese and the Mexican economies have the possibility of competing in the US manufactured goods market. However, the low manufacturing wages paid in the Chinese economy have been a factor of competitiveness with the Mexican economy, particularly during the period 2004-2012. Nevertheless, it is important to point out that since 2008, Chinese manufacturing wages have increased continuously, thereby reducing that particular cost advantage. According to our estimations, the average Chinese manufacturing wage has reached $4.50 dollars per hour and is therefore converging with that of Mexico at $5.27, while in the USA average wages are currently $27.65 an hour (Figure 4 - all figures September 2012).
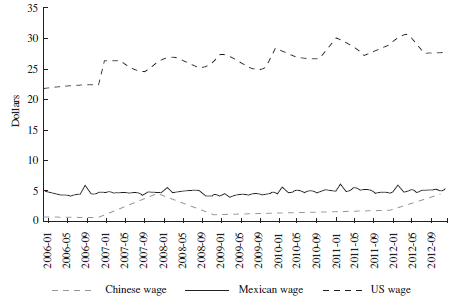
Source: Elaborated by the author using data from the Mexican National Institute of Statistics, Geography and Informatics (INEGI)'s Economic Information Bank (BIE), National Bureau of Statistics of China and the Bureau of Labor Statistics (BLS).
Figure 4 Comparison of Average Manufacturing Wages in Mexico, China and the USA
Another goal of the exchange rate policy implemented by the Chinese government is associated with the objective of ensuring the yuan is undervalued with respect to the dollar, thus increasing the competitiveness of Chinese manufactures in the US market. Given the elevated trade and current account deficits, it has been argued that the yuan should appreciate against the currencies of the economies that are the China's principal trading partners (Makin, 2008). However, the policy of the Chinese government has been to invest its accumulated foreign assets in the form of international reserves in order to avoid the loss of competitiveness that would be brought about by currency appreciation.
As a result, Chinese manufacturing exports to the USA have continued to increase, given the higher rates of profitability available and the demand for Chinese tradable goods. This increase has also determined a shift of the factors of production towards China's manufacturing export sector (Hua, 2007). According to some authors, the manipulation of the exchange rate has had a determinant effect on the competitiveness of Chinese exports (Thorbecke & Hanjiang, 2009). These authors have also pointed out that an appreciation of the yuan: dollar exchange rate would lead to a decrease in Chinese exports relative to the economies that compete with it in the labor-intensive manufacturing exports market.
In this sense, Mexican manufacturing exports to the USA have also been affected by the depreciation of the yuan, which has made Chinese exports cheaper in dollars than their Mexican equivalents. For the period 2004-2012 the average exchange rate between the peso and the dollar was 11.57 pesos to one, while the equivalent for the yuan was ¥7.14 to one. The peso, then, depreciated more against the dollar than did the yuan. However, when China's greater international foreign exchange reserves are taken into account it is possible to deduce that in potential the yuan is in fact undervalued. It is important, also, to mention that this undervaluation has been slowly reduced; by the end of 2012 the yuan: dollar exchange rate reached ¥5.87 to the dollar, a factor that has subsequently served to diminish the competitiveness of Chinese exports in the US market (Figure 5).
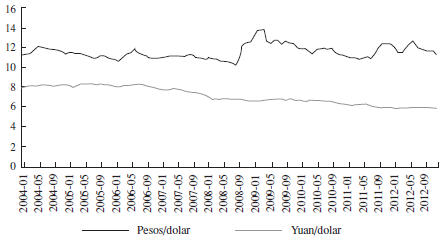
Source: Elaborated by the author using data from the Bank of Mexico (BANXICO) and Economagic (Times Series Page).
Figure 5 Evolution of the Exchange Rate of the Mexican Peso and Yuan with Respect to the Dollar, 2004-2012
It is true, then, that Chinese manufactures have relied on important monetary and labor policies that have reduced overall and labor costs as compared to Mexican manufactures. However, those advantages have diminished since 2012, particularly in terms of labor costs, thus providing an opportunity for Mexican manufacturing exports to increase their competitiveness in the US market.
THE PERFORMANCE OF THE MEXICAN MANUFACTURING SECTOR
Mexican manufacturing industry was severely impacted by the US economic recession of 2001. The dynamic expansion of employment among the Mexican labor force that occurred during the 1990s was abruptly reduced in the recovery period that took place during the second half of the first decade of the 21st Century. The weak reanimation of manufacturing performance during that period was again aggravated by the resurgence of the US economic crisis in 2008 and 2009.
Consequently, the recent behavior of Mexican manufactures showed a severe decrease in employment: of 6.4% in 2008, equivalent to a reduction of 38,891 manufacturing jobs, reducing the overall manufacturing workforce from 3,289,196 to 3,250,305 between 2007 and 2008. This declining trend continued in 2009, when the rate of growth of employment reached -1.9%.
In 2009, 2010 and 2011 there was a mild recovery, with positive annual growth rates of 4.9%, 1.8% and 2.3%, respectively. However, this weak trend was unable to offset the severe decline of the years between 2007 and 2009. As a result, the average growth rate of employment in the Mexican manufacturing sector was negative (at -0.3%) during that five year period.
MANUFACTURING EMPLOYMENT BY SECTOR
Employment levels in the Mexican manufacturing sector have varied between its different subsectors. Some displayed a rapid recovery after the decline of 2008 and 2009, particularly those focused on export activities. On the other hand, subsectors oriented towards the domestic market and activities associated with petroleum are yet to recover fully from the recession.
Thus, the subsectors that have demonstrated the fastest growth in labor employment include transportation equipment, with a percentage increase of 24.3% between 2007 and 2012, followed by the other manufacturing subsectors, other metallic industries and machinery and equipment (Table 2). It is important to emphasize that this dynamic manufacturing subsector also is one of the most important in terms of the number of workers employed. For example, in 2007 the transportation equipment subsector accounted for 523,957 jobs, increasing to 623,596 in 2012 (Table 3). Significantly, these kinds of activities are directly related to auto parts exports, which is a manufacturing activity that is par excellence representative of the export orientation of the manufacturing and maquiladora sectors.
Table 2 Mexican Manufacturing Sector: Subsectors with Highest Annual Average Growth, 2007-2013
| Year | Transportation equipment | Other manufacturing industries | Basic metallic industries | Machinery and equipment | Plastic and rubber industries | Oil and coal products |
|---|---|---|---|---|---|---|
| 336 | 339 | 331 | 333 | 326 | 324 | |
| 2007 | 1.36% | 1.38% | 2.97% | -2.33% | 1.85% | -1.04% |
| 2008 | -15.28% | -0.97% | -4.12% | -4.80% | -8.91% | -0.45% |
| 2009 | -0.15% | -1.77% | -1.54% | -10.17% | 2.00% | -2.37% |
| 2010 | 14.88% | 7.25% | 5.95% | 11.72% | 7.76% | 4.75% |
| 2011 | 12.12% | 2.99% | 4.79% | 5.18% | 1.43% | 7.10% |
| 2012 | 9.62% | 2.21% | 3.88% | -0.15% | 6.67% | 1.94% |
| 2013 | 2.22% | 2.68% | 1.67% | 2.52% | 1.18% | 2.67% |
| AAGR 2007-2013 | 24.34% | 13.54% | 13.48% | 10.12% | 9.38% | 3.73% |
Source: Elaborated by the author using data from the National Institute of Statistics, Geography and Informatics (INEGI). Monthly Survey of the Manufacturing Industry (EMIM). AARG = annual average rate of growth.
Table 3 Mexican Manufacturing Industry: Subsectors with Highest Annual Average Employment, 2007-2013
| Year | Food industry | Transportation equipment | Computer equipment, communication, electronic components | Metallic products | Plastic and rubber industries | Apparel industry |
|---|---|---|---|---|---|---|
| 2007 | 624,886 | 523,957 | 292,227 | 234,284 | 174,629 | 197,104 |
| 2008 | 634,941 | 502,341 | 279,697 | 247,056 | 174,878 | 185,619 |
| 2009 | 639,571 | 405,910 | 234,116 | 225,749 | 156,417 | 168,514 |
| 2010 | 635,775 | 458,464 | 252,454 | 228,971 | 170,747 | 160,388 |
| 2011 | 634,987 | 538,047 | 250,229 | 226,347 | 176,975 | 152,673 |
| 2012 | 638,322 | 606,909 | 246,851 | 219,130 | 183,287 | 147,101 |
| 2013 | 637,935 | 623,596 | 249,953 | 217,834 | 186,215 | 147,597 |
| Average employment 20072013 | 635,136 | 512,759 | 258,896 | 229,518 | 173,533 | 167,466 |
Source: Elaborated by the author using data from the National Institute of Statistics, Geography and informatics (INEGI). Monthly Survey of the Manufacturing Industry (EMIM).
Other manufacturing industries characterized by higher levels of employment -computers and transportation and communications equipment, metallic products and the plastics and rubber sectors - are all aimed principally at the export market (Table 3). Thus, following the most recent economic recession of 2008 and 2009, the manufacturing activities that recovered fastest were those related to export activities. The only exceptions were the food and apparel industries, which are oriented toward the domestic market, but also saw employment rise.
The manufacturing subsectors in which employment grew more slowly during the period 2007-2012 were all - like food and apparel - involved in the production of inputs primarily for the domestic market, such as the timber industry, textile products and inputs, and oil products (Table 4). Finally, the subsectors that displayed the lowest levels of employment coincide with those that exhibited slowest growth in the period (Table 5), suggesting that the lack dynamism in these subsectors is also related to the international economic recessions.
Table 4 Mexican Manufacturing Industry: Subsectors with Lowest Annual Average Growth, 2007-2013
| Year | Apparel industry | Textile products | Textile inputs | Furniture | Lumber industries | Chemical industry |
|---|---|---|---|---|---|---|
| 315 | 314 | 313 | 337 | 321 | 325 | |
| 2007 | -4.04% | -5.47% | -9.41% | -6.04% | -2.04% | -0.12% |
| 2008 | -7.20% | -8.39% | -7.06% | -8.57% | -9.11% | -1.50% |
| 2009 | -2.22% | -1.92% | 3.13% | -2.21% | -4.77% | -1.48% |
| 2010 | -0.99% | 1.24% | 1.47% | 3.35% | 3.11% | 0.54% |
| 2011 | -3.23% | -1.14% | -1.90% | -0.24% | -1.02% | 0.87% |
| 2012 | 0.42% | 2.63% | 2.49% | 2.67% | 4.54% | -1.50% |
| 2013 | 2.02% | -0.72% | 2.61% | 1.33% | 2.53% | 1.07% |
| AAGR 2007-2013 | -25.33% | -24.65% | -22.35% | -21.12% | -18.90% | -14.24% |
Source: Elaborated by the author using data from the National Institute of Statistics, Geography and Informatics (INEGI). Monthly Survey of the Manufacturing Industry (EMIM)
Table 5 Mexican Manufacturing Industry: Subsectors with Lower Annual Average Labor Employment, 2007-2013
| Year | Lumber industries | Textile products | Oil and coal products | Publishing industries | Furniture | Textile inputs |
|---|---|---|---|---|---|---|
| 321 | 314 | 324 | 323 | 337 | 313 | |
| 2007 | 18,866 | 23,433 | 28,402 | 32,980 | 55,537 | 72,209 |
| 2008 | 18,181 | 21,769 | 29,193 | 33,232 | 54,290 | 66,294 |
| 2009 | 16,583 | 19,584 | 28,204 | 31,013 | 47,155 | 60,419 |
| 2010 | 15,724 | 18,553 | 28,716 | 31,986 | 47,608 | 60,050 |
| 2011 | 15,252 | 17,964 | 29,555 | 32,893 | 45,313 | 59,228 |
| 2012 | 15,239 | 18,320 | 29,442 | 31,758 | 45,345 | 58,333 |
| 2013 | 15,287 | 18,361 | 29,359 | 31,403 | 45,431 | 58,576 |
| Average employment 2007-2013 | 16,561 | 19,843 | 28,888 | 32,218 | 48,997 | 62,517 |
Source: Elaborated by the author using data from the National Institute of Statistics, Geography and Informatics (INEGI). Monthly Survey of the Manufacturing Industry (EMIM).
METHODOLOGY
The empirical strategy employed in this article was developed according to the general assumption that US imports from China, which reflect its general competitiveness (productivity and local cost advantages), affect the production of goods that are exposed to import competition both in the USA and in competing economies that also export to the US market. Therefore, the theoretical approach followed here considers that the behavior of employment in Mexico's manufacturing sector obeys the following patterns:
An important share of the final market for the production of manufacturing inputs and goods in Mexico is located in the USA. Hence, it is considered that labor demand in Mexican manufacturing industry is positively correlated to the manufacturing sector of the USA.
Given the comparatively lower manufacturing wages in China and in Mexico compared to those in the USA, demand for manufacturing labor in Mexico is inversely related to the level of wages that exist in China.
Because, since the end of the 1990s, Chinese exports have become an important part of US imports, particularly in manufacturing, Chinese exports have negatively impacted exports, output and labor demand of the Mexican manufacturing sector.
The exchange rate has been an important factor favoring the competitiveness of Chinese exports. As a consequence, higher rates of appreciation of the Mexican peso with respect to the dollar as compared with the yuan: dollar exchange rate has been related negatively to labor demand in the Mexican manufacturing sector.
It should be mentioned that there is insufficient available data to create a long-run series of monthly data on manufacturing employment in Mexico, Chinese manufacturing exports, and manufacturing wages in the USA, China and Mexico, either at subsector or regional level. For this reason it was considered appropriate to use a vector auto regression (VAR) approach to analyze the long run behavior of the model's variables at sectorial and country level for the monthly period from June of 2004 to December of 2012. An additional advantage of using this methodology is that it permits a better description of dynamic behavior and improved forecasting for the time series considered; it is also useful for estimating whether the time series are cointegrated in the long run. Therefore, in order to estimate the effect of Chinese manufacturing exports, wages and of the exchange rate on the demand for labor in the Mexican manufacturing sector, this paper uses a VAR approach, which provides the possibility of estimating an impulse response function of the dependent variable and a variance decomposition to evaluate the degree of impact of the explanatory variables used in the model.
Thus, the analysis considers a cointegration relationship between the explicative variables. This approach explains the behavior of labor demand in the Mexican manufacturing sector and permits its dynamics in the context of the economic integration of the Mexican and US economies and the effects of increasing Chinese competition in manufacturing imports to be estimated. Empirically, the specification of the model of labor demand within Mexican manufacturing is presented in logarithmic form as follows:
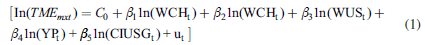
TME = labor employed in the Mexican manufacturing sector at time t;
CIUSG = Chinese manufacturing exports as a US industrial production
YP = ratio of the peso: dollar exchange rate to the yuan: dollar exchange rate;
WCH, WUS, WMX = manufacturing wages of China, USA and Mexico
u = error
In = natural logarithm
The average hourly wage in the Mexican manufacturing sector was estimated using information from the Mexican National Institute of Statistics Geography and Informatics (INEGI)'s Economic Information Bank (BIE); information on the average hourly Chinese wage was calculated using figures from the National Bureau of Statistics of China and the US equivalent was estimated using information from the Bureau of Labor Statistics (BLS); Chinese export figures were obtained from the US Census Foreign Trade Statistics and figures for the total employment of Mexican workers in manufacturing industry were obtained from Mexico's Monthly Survey of the Manufacturing Sector (EMIM). Additionally, US manufacturing imports from China were obtained from the National Bureau of Statistics of China, US manufacturing GDP from the Bureau of Economic Analysis, the exchange rate peso: dollar from the Bank of Mexico (BANXICO) and the yuan: dollar exchange rate from Economagic (Times Series Page). All the series were seasonally adjusted using the moving average methodology.
COINTEGRATION ANALYSIS
A series of tests was carried out in order to evaluate whether the empirical model fulfills the necessary unit root conditions to determine if the series of both the dependent and independent variables are stationary and cointegrate over time. In the first place, the Augmented Dickey-Fuller (ADF) and Phillips-Perron (PP) tests were estimated, to identify whether the series are stationary I(0) or present a linear trend or unit root In addition, and for the same purpose, a Kwiatkowski, Phillips, Schmidt and Shin (KPSS) (1992) test was estimated, based on the null hypothesis that the series are stationary.
The variables were logarithmically transformed, and subsequently the ADF and the PP test were applied, including a constant and a trend. According to the critical values of the t*(tau) and Mackinnon statistics (Mackinnon, 1996), the results showed that none of the series of variables considered in the model, in first differences, rejected the null hypothesis that the series is non-stationary and has a unit root, at the 1% and 5% level of confidence. In addition to the ADF and PP tests, a KPPS was also estimated, corroborating the results obtained in the previous tests (Table 6). Consequently, the non-stationary null hypothesis was rejected and the series of variables may be considered non-stationary; it is therefore possible to estimate a VAR model.
Table 6 ADF, PP y KPSS Tests
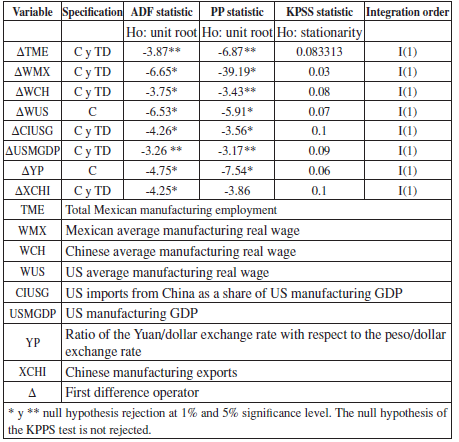
Source: Elaborated by the author using elaboration with data from the Mexican National Institute of Statistics, Geography and Informatics (INEGI)'s Economic Information Bank (BIE), from the National Institute of Statistics, Geography and Informatics (INEGI), the National Bureau of Statistics of China and the Bureau of Labor Statistics (BLS).
The variables considered were: Total labor employment in the manufacturing sector; the average manufacturing wage in Mexico, China and the USA; Chinese exports as a share of US GDP, US manufacturing output, the ratio of the peso: dollar exchange rate to the yuan: dollar exchange rate, and Chinese manufacturing exports to the USA.
COINTEGRATION ANALYSIS OF THE MODEL SERIES
In order to evaluate the behavior over time of the variables chosen to study the changes in labor employment in the Mexican manufacturing sector, a non-stationary VAR model was estimated. The methodology allows a flexible analysis of the dynamic interrelationship of the series employed in the model. Basically, the model, based on the variables of interest for the study, is estimated as follows:

where:
Yt = vector (Nx1) of non-stationary variables, in this case labor employment in the Mexican manufacturing
A1,....Ap y B = matrix coefficients to be estimated
P = number of lags included in the VAR model
Xt = vector of exogenous variables
εt = vector (Nx1) of error terms normally and independently distributed e
Based on the empirical criteria supported by the autocorrelation tests for monthly data, ten lags were used to estimate the model. Subsequently, with the purpose of fulfilling the required assumptions, different diagnostic tests were undertaken. As a starting point, the stability of the model was evaluated using the root of the characteristic polynomial of the VAR. The results, based on 10 lags, showed that the eigenvalues were located inside the unitary circle, satisfying the stability condition of the VAR (Table 7).
Table 7 Roots of the Characteristic Polynomial
| Root | Module |
|---|---|
| 0.989671 | 0.989671 |
| 0.948719 - 0.093333i | 0.953298 |
| 0.948719 + 0.093333i | 0.953298 |
| 0.847694 - 0.166985i | 0.863985 |
| 0.847694 + 0.166985i | 0.863985 |
| 0.734460 - 0.331943i | 0.805988 |
| 0.734460 + 0.331943i | 0.805988 |
| 0.630235 | 0.630235 |
| 0.344059 | 0.344059 |
| -0.059580 - 0.268454i | 0.274986 |
| -0.059580 + 0.268454i | 0.274986 |
| 0.153421 | 0.153421 |
| No root lies outside the unit circle. | |
| The VAR satisfies the stability condition. | |
Source: Elaborated by the author using data from the Mexican National Institute of Statistics, Geography and Informatics (INEGI)'s Economic Information Bank (BIE), the National Bureau of Statistics of China and the Bureau of Labor Statistics.
Additionally, a Wald test was estimated to determine whether the lags had impacted the VAR system, individually or as a group. The null hypothesis states that the coefficients of the lags are, jointly, not significantly different from zero. According to the estimations presented in Table 8, the Wald test for the model rejected the null hypothesis that when considered as a group the lags are not significantly different from zero until lag number eight of the equation is reached.
TABLE 8 VAR Lag Exclusion Wald Tests
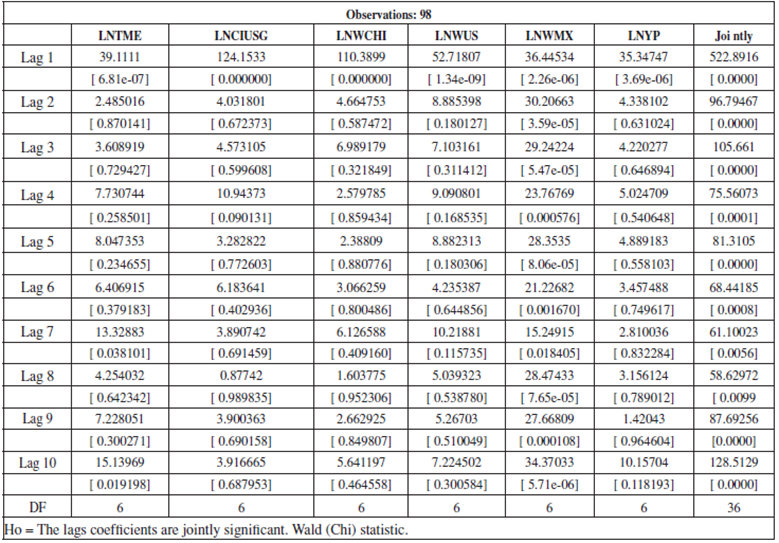
Source: Elaborated by the author using data from the Mexican National Institute of Statistics, Geography and Informatics (INEGI)’s Economic Information Bank (BIE), the National Bureau of Statistics of China and the Bureau of Labor Statistics.
Regarding the normality test, the Jarque Bera test statistics showed that the coefficients of kurtosis and skewness in the series of the VAR model adjust to a normal distribution, according to the null hypothesis. The results of the joint test indicate that the series are marginally normal, with a p of 0.000 > 0.05; only two components exhibit significant kurtosis (Table 9).
Table 9 Residual Normality Tests of the VAR Model
| Ortogonalization: Cholesky (Lutkepohl) | ||
|---|---|---|
| Observations: 98 | ||
| Component | Jarque-Bera | Prob. |
| 1 | 217.7436 | 0 |
| 2 | 505.8469 | 0 |
| 3 | 83.33187 | 0 |
| 4 | 1.10749 | 0.5748 |
| 5 | 8.439706 | 0.0147 |
| 6 | 5.024613 | 0.0811 |
| Jointly | 821.4942 | 0 |
| Ho: J-B = the residuals are normal. | ||
Source: Elaborated by the author using data from the Mexican National Institute of Statistics, Geography and Informatics (INEGI)'s Economic Information Bank (BIE), the National Bureau of Statistics of China and the Bureau of Labor Statistics.
A Breusch Godfrey Lagrange multiplier test (LM) was also undertaken in order to determine the existence of autocorrelation. According to the outcomes obtained at the 95% and 99% confidence level, the null hypothesis of the absence of autocorrelation is not rejected until 9 lags (Table 10). Lastly, the Granger causality test was estimated to evaluate whether the endogenous variable could also be treated as the exogenous variable (Table 11). When the Wald statistic was applied to the variables used in the VAR model, the results showed that the null hypothesis for manufacturing labor employment is not rejected and, therefore, does not affect the other explanatory variables of the model.
Table 10 Residual Serial Correlation LM
| Observations: 98 | ||
|---|---|---|
| Lags | LM-Stat | Prob |
| 1 | 42.27904 | 0.2181 |
| 2 | 47.21372 | 0.1 |
| 3 | 42.57467 | 0.2091 |
| 4 | 45.70963 | 0.1288 |
| 5 | 41.76966 | 0.2344 |
| 6 | 28.60482 | 0.805 |
| 7 | 43.47238 | 0.1831 |
| 8 | 23.54172 | 0.9454 |
| HO: No serial correlation at lag order h. LM = T*R2 (number of observations times R square). | ||
Source: Elaborated by the author using data from the Mexican National Institute of Statistics, Geography and Informatics (INEGI)'s Economic Information Bank (BIE), the National Bureau of Statistics of China and the Bureau of Labor Statistics.
Table 11 Granger Causality of the VAR Model
| Dependent variable: LNTME | |||
|---|---|---|---|
| Excluded | Chi-sq | df | Prob. |
| LNCIUSG | 14.4085 | 10 | 0.1552 |
| LNWCHI | 13.22511 | 10 | 0.2114 |
| LNWUS | 16.84179 | 10 | 0.0779 |
| LNWMX | 9.878833 | 10 | 0.4512 |
| LNYP | 18.28453 | 10 | 0.0503 |
| Jointly | 70.5679 | 50 | 0.0292 |
| HO: the jointly excluded variables do not cause the dependent variable. | |||
Source: Source: Elaborated by the author using data from the Mexican National Institute of Statistics, Geography and Informatics (INEGI)'s Economic Information Bank (BIE), the National Bureau of Statistics of China and the Bureau of Labor Statistics.
In order to determine whether the series of the model are cointegrated and jointly move over time, a Johansen cointegration test (Johansen, 1995) for the VAR model was estimated (Tables 12 and 13). The results of the trace and maximum eigenvalue statistics showed that the variables of the model have at least two cointegration equations (Lütkepohl, 2007). Hence, the test supports the model and allows estimation of the short term impact of the variables concerning the commercial and exchange rate policies of China on labor employment in Mexican manufacturing to be continued.
Table 12 Johansen Test (Trace Value)
| Null | Alternative | Trace | Critical | Probability |
|---|---|---|---|---|
| hypothesis | hypothesis | statistic | value | |
| (al 5%) | ||||
| r = 0 | r = 1 | 49.04318 | 95.75366 | 0.0003 |
| r ≤ 1 | r = 2 | 38.02216 | 69.81889 | 0.0317 |
| r ≤ 2 | r = 3 | 17.03299 | 47.85613 | 0.4901 |
| r ≤ 3 | r = 4 | 11.1461 | 29.79707 | 0.6266 |
| r ≤ 4 | r = 5 | 4.772337 | 15.49471 | 0.6913 |
| r ≤ 5 | r = 6 | 1.263733 | 3.841466 | 0.2609 |
| r = number of cointegrating equations | ||||
| '*' rejection of the hypothesis at the 5% level | ||||
Source: Elaborated by the author using data from the Mexican National Institute of Statistics, Geography and Informatics (INEGI)'s Economic Information Bank (BIE), the National Bureau of Statistics of China and the Bureau of Labor Statistics.
Table 13 Johansen Test (Eigenvalue)
| Null hypothesis | Alternative hypothesis | Eigenvalue statistic | Critical value | Probability |
|---|---|---|---|---|
| (al 5%) | ||||
| r = 0 | r = 1 | 49.0432 | 40.0776 | 0.0038 |
| r ≤ 1 | r = 2 | 38.0222 | 33.8769 | 0.0151 |
| r ≤ 2 | r = 3 | 17.0330 | 27.5843 | 0.5771 |
| r ≤ 3 | r = 4 | 11.1461 | 21.1316 | 0.6327 |
| r ≤ 4 | r = 5 | 4.7723 | 14.2646 | 0.7703 |
| r ≤ 5 | r = 6 | 1.2637 | 3.8415 | 0.2609 |
| r = number of cointegrating vectors | ||||
| '*' rejection of the hypothesis at the 5% level | ||||
Source: Elaborated by the author using data from the Mexican National Institute of Statistics, Geography and Informatics (INEGI)'s Economic Information Bank (BIE), the National Bureau of Statistics of China and the Bureau of Labor Statistics.
MEXICAN MANUFACTURING EMPLOYMENT AND THE IMPULSE RESPONSE FUNCTION MODEL
The impulse response function model permits the effect of a change of one standard deviation on each variable of the model to be esimated, by using the dynamic structure of the VAR, which modifies the value of all the endogenous variables (Pesaran & Shin, 1998). Impulse response functions were estimated for a period, considering 12 monthly lags. There are five relevant functions in the analysis of the effect of a shock in the VAR model, which exclude the zero value in the interval and are statistically significant.
The behavior of the variables showed a negative adjustment of employment in the Mexican manufacturing sector in response to a change in US industrial production, the ratio of the peso: dollar exchange rate to the yuan: dollar rate and real wages in the Mexican manufacturing sector, USA and China. Therefore, the results of the impulse response function support the theoretical assumption of a negative correlation between the costs of Mexican labor and the expansion of the manufacturing sector in the country.
Table 14 shows the response of the model's variables to a one standard deviation innovation. In particular, the variable of interest is the response of Mexican manufacturing employment to innovations in the explanatory variables. In the first place, the results show a negative impact on Mexican manufacturing employment due to changes in the share of Chinese manufacturing exports in US industrial production. This impact attenuates after three months and a posterior recovery is not noticeable in the response function. Additionally, an increase in the average wage in the US manufacturing sector also negatively affects Mexican manufacturing employment, with a monthly lag.
Table 14 Impulse Response of the Mexican Manufacturing Sector to Generalized Innovations
| Period | LNTME | LNCIUSG | LNWCH | LNWUS | LNWMX | LNYP |
|---|---|---|---|---|---|---|
| 1 | 0.0038 | -0.0004 | 0.0032 | 0.0007 | 0.0020 | -0.0012 |
| 2 | 0.0037 | -0.0005 | 0.0024 | -0.0006 | 0.0019 | -0.0006 |
| 3 | 0.0026 | -0.0007 | 0.0029 | -0.0013 | 0.0011 | -0.0012 |
| 4 | 0.0032 | 0.0002 | 0.0031 | -0.0025 | 0.0016 | -0.0009 |
| 5 | 0.0027 | 0.0014 | 0.0025 | -0.0005 | 0.0024 | -0.0008 |
| 6 | 0.0032 | 0.0022 | 0.0018 | -0.0011 | 0.0017 | -0.0010 |
| 7 | 0.0043 | 0.0037 | 0.0014 | -0.0006 | 0.0023 | -0.0012 |
| 8 | 0.0045 | 0.0040 | 0.0024 | -0.0010 | 0.0021 | -0.0023 |
| 9 | 0.0033 | 0.0035 | 0.0035 | -0.0007 | 0.0019 | -0.0027 |
| 10 | 0.0029 | 0.0042 | 0.0050 | -0.0005 | 0.0011 | -0.0030 |
| 11 | 0.0028 | 0.0041 | 0.0046 | 0.0007 | 0.0008 | -0.0027 |
| 12 | 0.0024 | 0.0037 | 0.0034 | 0.0005 | 0.0012 | -0.0023 |
| LNTME = log of total Mexican manufacturing employment, CIUSG = log of US imports from China as a share of US manufacturing GDP, LNWCH = log of Chinese average manufacturing real wage, LNWMX = log of Mexican average manufacturing real wage, LNWUS = log of US average manufacturing real wage and LNYP = log of Chinese manufacturing exports. | ||||||
Source: Elaborated by the author using data from the Mexican National Institute of Statistics, Geography and Informatics (INEGI)'s Economic Information Bank (BIE), the National Bureau of Statistics of China and the Bureau of Labor Statistics.
Regarding the impact on the Mexican manufacturing sector of the average manufacturing wage in China, the results showed a positive relationship, implying that Mexican labor employment increases when there is a shock from changes in average Chinese wages. Finally, concerning Chinese exchange rate policy, an impact derived from an increase in the ratio of the yuan: dollar to peso: dollar exchange rates produces a positive response in Mexican employment. This result suggests that China's exchange rate policy, aimed at undervaluing its currency, has a competitive effect on Mexican manufacturing exports to the USA, and therefore negatively affects employment in that sector of the Mexican economy.
CONCLUSIONS
Manufacturing industry in Mexico showed a lack of dynamism between 2001 and 2010. Furthermore, Chinese manufacturing exports to the USA have recently exceeded Mexican exports, particularly in important manufacturing subsectors. This trend has affected the dynamics of the Mexican manufacturing sector, including labor force growth. However, it is important to underline that location advantages and comparatively low wages as compared to wages in the USA, have sustained the competitiveness of the Mexican automobile and auto parts industries within the US import market.
Two of the factors of competitiveness of the Chinese economy that have supported its rapid export expansion have been the undervalued exchange rate and low nominal wage policies. As a consequence of these policies, Chinese manufacturing wages have historically been lower than their Mexican equivalents, and the undervalued yuan: dollar exchange rate has given Chinese exports a monetary factor of competitiveness with respect to the appreciated and somewhat inflexible peso: dollar exchange rate.
Table 15 Variance Decomposition for Mexican Employment
| Period | S.E. | LNTME | LNCIUSG | LNWCH | LNWUS | LNWMX | LNYP |
|---|---|---|---|---|---|---|---|
| 1 | 0.006 | 100 | 0 | 0 | 0 | 0 | 0 |
| 2 | 0.009 | 96.715 | 0.009 | 0.052 | 1.669 | 0.701 | 0.852 |
| 3 | 0.011 | 91.642 | 0.006 | 0.400 | 3.391 | 1.284 | 3.277 |
| 4 | 0.014 | 86.624 | 0.012 | 1.236 | 4.131 | 1.572 | 6.425 |
| 5 | 0.016 | 82.217 | 0.040 | 2.507 | 4.007 | 1.732 | 9.497 |
| 6 | 0.018 | 78.489 | 0.079 | 3.995 | 3.460 | 1.813 | 12.166 |
| 7 | 0.021 | 75.387 | 0.112 | 5.447 | 2.864 | 1.839 | 14.351 |
| 8 | 0.022 | 72.856 | 0.134 | 6.671 | 2.400 | 1.835 | 16.104 |
| 9 | 0.024 | 70.838 | 0.146 | 7.569 | 2.095 | 1.820 | 17.532 |
| 10 | 0.026 | 69.261 | 0.152 | 8.123 | 1.912 | 1.808 | 18.745 |
| 11 | 0.027 | 68.039 | 0.157 | 8.369 | 1.803 | 1.806 | 19.827 |
| 12 | 0.028 | 67.077 | 0.163 | 8.375 | 1.732 | 1.818 | 20.835 |
Source: Elaborated by the author.
Considering that an important factor explaining the dynamics of the manufacturing sector in Mexico is its dependency on the US market and that the recent economic recessions of 2001 and 2008 have affected the dynamics of such activities, the addition of manufacturing competition from China has contributed to the stagnation of manufacturing growth in Mexico. In order to estimate the effect of Chinese competition on Mexican manufactures, a VAR model was established. The variables considered as determinants of labor demand in the Mexican manufacturing sector are US industrial activity, Chinese manufacturing exports to the US market, Mexican, American and Chinese wages, and the yuan: dollar exchange rate as a proportion of the peso: dollar exchange rate. All the series examined during this research fulfilled the non-stationary conditions according to the DFA, PP and the KPPS tests. Additional tests showed that the model is stable, that it adjusts to the normal distribution, that the number of lags are jointly significant and that there is no autocorrelation. Finally, a cointegration test was undertaken and the results revealed the existence of two cointegration vectors.
In order to evaluate the impact of exogenous variables on the demand for labor in the manufacturing sector, several impulse response functions were estimated. According to the results, the demand for labor in the Mexican manufacturing sector responds negatively to innovations derived from an increase in Chinese manufacturing exports to the USA and to a rise in average manufacturing wages in the USA. On the other hand, Chinese average manufacturing wages positively impact labor employment in Mexico. Finally, an increase in the ratio of the yuan: dollar to the peso: dollar exchange rate also has a positive effect on labor employment in the Mexican manufacturing sector.
It may be concluded that the Chinese manufacturing sector has become an important competitor for Mexican manufacturing exports to the USA, with China surpassing Mexico as a US commercial partner in important manufactures such as generators, transformers, electrical equipment, computers, telecommunications and metallic products. However, Mexican exports associated with the automobile industry have been able to compete with Chinese exports. This research, therefore, supports previous findings about the competing effect of China on the export markets of Latin American economies (Jenkins, Dussel & Mesquita, 2008), and reveals its effects on employment in the Mexican manufacturing sector. The paper also shows the importance of the competitive advantage of China, which is associated with the historically low wages paid in the Chinese economy as compared to the wages paid in Mexico. Additionally, the policy of maintaining an undervalued yuan with respect to the dollar has also provided competitive advantages to Chinese manufacturing exports.


