


 English (pdf)
 Article in xml format
 Article references
 Send this article by e-mail
 Cited by SciELO
  Cited by Google
  Similars in
SciELO
Similars in
SciELO  Similars in Google
 Permalink
INTRODUCTION
The turmoil in the aftermath of the 2007/8 Great Recession called for a renewed debate on income distribution and its connection with public policy. Latin America in particular has been a paradigmatic example of inequality reduction over the last decade (Lustig, López-Calva & Ortiz-Juárez, 2013).
The objective of this article is to provide context to the evolution of inequality in Argentina throughout the period between 1996-2014 by breaking down the composition of household income into its various sources. The period of study includes a clear turning point between two consecutive vastly different macro-economic regimes: the Convertibility Plan years, which ended with the crisis of 2001/02, and the decade after 2003. The period of study is characterized by pro-found changes in household income inequality: increasing inequality leading up to the crisis and generally decreasing inequality following the crisis.
We contribute to the literature by applying a decomposition of the Gini coefficient according to both labour and non-labour household income sources as well as further sub-categories. Subsequently a dynamic analysis is performed, which allows us to quantify how changes in some income sources had an impact on the variations of the Gini coefficient (household income inequality)1 This is all taken into consideration and is intricately connected with: policy implementation, institutional dimension of labour markets, social protection institutions and the macroeconomic context. The methodology used in this analysis is based on widely cited work on decomposition by income sources, such as the seminal work undertaken by Shorrocks (1982) and Lerman and Yitzhaki (1985), among others.
The results show that labour income is a crucial driver of income distribution in Argentina. First, the increases in inequality in the mid-1990s and around the year 2002 are largely explained by a rise in the concentration coefficient of labour income. Later, the remarkable 22% reduction in the Gini coefficient in the 2003-2014 period was also principally driven by labour income, but this time in the opposite direction that is with an important fall in the concentration coefficient and a rise in the labour income share for all income deciles. Nevertheless, during the last decade, pensions and retirement pay also played a relevant role in the Gini coefficient’s decline, as did welfare programmes. Taking all factors into consideration, labour income (especially registered labour income) is a crucial determinant of house-hold income distribution. Hence, the recovery of labour institutions in Argentina after 2003, together with active income policies and the struggle against unregistered labour, all explain the improvement in the distribution of household income.
The rest of the paper is structured as follows: Section 2 reviews the relevant literature. Section 3 describes the decomposition methodology and discusses the data source and its limitations. Section 4 presents the evolution of the share of household income derived from different income sources and how those income sources are concentrated in Argentina over the period studied. Section 5 presents the results of our analysis, quantifying the effects that each income source has had on inequality in both periods. There is a distinction made between the participation effect and the concentration effect as well as the policy implications of these results. Finally, Section 6 presents concluding remarks.
RECENT RESEARCH ON INCOME INEQUALITY IN ARGENTINA
Relevant studies on income inequality have pointed out that there is not a sole explanation for distributive changes in Argentina (and Latin America); however, there are a number of factors that drive income distribution dynamics (Cornia, 2014; Gasparini, Cruces & Tornarolli, 2011; Lustig, 2012).
Income inequality in Argentina first rose during the 1990s throughout the Convertibility Plan years, and then subsided post 2003, encouraged by the series of policy reforms that were implemented when recovering from the crisis.
The first part of this path is described in Altimir, Beccaria and Gonzalez-Rozada, (2002). They argue that income inequality increased in the 1990s mainly because of higher wage inequality due to the importance of labour income for total household income. Lustig et al. (2013) argue that the secular deregulation of labour markets, combined with the liberalization of investment and imports and a fixed exchange rate (hard peg to the US Dollar), which undermined the competitiveness of Argentina’s exports, were all factors that contributed to the higher levels of inequality observed during the period.
According to an array of research (Cornia, 2014; Lustig et al., 2013; Maurizio, 2014), the implementation of pro-labour policies in Argentina, starting in 2002/2003, marked the turning point in the evolution of inequality. Policies included favouring union vindications, collective bargaining and an increase in the minimum wage. Furthermore, the innovations and technological changes that took place in the first decade of the twenty-first century were broadly labour-intensive and increased employment.
The wage gap between skilled and unskilled workers is due to the interaction between relative supply and demand. The arguments that explain the labour bias demand for skilled workers are associated with globalization and openness to trade (Anderson, 2005; Chusseau & Hellier, 2012; Goldberg & Pavnick, 2004, 2007) and are also associated with technological change (Acemoglu, 2002; Autor, Levy & Murnane, 2003; Card & Dinardo, 2006; Krusell, Ohanian, Rios-Rull & Violante, 2000).
Argentina is relatively abundant in both natural resources and skilled work force (Berlinski, 1994; Galiani & Porto, 2008). Based on this context, the trade openness and technological changes that took place during the 1990s increased the relative demand for skilled workers and, hence, the returns from education (Galiani & Sanguinetti, 2003). During the first decade of the XXI century, the skill premium significantly decreased, and there is still debate about the reasons for this change in tendency. The commodity prices boom increased the relative demand for unskilled workers; furthermore, the strong impact of technical progress on labour demand during the 1990s was not sustained during the 2000s. So, to some extent the relative demand of skilled workers was narrowed. Then, the combination of a lower rate of technological incorporation by production processes, changes in the sectorial composition of skilled workers and an increase in the supply of skilled workers may have reduced the skill premium in Argentina (Alejo, Gabrielli & Sosa-Escudero, 2014; Cornia, 2014; Gasparini et al., 2011; Gasparini & Cruces, 2010; Lustig et al., 2013; Gasparini & Lustig, 2011). To summarise, the reduction in returns from education during the 2000s is important factor in explaining the reduction in labour income inequality despite the fact that the sources of the reduction are still under debate.
Another important labour market transformation that affected the distribution of labour income is the formalisation process that took place in Argentina and Latin America. Amarante and Arim (2015) edited a collection of papers on this subject based on five Latin American countries. In Argentina’s case, Beccaria, Maurizio and Vazquez (2015) and Groisman (2014) conclude that both the decline in the skill premium and the reduction of labour informality contributed to the improvement in the distribution of wages between 2003 and 2013. Also, wage bargaining led to a less scattered wage setting process, which improved formal worker’ situations who were at the lower end of the wage distribution (Beccaria et al., 2015; Casanova & Alejo, 2015; Trajtemberg, 2009).
Moreover, the heterogeneity in the production structure helps to explain distributional dynamics. Even with significant growth rates after the 2001-2002 recession, Argentina did not experience significant structural change2. Based on this, some authors argue that the economic structure may act as an impediment for further improvement or even sustaining recent improvements in income distribution. Informality and precarious work still have relatively high levels, and there is significant labour market segmentation and marginality in terms of some sectors of the population’s economic activity. All of these present a socio-economic challenge for Argentina (Coatz, Garcia-Diaz & Woyecheszen, 2011; Lavopa, 2008; Salvia & Vera, 2013; Vera, 2011).
In sum, a significant bulk of the literature on inequality only focuses on wage (labour pay) inequality. Associated with this focus, explanations for the rise in inequality and its subsequent fall stress market-related explanations such as skill bias (for example, Bertranou & Maurizio, 2011; Maurizio, 2014; Trujillo & Villafañe, 2011).Recent studies demonstrate that the reduction of labour informality and the increase in social protection were central to the evolution of inequality in household per capita income in Argentina post 2002. The analysis in the following sections demonstrates the fundamental importance of public policy; the institutional dimension of labour income, which takes into consideration both registered and non-registered labour pay; as well as non-labour income, for the understanding of that evolution.
METHODOLOGICAL APPROACH AND DATA
Gini coefficient decomposition by sources of income
Income distribution can be measured by different indicators. The Gini coefficient is highly popular given its straightforward interpretation despite the fact that it presents some methodological limitations when analysing decomposition in population sub-groups that are mutually excludable3 However, the core analysis in this paper concerns sub-groups that are not mutually excludable since the decomposition of the Gini coefficients by income sources does not require excludability between sources of income. Hence, this additive decomposition limitation does not apply.
Several authors have proposed methods for the income source decomposition of the Gini coefficient. Among the most relevant contributions are Rao (1969), Shorrocks (1982), Lerman and Yitzhaki (1985) and Araar (2006). Furthermore, Sen (2001) argued in favour of income sources decomposition for inequality indicators and referred to Shorrocks’ methodology (1982) as being plausible.
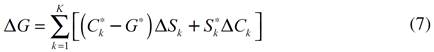
The Gini coefficient decomposition in this paper mainly follows Lerman and Yitzhaki (1985), which is closely related to Shorrocks (1982). Although this technique was originally developed three decades ago, it is still applied and is broadly used in specialized studies and reports undertaken by international organizations such as IMF, WB, ILO, OECD and UNPD4 The main reason for decomposing by income sources is being able to identify the absolute and relative contribution of each source of income in terms of inequality. Lerman and Yitzhaki (1985) adapt the standard definition of the Gini coefficient (derived from the Lorenz curve) to a sum of K sources of income (or income components):
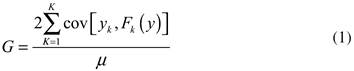
Where G is the Gini coefficient, y is total income expressed as the sum of the K = 1,…, K household income components  represents the cumulative distribution function of income from component k, and represents the mean income.
Operating with the covariance operator in (1) and the average income of source k (that is, k), it is possible to obtain equation (2), which explicitly determines the Gini coefficient for inequality in the different income sources and their relative participation in total household per capita income.

Following Lerman and Yitzhaki (1985), equation (2) can be expressed as (3):
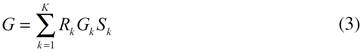
R k is the ‘Gini correlation’ between income component k and total household income. This coefficient ranges between -1 and 1, equals -1 when an income source k is perceived mainly by low income households, and equals 1 when an income source k is perceived mainly by high income households. Thus, it is likely that income sources such as government transfers may present ‘negative-sign Gini correlation coefficients’. That is because the importance of the relevant income source is expected to decline with increases in total household income. Oppositely, when the ‘Gini correlation’ coefficient is positive, a certain income source increases with total household income.
Gk is the ‘relative Gini coefficient’ of component k (that is, the inequality within each income source). This coefficient differs from the traditional Gini index because it considers all units, even units that do not receive that particular income source5 Finally, Sk is component k’s share of total household income.
Moreover, we adopt a further simplification suggested by Milanovic (1998), for which the concentration coefficient Ck is defined as the product between Rk and Gk. With this formulation, Ck represents the contribution to income inequality of a particular income component k, adjusted by the influence of that income source on total household per capita income. In sum, we arrive at expression (4):
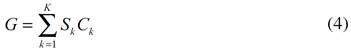
Equation (4) is our benchmark: the Gini coefficient can be decomposed into the sum of the concentration coefficient of each of the K income sources, weighted by its share6 of total income. Our analysis of the evolution of income inequality in Argentina is based on the interaction of the concentration coefficient (=C k )7 and the relative average participation of each income source (=S k )8.
Dynamic analysis: Gini variation between two periods
The Gini coefficient decomposed by household income sources, as in (4), can be computed for any number of discrete time periods. The objective of our dynamic analysis is to evaluate the impact that the variations in each income source have on the overall variation of the Gini coefficient in two periods:

Equation (5) expresses the differences between the Gini coefficients estimated for two distinct periods, isolating the variation due to the concentration and composition effects for each period. The problem with (5) is that it requires the explicit choice of a base year to compute the differences.
To avoid this issue, recent work undertaken by authors such as Trujillo and Villafañe (2011) 9 suggests using an arithmetic average of the value in both periods for each effect. This is indicated by (*) in equation (6).
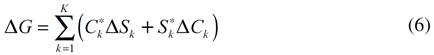
Lastly, considering that the sum of S k in each period is one, and thus the difference of the sum always zero, operating from (6) it is possible to obtain the following expression:
In equation (7), the first term represents the participation effect and the second term the concentration effect. A higher relative participation of income from source k over total income will help to reduce income inequality only if the average concentration coefficient of source k is lower than the average Gini coefficient. Then, the same source will contribute to the reduction of inequality if its concentration coefficient is reduced and weighted by its average relative participation on total income. Both effects interact, and they do not necessarily move in the same direction.
Data
In our analysis, household income is disaggregated into the following income sources (each k income source) and then divided into two groups, both labour and non-labour income:
I. Labour income
Formal labour pay (workers registered in the social security database)
Informal labour pay (workers who are not registered in the social security database)
Self-employed workers’ labour income10
II. Non-labour income
Pension and retirement pay
Public transfers (subsidies, conditional transfers, social programmes)
Other non-labour income (private transfers, returns on investment, profits and other non-labour gains)
Hence, with this scheme we have reconstructed the household per capita income variable from the specific household survey (EPH, Encuesta Permanente de Hogares) that enquires about each category as well as the amount of household income. All income variables (household income and each one of its sources) are expressed in per capita terms. As such, we will be referring to households although we will be taking into consideration their scale but not the individuals that comprise them.
All data used is from the EPH, and we use the May observation for the 1996-2002 analysis and the second semester observations for the 2003-2014 analysis due to changes in EPH structure11 There are, however, some caveats that apply to the use of these kinds of household surveys; the first is potential under-declaration (or failure to declare) of high income, which obviously affects the results. Another typical limitation of this type of data is that household income from investment in financial and physical assets is usually under-estimated. The reported EPH income is estimated after taxes, thus we do not measure the distributive impact of the tax system. This is clearly a related topic albeit one that lies out of the scope of this paper’s objectives. Also, since there was an important change in the survey’s methodology in 2003, the 1996-2002 and 2003-2014 series are not directly comparable.
THE EVOLUTION OF INCOME DISTRIBUTION: PARTICIPATION AND CONCENTRATION OF THE SOURCES OF HOUSEHOLD INCOME
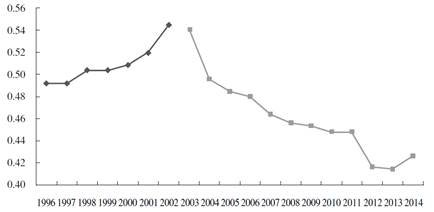
The evolution of the Gini coefficient of household per capita income over the 1992-2014 period is characterized by two opposing trends. During the 1990s (1992-2002) there was a strong increase in income inequality in Argentina, the Gini coefficient moved from 0.44 in 1992 to 0.56 in 2002.
In 2003 the trend was reversed. The Gini coefficient fell sharply in between 2003 and 2005, returning to similar levels as those observed in the mid-1990s. While the rate of decline subsequently slowed, the Gini coefficient kept falling, settling at around 0.42 between 2012-201412.
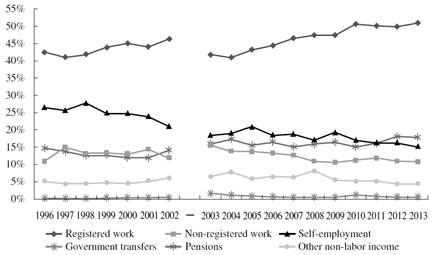
The overall Gini coefficient can vary due to changes in income source shares or changes in income source concentration indices. Income inequality depends both on the participation that each income source has on total household income and also on how it is distributed with respect to total income (that is, the concentration coefficient). Figure 2 shows the time evolution that the participation of each income source had on the total household income.
Source: The Authors. Source of data: EPH (INDEC) 1992-2002 for total urban centers calculated with “EPH Puntual”, may. From 2003 on, databases also published by INDEC for the newer continous EPH (second semesters). 2007 data is first semester because of lack of second semester data.
Figure 1 Evolution of the Gini coefficient (household income per capita) 1996-2014.
Household income is heterogeneous: each household derives its total income from various sources and in different proportions. There is a growing trend that the share of household income is mainly being derived from formal labour, and, at the same time, there is a reduction in income from non-formal labour self-employment (see Figure 2). Overall, labour income varies between 74% to 83% of total household income during the period being analysed There is a growing trend in the 1990s, a steep fall in the aftermath of the 2001-2002 crisis, and then a recovery starting in 2004. Specifically, formal labour income (that of registered workers) increased in the 2000s and reached half of total household per capita income (50%) in the five years from 2010 to 2014. on-labour income, pensions and retirement pay significantly increased their participation in household income from 14.7% in 1996 to 19.8% in 2014; this was mainly due to a series of public policies relating to mini-mum income and pensions for the elderly.
Source: The authors. Source of data: EPH (INDEC) 1996-2002 for total urban centers calculated with “EPH Puntual”, may. From 2003 on, databases also published by INDEC for the newer continous EPH (second semesters). 2007 data is first semester because of lack of second semester data.
Figure 2 Participation of income sources in overall household income. 1996-2014.
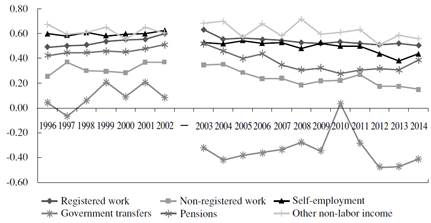
The concentration coefficients are central to income inequality dynamics. Given that labour income (formal, informal and self-employed) represents the vast majority of household income, the increase in its degree of concentration significantly impacts inequality. Figure 3 shows that the concentration of registered (formal) labour income has decreased since 2003. This fact, together with the increase of formal labour’s participation in household income, is expected to have a major impact on the reduction in income inequality that has been observed over the last decade.
Source: The authors. Sources of data: EPH (INDEC) 1996-2002 for total urban centers calculated with “EPH Puntual”, may. From 2003 on, databases also published by INDEC for the newer continous EPH (second semesters). 2007 data is first semester because of lack of second semester data.
Figure 3 Concentration index by income sources. 1996-2014.
Another relevant fact that should be addressed is the concentration dynamics of pensions. For this income source, the concentration coefficient started to significantly reduce from the 2003 period onwards. The concentration of pensions was 0.52 in 2003 and then, on average, 0.32 in the years following the global crisis. This indicates that this income source has extended to a greater number of low-income households whilst the same source presented a tendency to concentrate in higher-income households during the 1990s.
Generally, these diverse household income source dynamics have presented different trends over the last few decades in Argentina (in terms of participation and degree of concentration). These different trends over certain time periods require further analysis on how and to what extent these variations in participation and concentration have driven aggregate inequality and which policies or identifiable factors are behind them.
RESULTS AND POLICY IMPLICATIONS
During the Convertibility Plan era (1996-2002)13
Throughout the Convertibility years, the implemented macroeconomic model was based on a fixed exchange rate regime, profound trade openness in a context of pronounced currency appreciation, secular deregulation of factor markets (finance liberalization and alleged labour market ‘flexibilization’) and the privatization of public enterprises and the social security system, among other policy measures.
At the beginning of the period of analysis, Argentina was experiencing economic growth (an average annual rate of 1.2% GDP growth from 1993 to 1996). Towards the mid-1990s, in the turmoil generated by the 1995 Mexican Tequila crisis, there was an abrupt turning point in the country’s economic activity. Unemployment rose considerably, reaching two-digit levels in 1995, as did poverty and precarious living conditions (according to official data, the proportion of households below the poverty line increased from 11.9% in May 1994 to 19.6% in May 1996). Moreover, the distribution of income was compromised by a 7% growth in inequality between 1994 and 1996.
The period of interest for our analysis begins in the immediate aftermath of the Tequila crisis. In 1996 a new period of economic growth started, albeit once again with increasing disparity in the distribution of income (the Gini coefficient rose 2.4% from 1996 to 1998). Subsequently, a full economic recession started in 1998 that culminated in the 2001-2002 collapse. The impact of the crisis in terms of socioeconomic variables such as unemployment, poverty and inequality was unprecedented. The Gini coefficient broke the 0.50 barrier, increasing 11% from 0.50 in 1998 to 0.56 in 2002.
The evolution of the Gini Coefficient over the 1996-2002 period, including the decomposition into its participation effect and concentration effects components, is presented in Table 1. Inequality in terms of household per capita income increased by 14% (that is, a 7 point increase in the Gini coefficient). This broadening of the disparity in income distribution is a function of changes in labour income, which explains 89% of this variation in inequality. Not surprisingly, this is mainly due to the evolution of formal labour pay (FL), which explains 70% of the change in the Gini coefficient over this period.
Table 1 Participation and Concentration Effects 1996-2002.
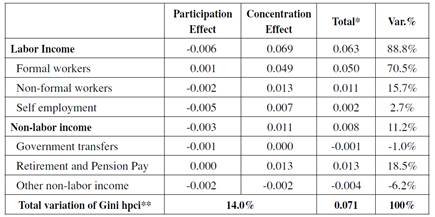
Note: * Absolute variation of Gini coefficient.
** hpci = household per capita income
Source: The Authors. Source: Own computations with EPH “puntual” survey (May)
The greatest part of this effect was transmitted by using the concentration effect. Recall that the concentration of any income source depends on the distribution of all income from that income source among its recipients as well as their location over the distribution of total income. Throughout this period, the second effect prevailed: the recipients of formal labour income were located progressively on higher deciles of income, which generated a positive and relevant concentration effect.
While formal labour became a larger component of total household income (rising from 42% in 1996 to 46% in 2002), its distribution was radically shifting away from the poorest households in favour of the wealthier households, as shown in Figure 4. This is reflected in a significant increase in the income concentration coefficient derived from formal labour: from 0.49 to 0.60 over this period. It is important to mention that the increase in FL’s contribution to overall household income (the participation effect) was driven not driven by formal employment, on the contrary it was driven by unemployment and recession. In any case, growth in formal labour income was highly concentrated in the higher deciles of the income distribution, and, as such, was an important component of the increase in house-hold per capita income inequality. The concentration effect explains most of FL’s contribution to the change in inequality over the 1996-2002 period (70%).
Source: The Authors. Source of data is EPH “puntual” survey (May). Households ordered by household income per capita.
Figure 4 Change in share of household income from formal work, by income decile. 1996-2002 (p.p.)
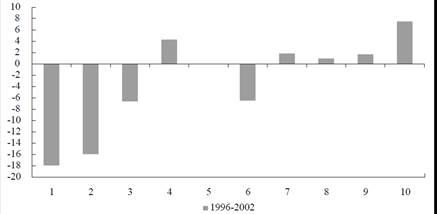
Although most of the worsening in income distribution over this period can be explained by labour income, it is important to analyse what happened within the 11% of variation that is explained by non-labour income. Pensions is the income source that contributes the most to the increase of the Gini coefficient (18%). The participation of this income source stays roughly the same over this period (there is a slight reduction in relative participation), but concentration increases significantly from 0.42 to 0.51. Similarly to formal workers’ income, pensions present a tendency to have a higher concentration in higher income per capita households (see figure 5). Thus the concentration effect of pensions and retirement pay has been the most significant driver of the increase inequality over this period.
Source: The Authors. Source of data is EPH “puntual” survey (May). Households ordered by household income per capita.
Figure 5 Variation of retirement pay and other pensions’ participation in household income, by income deciles. 1996-2002 (p.p.)
To sum up, the 1996 to 2002 period significantly deepened income inequality in Argentina. This was mainly due to profound changes in the labour market (i.e., growing unemployment, sub-employment and the worsening of job-quality and working conditions at the lower end of the pay scale). The increase in the concentration of FL income over this period was a major determinant of a higher Gini coefficient, but it was exacerbated by the increased share of total household income being derived from formal labour (in a recessive context, the increase in unemployment affects first and foremost those in informal or non-registered employment).
A new paradigm of public policy (2003-2014)
From 2003 to 2014 Argentina reduced its Gini coefficient by 12 points in the calculated per capita household income. This was achieved with a new macroeconomic regime with a new (or recovered) labour market and social protection institutions. This contraction of the Gini coefficient represents a 22% fall in income inequality, and it is the greatest reduction over a similar time period in the last three decades. Table 2 presents the breakdown of the changes in the Gini coefficient that have been calculated for this period.
Table 2 Participation and Concentration Effects. 2003-2014.
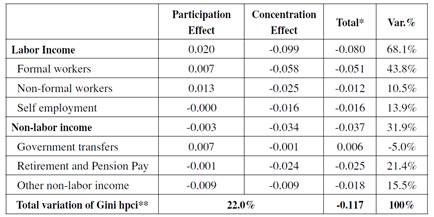
Note: * Absolute variation of Gini coefficient.
** hpci = household per capita income.
Source: The Authors. Own computations with continuous EPH database (second semesters).
The distributive dynamics of labour income (formal pay, informal pay and earnings from self-employment) were of central importance: they are responsible for 68% of the reduction in the Gini coefficient over this decade. Among these, changes in formal labour pay (FL) is the most important driver of the observed fall in inequality.
FL’s share of total household income increased significantly during the 2003-2014 period (+19%). In and of itself, such an increase would not necessarily translate into a reduction in the Gini coefficient; this is because, as previously discussed, a secular concentration process of FL income in the higher strata of household per capita income took place during the 1990s. If this highly concentrated distribution of FL had continued in the post-crisis recovery period, FL’s larger participation effect would have had an increasing effect on inequality.
Instead, the concentration of FL dropped remarkably (-20%) between 2003 and 2014. It is this change in the concentration effect that explains almost all of FL’s contribution to the fall in the Gini coefficient (44%).
The increase in FL over this period was due to the effect of movement from informal employment to formal employment: accordingly, the share of household per capita income that was derived from informal labour pay (IL) decreased during the second half of the period of study. General IL decreased from 49% of total labour in 2003 to 34% in 2014, and IL’s income’s share of total household income fell from 15.6% in 2003 to 10% in 2014. Moreover, the inequality among IL income fell over the same period (negative concentration effect). The reduction in the relative importance of this income source for households is, thus, a response to the decline in economic incidence of IL and not to a lesser distributive dynamism. In fact, the average informal wage increased by 74% over this decade while the for-mal average wage increased by 55%14
Change in self-employed labour income (SE) provided 14% of the total reduction in the Gini coefficient over the 2003-2014 period. SE income is characterized by high heterogeneity (i.e. variance), with an average Gini coefficient over this period of 0.51. The SE income became a smaller share of household income (falling from 18% to 15% of household income), and, additionally, the concentration of SE income fell by 9 percentage points (p.p.). When taken together, these effects produce SE’s contribution, that is, 14% of the total change in the Gini coefficient household per capita income.
Thus far we have quantitatively analysed the evolution of the aforementioned labour income sources’ relative roles on household per capita income and their contribution to changes in Argentine household per capita income distribution (Gini coefficient) from 2003-2014. In the following sections we discuss the macroeconomic processes and policies that helped generate the reductions in inequality observed over this period. To summarise, the decade was characterised by a recovery in economic growth and was driven by revitalized aggregate demand and employment. This allowed for a transformation in the macro tendencies in the labour market, both in terms of labour income participation and distribution.
The main macroeconomic contrast between the economic growth that took place from 2003 to 2014 (5.7% average annual growth) and that of the 1990s (-0.01% average annual growth)15 is the emphasis that was placed on the domestic productive structure. A competitive, high real exchange rate was a crucial factor for most Argentinean industries to recover, and it was also the main component of the macroeconomic policy during the first half of the decade. Other features included an increase in public investment and in social and welfare expenditures, as well as other income-related policies that favoured the expansion of aggregate demand. Lastly, the increasing price of commodities during this period drove an outstanding growth in exports, which improved the balance of current accounts and currency flows. Total openness to international trade (exports plus imports as a percentage of GDP) was, on average, 8.5% from 1993 to 2001 and, on average, 17.2% from 2003 to 2014.
In this macroeconomic context, there was consistent growth in employment throughout the decade, with a 3.3% average annual growth rate. Even after the effects of the most recent global economic recession, as of the fourth quarter in 2014, the employment rate was 42.1%.
There was vigorous employment growth in labour-intensive industries, particularly in manufacturing and construction. This effect led to growth in employment for all skill groups although there were higher rates of growth for those who had a minimum of high school education. Considering the bias towards high-skilled workers that was exhibited in the concentration of FL in the 1990s, the job creation during the 2003-2014 period represented a significant reversal.
Another contrast with respect to the employment dynamics in the 1990s is that, since 2003, registered formal workers were responsible for the broad increase in labour occupation. FL increased by 39.2% while IL increased only by 11.1%, and SE increased by 14.9%. These increases evidence the relative expansion of FL, which implies an incorporation of unemployed and precarious workers to the formal labour market. Thus, the incidence of IL among labour was reduced: the rate of IL over this period fell 15.6 percentage points (p.p.) from 49.2% to 33.6%16
Figure 6 shows how FL growth is reflected in an increase of that income source among the lower-income groups. For the first three deciles of income, the composition of income changed significantly since the share of income derived from FL increased between 10 and 15 p.p. over the 2003 to 2014 period. This means that it become a much more significant income source. The Gini coefficient for FL income fell from 0.35 in 2003 to 0.29 in 2014: an 18% distributive improvement.
Source: The Authors. Source of data is EPH survey (second semesters). Households ordered by household income per capita.
Figure 6 Variation of formal labor income’s participation in household income, by income deciles. 2003-2014 (p.p.)
The last world-wide international economic crisis that began in 2007/2008 had a strong impact on the improvement dynamics of income distribution. The improvement trend initiated in 2003 was conspicuously slowed down, although not reversed, especially between 2008 and 2009. This was mainly due to the fact that new tools were added to the policy package being developed at the time. These new policy tools were developed to address the recessive economic environment and strengthen the population’s social and labour conditions (Ministerio de Trabajo, Empleo y Seguridad Social [MTEySS], 2010).
From a macroeconomic perspective, new resources were applied to stimulate investment, production and consumption in sectors and industries that have a robust, positive impact on employment and overall economic activity. Regarding employment, the existing programme for job preservation was extended. Under this programme (REPRO, acronym in Spanish for Productive Recovery Programme) the public sector subsidizes part of wages in firms that have extenuating financial circumstances17 Fiscal stimulus was applied in order to promote formal (registered) hiring and the regularization of labour, and training programmes were provided for those who required skill improvement to ensure better labour market insertion.
Also, policies were implemented to boost income. The minimum wage was increased, collective bargaining was sustained, the increases in pension and retirement pay were guaranteed by law, and the conditional transfer programmes for the most vulnerable population groups were augmented.
Although labour income is the main source of household income, non-labour income is crucial for distribution policies because it is usually plays an important role for vulnerable population groups such as retirees, those who cannot participate in the labour market, and those households participating in transfer programmes. Preservation of household income is also achieved through policies that have an impact on non-labour income. Hence, it is important to analyse the dynamics among non-labour income sources.
Non-labour income is mainly made up of retirement and pension pay (RP): the second-most important income source driving the reduction in the Gini coefficient throughout the 2003 to 2014 period (21%). RP income increased its share of household income (from 16% to 20% over the same period) while its con-centration coefficient simultaneously fell significantly (from 0.51 to 0.38 over the period). Both the participation and concentration effects associated with RP income moved in the same direction, driving almost one fifth of the fall in the Gini coefficient observed in this time period.
This remarkable contribution of RP income to the overall reduction in income inequality is due, on one hand, to the overall increase in all pensions; and on the other hand, to the extension of this welfare protection to all households on the low end of the income distribution scale. In other words, not only did the quality of the benefits improve, they were also extended to the most vulnerable households.
The expansion of the welfare and social protection system to elder citizens was accomplished through a special policy implemented in 2005. Its main objective was to provide a pension to those citizens old enough to apply for retirement (60 years old for women and 65 years old for men) who were not recipients of any retirement pay (or pension) as they had not made enough social security contributions during their years of economic activity. An anticipated pension was also assigned to those workers who had made enough contributions to the social security system but were not eligible to apply for a pension. The improvement of retirement pay and pensions was an active welfare policy. The institutionalization of this policy took place through a new law, the Retirement Mobility Act of 2008, which established two annual increases in RP, subject to the evolution of general tax income, wages and social security contributions (MTEySS, 2014).
This policy measure benefited more than 2.4 million people. In 2014, the social security system coverage rate for the retired population reached 97.4% after having fallen during the 1990s (the coverage rate was 71.3% in 2002)18 By 2005, around 32% of citizens of RP qualifying age lacked access to these benefits; this was mainly due to the fact that long spells of unemployment in the 1990s meant that they had not accumulated the requisite amount of continuous contribution periods required to apply for a pension.
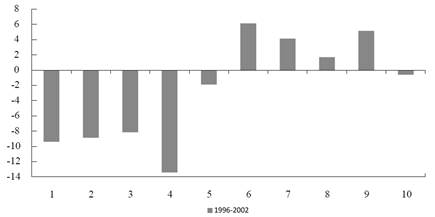
To sum, RP played a central role in reducing the Gini coefficient from 2003 to 2014 due to, the policy decision to use RP as a welfare protection tool. Because of this, the Gini coefficient for RP fell from 0.41 in 2003 to 0.31 in 2014, which is a 25% decrease in RP income inequality. Figure 7 clearly presents that the distributive change in this income source is generated by greater participation from the lower income deciles compared with those from higher income deciles (8, 9 and 10).
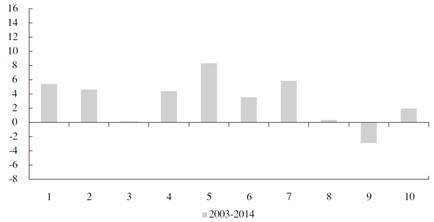
Source: The Authors. Source of data is EPH survey (second semesters). Households ordered by household income per capita.
Figure 7 Variation of retirement pay and other pensions’ participation in household income, by income deciles. 2003-2014 (p.p.)
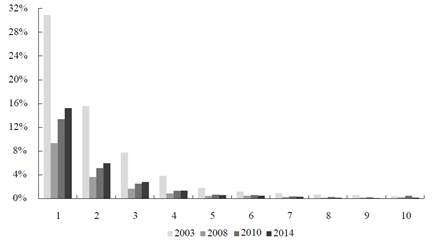
Government transfers are the final key element to be able to understand the fall in the Gini coefficient between 2003 and 2014 in Argentina. During this period, restructuring the transfer policy improved targeting through a redesign of the beneficiary profile. As a result of the design changes, the number of households receiving money transfers increased.
Other examples of conditional transfer policies applied in Latin America are well known, such as Bolsa Familia in Brasil, Oportunidades in Mexico, or Familias en Acción in Colombia. In Argentina, the economic crisis of 2001-2002 seriously compromised the labour market outlook, and an expansion of social protections was required, which had been, to that point, quite scarce. The Labour, Employment and Social Protection Ministry implemented a significant programme called Plan jefes y jefas de hogar (PJJH), which covered 2 million households: representing about 20% of the country’s total at that time19
The economic growth process that started in 2003 was paired with strong job creation. This new context required the redesign and gradual termination of the PJHH programme. Two new programmes with specific characteristics were developed for the vulnerable population: the Seguro de Capacitación y Empleo (Training and Employment Insurance) deployed by the Labour, Employment and Social Protection Ministry, and the Plan Familias por la Inclusión Social (Families for Social Inclusion) channelled through the Social Development Ministry. The latter was targeted at low-income mothers, and it consisted of monthly money transfers that depended on the number of children they had under the age of 18. Also, it was conditional on education and health requirements. Nonetheless, the coverage and household income impact was relatively low20
The Asignación Universal por Hijo para la Protección Social (AUH, a conditional money transfer per child) was implemented in 2009 during the global recession. This plan consisted of a transfer to households that augmented the pre-existing Social Security system based on the number of children under the age of 18. The target of this still existing plan is a population that is not eligible for other social transfer programme, either contributive or non-contributive: the unemployed, those registered in a self-employed social system regime, non-registered workers, domestic workers, or those who receive labour pay based on the current minimum wage.
The universality of the programme is a central feature as it covers the entire population under the age of 18 as well as all options of access to social protection (contributive, non-contributive or tax deduction). Moreover, the amount transferred is proportional to household income, and, presently, it is established on the same scale as the contributive system (the amount received per child by a formal registered worker, which was 644 ARS as of August 2014).
According to the Argentine Social Security Authority (ANSES), more than 3.3 million children and teenagers were covered by the AUH in April 2014. Based on the 2010 census, the estimated projection is that currently around 27% of the total population 17 years old or younger is covered by the AUH.
Although the aim of this paper is to analyse the transformations that occurred over the 2003-2014 period, it is pertinent to have an understanding of specific changes that took place between 2009 and 2014, in particular the AUH that was implemented in late 2009. To better comprehend the distributive impact of social transfers, we must now closely analyse the two main transfer policy programmes: PJJH and AUH.
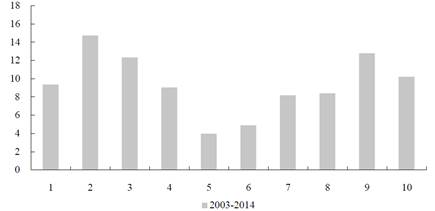
With the implementation of the Plan Jefes y Jefas de Hogar Desocupados (PJJH) welfare plan during the aforementioned economic crisis at the beginning of this century, government transfers in 2003 represented more than 30% of total household income for the first decile and almost 15% for the second decile. A decade later, in 2014, government transfers (mainly AUH) represented only 15% and 6% of the total income for the first two deciles of household income, respectively (see Figure 8). The main reason for the decline has been the recovery of the labour market. There has been an improvement in both the employment rate and labour income (wages), which has had a positive incidence across all household income deciles, particularly for the lower deciles.
Source: The Authors. Source of data is EPH survey (second semesters). Households ordered by household income per capita
Figure 8 Participation of government transfers in household income, by income deciles.
In the three lowest income deciles, the participation of registered labour income increased, on average, by about 12 percentage points between 2003 and 2014. This increase in labour income explains the decline in the relative importance of transfers in household income for the lowest income deciles.
In other words, by 2003 social transfers and labour income were worth the same value for the poorest households’ income (around 31%); by 2014 the main source of income for these same households became labour income (around 43% for both registered and non-registered). This was the reality despite the increased coverage and amount of money transferred via the AUH compared to the coverage and amount of money transferred through the PJJH.
Overall, the contribution of government transfers to total household income was low throughout the whole decade, around 1%, with two peaks in 2003-2004 due to the PJH programme and in 2010 as a result of the AUH programme. In the latter peak the incidence is lower due to the improvement of labour income’s share of total income (i.e., 42% in 2003 vs. 50% in 2014) as well as the consolidation of the labour market.
The only decline in inequality in Argentina took place between 2009 and 2014; this can be seen in the 6% fall in the Gini coefficient, from 0.45 in the second semester of 2009, to 0.42 in the same period of 2014. There are two core aspects to this distributive improvement. Firstly, the labour market performed well: 90% of the distributive improvement can be explained by change in labour income. As explained above, both the increase in labour income’s share of household income and the fall in its degree of concentration helped to reduce inequality. Secondly, social transfers explain the remaining 10% of the distributive improvement. The AUH is the main factor: in a context of moderate unemployment and non-registered labour, it complements income and social protection for low income households.
To summarise, the macroeconomic policy package implemented since 2003 coexisted with a sustained growth in employment (and FL in particular), a higher rate of social security protection, and the remarkable improvement in household income distribution. The decomposition of the Gini coefficient by income sources presents evidence that the evolution of FL income and RP income, over the period from 2003 to 2014, explain most of the reduction in household income inequality in Argentina. Together, they explain 65% of the Gini coefficient’s reduction throughout this period (44% and 21%, respectively).
CONCLUSIONS
This paper has studied the evolution of income inequality in Argentina from a unique perspective. We have measured the relative contribution of all of the different sources of household income to overall inequality, and we have done so for two recent periods. The first featured a record breaking increase in inequality and the latter showed a pronounced reversal.
Labour income has proven to be a crucial driver of distributive dynamics, given its importance in total household income. The evolution of formal (registered) work is central to understanding the changes in the Gini coefficient of household per capita income over the last two decades. That is because of the institutional umbrella provided by formal work in contrast to informal work (for example, union coverage and collective bargaining). During the Convertibility Plan years, there was a decrease in formal workers’ wages as well as in the formal employment rate (that is, the proportion of the work force legally employed and paying social security). Hence, formal work became the main transmission channel for the increase in income inequality.
In contrast, starting in 2003, formal labour income transformed into the source of household income that was most responsible for the improvement in income distribution. This is because as employment started to grow its growth was primarily in formal (registered) work. This growth brought a reduction in wage dispersion and the increase in formal employment that can be observed across all income deciles. Public employment and macroeconomic policy were the decisive tools achieve this change.
The social security system also played an important role in terms of the evolution of income inequality in Argentina. The increases in both the proportion of the population with access to retirement pensions and the size of pensions were determining factors for the distributive improvement that has taken place since 2003. Government transfers also had a robust, if relatively small, effect on overall inequality. The AUH plan was of central importance in stabilizing the situation of those households experiencing unemployment or working in precarious or informal settings. These income policy plans are of crucial importance for households in the lower part of the distribution, and they contributed strongly to the reduction of inequality by improving their household per capita income.
To conclude, we find that public policy aimed to improve working conditions, and it promoted not only the rate of employment but also the quality of jobs. This is of fundamental importance for reducing disparity in income distribution. The social security system, responsible for protecting those without (formal) labour income, is the other key element to ensure better distributive outcomes.
Nevertheless, we question the sustainability of this income inequality reduction in Argentina given the limitations that the economy is facing. Labour income has shown to be a crucial factor in the improvement of the distributional landscape and still one third of workers are informal workers. This is a persistent setback for the improvement of the income distribution in Argentina. It is true that informality was reduced significantly compared to the situation in the mid-1990s, but these improvements are proving to be tough to strengthen or even keep in the near future.
The last few years have presented a clear deceleration in the improvements in the distribution of household income, mainly due to a less favourable international scenario. The fall in commodity prices and macroeconomic turbulences have the possibility of affecting Argentina’s fiscal ability to promote and carry on with non-contributive income policies. These directly benefit households and also affect labour market outcomes (i.e. unemployment, informality, minimum wage policies and collective bargaining).
A new chapter in the history of the evolution of income distribution in Argentina is now opening, and we hope to have, in the near future, more and better data related to higher income (not registered or undeclared in most surveys) as well as fiscal data that will allow us to analyse the distributive aspects of income in a more precise manner.

