English (pdf)
 Article in xml format
 Article references
 Send this article by e-mail
 Cited by SciELO
  Cited by Google
  Similars in
SciELO
Similars in
SciELO  Similars in Google
 Permalink
INTRODUCTION
Throughout the last century, taxation and social transfers have been of great relevance for many Latin American countries, including México. The transfers related to social programmes provide income assistance in the form of social benefits and food stamps to the deprived, the unemployed, those on maternity leave, people who are not working due to a work injury, people not working due to sickness, the elderly, and even to people who are training to increase their opportunities in the labour market. Many of these transfers are financed by social security contributions as well as by other taxes (direct or indirect). In this paper, we focus on tax and benefit systems pertaining to social transfers, personal income tax (PIT) and indirect taxes in México. Tax and benefit systems have a significant influence on disposable income distribution when they are able to reduce differences in market income.
México is a country that has a high level of persistent income inequality. In order to highlight this inequality, we show some elements that offer a basis to improve the tax system and they set out some general guidelines for future fiscal redistributive reforms. Our aim is to analyse the Mexican fiscal system using the taxes paid and the cash-transfers received in the households by employing a novel non-para-metric approach based on Duclos, Jalbert and Araar’s (2003) methodology (DJA henceforth), which is a method that decomposes the redistribution of inequality into vertical equity, horizontal inequity and reranking. Our hypothesis states that even if the tax system in this country is progressive, and it redistributes income, there are still high levels of inequality that the tax system is not able to lessen by itself. After social benefits have been assigned, persistent levels of post-fiscal income inequality will remain the same; these levels are much greater than other transitional or Latin American countries.
The trend in Mexican income inequality shows a decreasing pattern from 2002 to 2006, and then it returns to its initial level in 2008, year in which Campos-Vazquez, Esquivel and Lustig (2014) obtained a standard Gini index of 0.51. Also, inequality decreased to 0.49 in 2010, and it seems to have reached a peak again in 2012 (Huesca & Araar, 2016). Regardless of whatever actions the fiscal system takes, some of the factors driving this overall inequality have to do with the link with non-labour income inequality and the role of labour remittances and government transfers.
A low taxable base at both, state and county levels, as well as an informal sector reaching up to sixty per cent of the labour force (Dougherty & Escobar, 2013; Instituto Nacional de Estadística [INEGI], 2014), implied a weak tax-benefit system in 2012. Also, the means-tested benefits had a peak in this year. These facts provide an opportunity to examine the effects of the tax-benefit system and its impact on redistribution in the Mexican households.
In 2015 México faced a fiscal crisis due to the sudden decrease in international oil prices, the Mexican government’s inability to increase the productivity of revenues from taxes and the rapid internal increase in food and energy prices. As a result, 2014 fiscal reform expanded consumption subsidies and targeted benefits as long as it increased both the VAT and special taxes on consumption, from 15 to 16 per cent in the former and the tax-burden in the latter.
In general, the benefits analised here are focused on social programmes (such as programmes for the elderly, the Prospera programme for the poor, and food aid and assistance for the unemployed providing only temporary employment). These types of benefits are important due to their potential to fight inequality as well as poverty. Only four of the previous benefits have recently shown a much greater impact after its allocation to Mexican households (Consejo Nacional de Evaluación de la Política de Desarrollo Social [CONEVAL], 2009a)1. Such programmes should have a greater impact on the aforementioned groups, i.e. they should those be the resources' main recipients (see the Appendix Table A4 for coverage of transfers among the benefited groups).
As part of this research, we use a micro-accounting approach to obtain a database that is strong enough to provide a robust picture of the fiscal system. The approach uses direct identification methods to collect the benefits and impute taxes, and is based on the law suggested by Lustig, Pessino and Scott (2014). The collection of data can give either an overestimation or underestimation of the tax or benefits figures; however, we address this by making adjustments to control for the informal sector.
In order to compute the effects of redistribution, we evaluate the impact of governmental intervention taking into consideration that redistribution may increase or decrease income disparities. “Equal must be treated equally”: this ethical value is related to the negative impact of Horizontal inequality (HI) on the redistributive effect (Musgrave, 1990). To assess the extent of HI and its impact on the Mexican fiscal system, we used a DJA approach.
The main findings reveal that the fiscal system has a redistributive effect on reducing inequality. PIT does not largely contribute to improving Vertical Equity (VE). Means-tested benefits contribute the most to improving VE, and they followed by contributory pensions; meanwhile, social security contributions have a nil impact on the redistribution of income.
The rest of the paper is organised as follows: Section 2 provides a brief description of the Mexican tax and benefit system, presents the literature review and describes the DJA methodological approach; Section 3 presents the assessment of the data, the empirical application and discusses the main findings based on the methodology; and Section 4 concludes and gives some general recommendations by providing some insights for future studies.
DESCRIPTION OF TAX AND BENEFIT SYSTEM IN MÉXICO
In México, income taxes (which include corporate and personal income, profits and capital gains) are the most important source of revenue collected from taxes, then followed by Value Added Tax (VAT) and Special Consumption Taxes (IEPS). In 2014, combined tax revenue was worth 2.17 billion US PPP dollars, which accounted for 10.6 per cent of Gross Domestic Product (GDP). The highest pro-portion of tax revenues came from income tax and VAT (50 and 39.2 per cent, respectively), while IEPS, tariffs and other taxes represented a lower share of revenue (4.81, 1.82 and 4.09 per cent, respectively).
Regarding income taxes, the Mexican PIT system is subject to a progressive tax schedule that has eleven tax brackets according to wage-earners’ monthly income. For each income bracket, the PIT tariff combines a marginal tax rate and its corresponding tax payment. The first is applied to the excess over its lower limit and the second is a tax on its lower limit. Tax payments goes in the order of [0.00, 9.52, 247.24, 594.21, 786.54, 1,090.61, 3,327.42, 6,141.95, 15,070.90, 21,737.57 and 78,404.23] Mexican pesos, and the marginal tax rate ranges from 1.92 to 35 per cent.
The main indirect taxes are VAT and IEPS. Since 2014, the VAT rate has been 16 per cent; however, certain goods and services are levied at zero rate or are tax exempted (e.g. books, non-processed food and medicines are taxed at zero rate; and services such as public transportation, schooling, and medical services, are tax exempt). Furthermore, IEPS is levied on gasoline and diesel, telecommunications, gambling, energy drinks, high calorie food, alcoholic beverages, cigarettes and tobacco. Goods vary widely in terms of tax rates (from 3 per cent for telecommunications to 53 per cent for high alcohol content alcoholic beverages).
Mexican social benefits are classified as either means-tested or non-means tested (see Table A1 from Appendix). Regardless the poverty condition in our database we found that 32 per cent of households received at least one means-tested transfer in 2014. The most relevant transfer given to the poor is Prospera; 28.04 per cent of households benefited and received an average transfer of 27 US PPP dollars, despite the maximum amount of cash transfer being close to 171 US PPP dollars. Moreover, the elderly programme is the second largest means-tested transfer; 54.25 per cent of households obtained access to an average benefit of 40 US PPP dollars. Conversely, the pensions system is considered to be a non-means tested transfer due to the fact that payments are made on the basis of previous social security contributions. In 2014, 34.86 per cent of households received an average of 342 US PPP dollars from pensions (see Table A4 in the Appendix).
Literature review on income redistribution and inequality
In recent years there has been a renewed interest in discussing theoretical and empirical issues on the redistributive mechanisms of income and their impacts on income inequality. There are some alternative approaches that use decomposition techniques to investigating distributional implications resulting from changes in the fiscal systems. Bishop, Formby and Thistle (1997) analysed inequality from income sources and household characteristics in the US based on the Tax Reform Act of 1986. They found that the Act has a neutral effect as no subgroups of the population were better-off or indeed affected by the reform. Mills and Zandvakili (2003) examined the redistributive effects before and after taxes and transfers in the US using decomposable measures of inequality according to household size and fiiling status.
Immervoll et al. (2006) analysed the redistributive effect of 15 European Union Member States’ tax-benefit system by comparing the standard Gini Coefficient before and after taxes and benefits. Findings revealed that countries achieved a higher inequality reduction mainly by using non-means tested benefits and taxes. Kaplanoglou and Newberry (2008) analysed alternative indirect tax structures in Greece and estimated the redistributive effect of the vertical and HI components. They found that VE is possible, even when more HI is induced by indirect tax reforms. Bibi and Duclos (2010) studied the poverty dominance in the fiscal system for five developed countries (Sweden, UK, Canada, United States and Germany). They manifested how the redistributive effect had a major impact on reducing poverty in Sweden; additionally, the Canadian tax system was most successful in avoiding increased poverty levels.
Bird and Dendron (2011) analysed the need for research into developing and transitional countries; these authors, explain the need to work on priority reforms to reduce HI by improving indirect taxation. In terms of transitional countries, Cook, Urban and Verica (2013) applied the DJA model to decompose the redistributive effect (VE and HI components) for Slovenia and Croatia. Even though both countries share a similar background in terms of politics, findings revealed that their fiscal systems had different outputs. Despite Slovenia having a higher level of HI than Croatia, the Slovenian fiscal system produces a greater impact on VE and, as a consequence, has a greater redistributive effect.
Moreover, studies on developing countries in Latin America revealed that Argentina, Uruguay and Brazil have the most redistributive fiscal systems, in contrast to Bolivia, México and Perú (Lustig et al., 2014). Additionally, a recent study to assess Uruguay’s income redistribution found a significant reduction in terms of both inequality and poverty when both taxes and benefits are combined (Bucheli, Lustig, Rossi & Amábile, 2014). However, a possible limitation of these studies is due to them using a local approach to evaluate the redistributive effect instead of the DJA non-parametric technique.
Urban (2014) analyses an alternative decomposition of the redistributive effect that results from a tax-benefit system in order to demonstrate the effects of VE and HI. This research is based on the models in Kakwani (1984) and Lerman and Yitzhaki (1985); this empirical application to the Croatian fiscal subsystem shows that taxes and benefits considerably decrease income inequality. Furthermore, the author assessed different approaches that are used to measure the contribution of separate tax and benefit instruments to the vertical and horizontal effects of a fiscal system. Even though Urban (2014) considered his proposal as a unique/complete approach to decomposition, Duclos et al. (2003) had already proposed an ethical way to measure redistribution caused by a fiscal system, which integrated the two “rival” concepts of classical HI and reranking.
This study developed a new methodology to precisely decompose the redistributive effect by merging the well-known Gini coefficient and Atkinson indices. This allows the total redistributive effect of taxes and transfers to be decomposed into a VE effect, and there is a loss of redistribution due to either classical HI or reranking.
We now undertake a review of empirical studies for the Mexican case. We also provide examples of research relating to the concept of VE and HI, specifically Flores (2003) and Huesca and Serrano (2005). The former, shows how an increase in VAT on food and providing cash-transfers to the poor would improve revenues and reduce inequality; meanwhile, in the later, the authors assert that Mexican VAT contributes to VE. However, the redistributive effect is not completely effective due to high HI levels that are derived from VAT exemptions.
To the best of our knowledge, there are a few studies that use the DJA decomposition to measure the redistributive effect of the Mexican fiscal system into three components: VE, HI and reranking. Huesca and Araar (2014) applied the DJA approach to determine the redistributive effect of the tax system in 2012. They did this in different ways: a) from the point of view of tax-benefit system as a whole; b) from the point of view of the tax component; c) from the point of view of benefit component; and d) from the point of view of the benefit system through isolating the effect of a specific cash transfer. Results show that VE induced by the tax-benefit system is relatively important; however, its redistributive impact is reduced due to the high level of HI. Moreover, the Oportunidades benefit Programme had the highest redistributive effect as it provided the largest coverage for the deprived section of the Mexican population.
In addition, Huesca, Robles and Araar (2015) use the DJA model to determine the overall effect the tax-benefit system has on inequality by comparing the situation in 2012 with two simulated scenarios: a) applying the 2014 fiscal rules, and b) applying a 16 per cent VAT flat rate without exemptions. The changes that were made in the fiscal rules from 2012 to 2014 show a nil redistributive effect in the tax-benefit system, i.e., inequality levels from pre and post-fiscal income remained high; furthermore, the higher VAT rate in Mexican border states increased the levels of inequality in those areas compared with the rest of the country.
Vertical and horizontal inequity in the tax-benefit system (DJA model)
“Equals must be treated equally”: an ethical value that is easily defendable. Through using HI, we would like to show the extent of the unequal tax treatment of equals (those who have the same level of pre-fiscal income). Reranking (R) refers to the impact that change has on the pre-fiscal income rank of individuals as a result of the tax/benefit system. The term VE refers to the impact that a tax/bene-fit system has on inequality, where equals are treated equally. Duclos et al. (2003) proposed a method to decompose the redistribution effect and change in inequality into these three components. By using this application, we can decompose the difference between pre-fiscal income X and post-fiscal income N inequalities, as written in formula (1):

Where I (ε, ρ) is the Gini-Atkinson index, and ε and ρ are social aversion to inequality sensitivity parameters (Araar & Duclos, 2003). I N P is the coefficient of concentration of N when the ranking variable is X (p) and I N E is the concentration index of purged net income from local inequality (we assume that each individual has the expected value of post-fiscal income according to the level of his pre-fiscal income). Now, let us explain how each of the three components represents exactly what they are intended to assess: Firstly, the VE component (I X − I N E ) is the difference between the pre-fiscal and the concentration index of post-fiscal incomes when local inequality is removed.
Secondly, the HI component ( I N P − I N E ) enables the possibility of the non-existence of local inequality in post-fiscal incomes when I N P = I N E ; in this case, the HI will be nil. Alternatively, a growing gap will be a sign of greater inequality, which reverses the VE component in the total distribution. The more local inequality there is in post-fiscal incomes at percentile p, the lower the local social welfare is, which is established by ξ( N | X = Q(p)). However, the higher that is, the higher the component of HI is. Thirdly, due to the reranking (R) effect (I N − I N P ), given that the case where the rank based on pre-fiscal incomes is similar to the one based on post-fiscal incomes, we end up with I N = I N P ; the R component is, as a result, nil. The more R that there is, the lower I N P is. A higher R implies a deterioration in the post-fiscal position of the individuals and households that are part of the fiscal system. Non-parametric regression is used in order to capture those individuals who are equal in the distribution in order to estimate R2.
Two of the relevant features of the DJA technique are that it allows aggregate classical HI that is decomposable across groups to be undertaken, and it uses a non-parametric estimation (based on a local OLS estimation) of the joint density of pre and post-incomes to identify the “equals” within the contributors and bene-fit recipients (Duclos et al., 2003). This last feature allows us to work with the analysis without having to establish a functional relationship by determining the “equal” individuals3.
EMPIRICAL APPLICATION
In this section, we begin by describing the data and show how it is organised to be able to construct the fiscal system component of this research. We then analyse the empirical evidence using the DJA non-parametrical method to estimate the redistributive effect and the corresponding levels attached to HI and R. These have a negative effect on the total redistribution included in the VE component.
Microdata for México and construction of the fiscal system
For the empirical exercise, we use the Encuesta Nacional de Ingresos y Gastos de los Hogares (ENIGH) survey carried out by Instituto Nacional de Estadística (INEGI, 2015). This is the most recent data available and is comprised by a sample of 14,479 households and about 31.6 million of households expanded. Based on the microdata information provided, we proceed to build the distribution according to household equivalence units of income and following both direct identification methods and imputation methods when the sources could not be found in the survey (Lustig et al., 2014). We only used monetary units paid for taxes and cash transfers received within each household. Based on the ENIGH 2014 survey, direct taxes were imputed from 81 inputs of income, the indirect taxes were imputed from 732 consumption baskets of goods, social security payments were imputed from all the individuals’ social security systems, and the transfers are the sum of all public bene-fits included in ENIGH (9 as public transfers). We use a micro-accounting approach as no behaviour is considered to be at the micro (survey) level. In our case we do not consider this to be a major problem for our empirical results, an opinion that is clearly stated by Pudney and Sutherland (1994) and Bourguignon et al. (2008).
Based on personal disposable income, it is possible to calculate the figures shown in Table A.1 in the Appendix to rebuild the pre-fiscal income. When the vector on post-fiscal incomes is obtained after taxes in the survey, the current tax rules per source of income are applied. For direct taxes, we use the PIT of both wage earners and individuals who reported income sources as benefits obtained from business.
Similarly to conventional tax incidence analysis, we also assume that the burden of taxes relies on the last recipient of income. In order to rebuild the fiscal system from the post-fiscal income in the surveys, we consider the translation hypothesis for tax payments in Pechman (1985). Finally we grouped together the total income tax payments made by each household. In the case of indirect taxes, we calculated VAT and IEPS (special consumption tax) figures by using the corresponding tax rules and by using the place of purchase indicated in the survey for controlling informal activities. Furthermore, the place of purchase as the main control for informal VAT allows uncollected indirect taxes to be identified in the whole database4.
For benefits, we used direct methods as these can be collected on a household level from the survey. We do not consider transfers on a more aggregated level such as free or subsidized in-kind public services. This is because our purpose is to determine progressivity from the taxes paid and the well-known benefits received directly in cash by the households and not from funds entering as aggregate non-monetary sources. We used the following means-tested benefits: scholarships and cash transfers for education, the Prospera programme, the elderly programme (including 70 y más without a contributory pension); Programa de Apoyo Alimentario (PAL, programme for food assistance); transfer for temporary employment; and finally, other assistance programmes. At the end, pre-fiscal income represents the aggregation of the total taxes and federal contributions from wages and social security contributions minus pensions and the cash benefits received on a house-hold level:

Where X stands for the pre-fiscal income, N is the post-fiscal income, T is the tax burden, SSC is the social security contributions, P are the pensions and B are the benefits. There is no clear approach that considers pensions as a benefit component, at least the share of pensions added by the public sector. In our case, we treat pensions as Cook et al. (2013) and Lustig et al. (2014) did in their research. This research did not add retirement and pensions as means-tested transfers because of their contributive nature. We include the transfers related to pensions in the post-fiscal income figure as they are commonly estimated in the national accounts.
Unit of analysis and indicator of wellbeing
In order to account for wellbeing in the household and use equal units of distributive analysis, the simplest method would be to use per capita income or an equivalent scale. In our case, we use the equivalence scale from (CONEVAL, 2009b), which is defined as follows by the age ranges in brackets [0-5] = 0.7, [6-12] = 0.74, [13-18] = 0.71, and [19-65+] = 0.995.
General impact in the fiscal system: VE and HI: Appling DJA-
In order to determine the overall effect of the tax-benefit system on inequality and to show the different redistributive components, we use the DJA approach for the total Mexican fiscal system as well as for each fiscal instrument. Also, we estimated the following simulations (one at a time) to capture the isolated effect from a given tax-benefit: a) the redistributive effect from a specific tax: by simulating a fiscal system that used a particular tax (PIT, VAT or IEPS) as the total tax bur-den and then added the rest of cash transfers (see Table A2, from Appendix); b) the redistributive effect from specific benefits: by simulating a fiscal system that included the total tax burden but only one cash transfer at a time (see Table A3, from Appendix).
Before we proceed with the empirical application to compute redistributive effects, we have estimated pre and post fiscal equivalent incomes in order to be able to look at the feasibility of redistribution. At first sight, this provides both positive negative conclusions about the impact of the Mexican fiscal system.
The poverty lines separates Figure 1 into four areas. In panel A (lower-left area), households are more affected by redistribution, their post-fiscal incomes remain under the threshold and the cash transfers they receive are insufficient for them to leave out the poor group. In México, this group represented 53 per cent of the entire population (CONEVAL, 2016). Panel B (lower-right area) allows us to observe how the tax-benefit system prejudices non-poor households, pushing them to fall into poverty. In contrast, panel C (upper-left area) shows the households that have benefit from redistribution and therefore ceased to be poor. It is desirable that a higher number of households fall into this area than what is shown by the actual results. Finally, in panel D (upper-right area) the post fiscal position of households located above the 45° line reveals high levels of HI due to the Mexican tax-benefit system. Reranking levels can be observed when the post fiscal situation is below the 45° line.
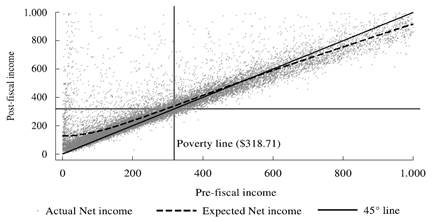
Source: Authors’ own based on a locally weighted regression with microdata from ENIGH, 2014.
Figure 1 Scattergram of pre and post-fiscal incomes, México 2014 (USD per month adjusted by PPP)
Simulations and results
In order to compare our results, we begin by briefly describing the characteristics of the Croatian and Slovenian fiscal systems. Both countries consider the pension system to be part of pre-fiscal incomes; the tax-structure consists of PIT, employers’ social contributions and employees’ social contributions; benefits are considered to be means-tested and non-means tested social transfers; and benefit programmes are different in the two countries (Cook et al., 2013)6.
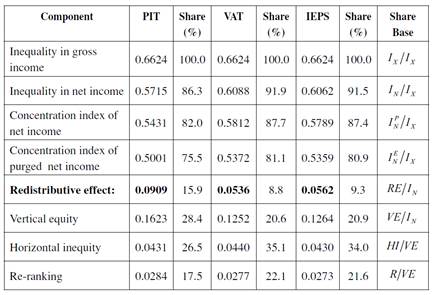
Table 1 presents the joint estimations for the fiscal system as a whole and captures the redistributive incidence from taxes and benefits. Comparisons among countries can be drawn by using the same parameters that the Gini-Atkinson index uses as moderate condition (ε = 0.5, ρ = 2). For instance, initial inequality was 0.428 in Slovenia and 0.467 in Croatia, while in México it reached 0.662, and redistribution was much greater in both countries than in México. As can be seen in Table 1, RE estimates were 10.10, 10.74 and 8.90, respectively. Remembering that RE is simply the change in inequality. It is equal to the VE minus the negative effects of the redistribution, which are the HI and the R. As we can remark from the results, in México, the VE is relatively high, and this shows the great redistributive effort in that country. However, this positive effect is significantly reduced by the two components HI and R. For instance, the component HI reduces the VE by 27.2 per cent, which is huge compared to other countries such as in Croatia and Slovenia (Cook et al., 2013). This shows the need of improving the redistributive programs to avoid the high horizontal inequity. This can be for instance, by improving the existing programs to better target the poor, or also, by simplifying that tax system.
Table 1 DJA decomposition of vertical and horizontal equity in the fiscal system.

Source: Authors’ own based on ENIGH 2014 and Cook et al. (2013, p. 676).
Table 2 presents the total Mexican taxation burden. Estimates reveal a positive but lower contribution to VE (4 per cent), a high level of HI (VE reduction) by about 24.6 per cent as well as a large amount of negative reranking (6 per cent) compared to that estimated for the benefits. Also, the positive redistributive effects are in part due to the benefits (6.9 VE points); the impact of HI is reduced to a lesser extent (14.9 per cent). Moreover, means-tested benefits contribute by reducing total inequality by 3.4 points, i.e., pre-fiscal and post-fiscal inequality index decreased from 0.6624 to 0.6276, respectively. As such, it may be appropriate to look for both the taxation and the benefit components in order to detect the transfer (or tax) that contributes (or not) the most to decreasing HI and reranking.
Table 2 DJA decomposition of vertical and horizontal equity by fiscal instrument, México 2014.
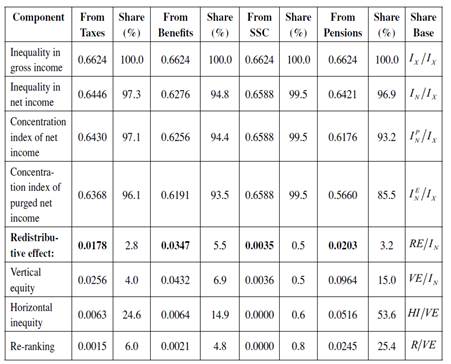
Source: Authors’ own using ENIGH 2014
It is possible to check how the fiscal figures do not account for a greater redistribution value compared to the other categories for both pensions and SSC. In Figure 1, the redistributive effect was roughly 2 percent, but DJA decomposition proved that the huge negative effect that was produced by the HI component; this accounted for more than 5 per cent. Also the reranking had a negative value of 2.4 points, and for the SSC case, the redistributive effect was nil. Figure 2 presents the general results for the DJA decomposition numbers.
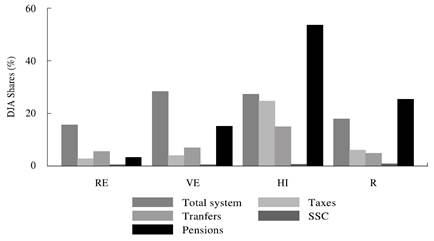
Source: Authors’ calculation based on ENIGH, 2014.
Figure 2 Decomposition of redistribution effect using DJA method.
Some evidences can be drawn starting from the results of Table 2. Mainly it can be shown that the HI and R are relatively high for the tax system. This can highlight the policy maker to prioritize the improvement of this redistributive tool. It can be noted here the high HI of the pension component is natural. This is because of that the pension program is in general not a universal program, but it is based in part on the contribution of the participants to that program.
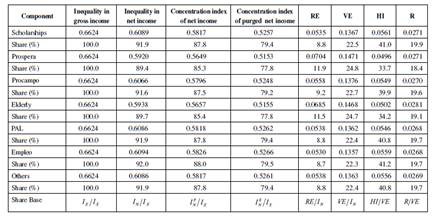
When running DJA simulations that isolate the effect for taxes, it can be seen that PIT possess the greatest redistribution effect as it decreases inequality by 9 points of its initial level and has a 0.5715 post-fiscal inequality index. Indirect taxes provide similar negative effects, ranging from 22 to 35.1 per cent of both R and HI contribution. However, those taxes have a lower vertical component, which decreases purged income inequality by about 20 per cent (See Table A2 in the Appendix).
Last but not least, the DJA decomposition, which is represented in Table A3 of the Appendix, shows that the benefits that are part of the Prospera and Elderly programmes have the highest redistributive effect: 7 and 6.8 points, respectively. Meanwhile, the others have lower effects in reducing disparities; they decrease inequality by 5 points.
The link between RE and its fiscal effort is explained in Table A3 of the Appendix. Two of the programmes with the highest budget from revenues are non-contributory pensions and the Prospera programme. Assuming that there is no HI and R, that is, both are set to zero, RE would be equal to VE. This means that inequality would increase by nearly 14 points instead of by nearly 7 points, as was estimated for both cases. In addition, in Figure 3 we estimated the conditional standard deviations for taxes and benefits using local non-parametric regression with an optimal window width. This enabled us to show the importance of local inequality for both fiscal figures and provide more insights into the reasons for the reversal on RE, regardless the fiscal effort.
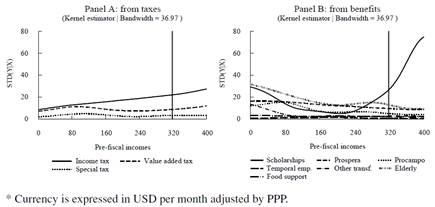
Source: Authors’ estimations based on ENIGH, 2014*.
Figure 3 Non-parametric regression from standard deviation of Mexican fiscal system in 2014.*
Vertical lines in both panels show the level of the official poverty thresholds; these are helpful to show the effect within the poor households compared to the next level of income households in the distribution. Among the reasons for the high level of HI are the two conventional error types of targeting, i.e., either when a poor household is excluded from the benefit programme -error type I- or when a benefit programme is misdirected and does not reach the poor population -error type II- (Cornia & Stew-art, 2003).
Panel A presents the incidence and deviation from the taxes in the lower part of the distribution. At the very bottom, P has the highest variability below the poverty line; meanwhile, VAT and IEPS present a more stable standard deviation of the poor’s income burden. Panel B, on the other hand, depicts the deviation for the benefits and it shows that the elderly, Procampo and Prospera programmes exhibit the highest deviation variability for the poor. This may result in targeting errors for each benefit and the other programmes remaining stable with a low dispersion among the beneficiaries. A special case that requires further analysis is the scholar-ship transfer. This is because benefit presents a greater variability after the vertical poverty line, which means that there is a higher dispersion for this public transfer among the non-poor distribution of households.
The previous analysis confirms the hypothesis stated in section 1. Although the Mexican fiscal system’s redistributive effect reduces inequality from 0.66 to 0.57, its levels from pre-fiscal to purged net incomes could be reduced from 0.66 to 0.50. However, high levels of HI and reranking reduce the potential VE effect. Furthermore, the redistributive effect from means-tested transfers is not sufficient enough to improve poor households’ situation. Since post fiscal levels of inequality remain high, the Mexican tax-benefit system must improve in order to produce a better redistributive effect.
CONCLUSIONS
This paper studies the redistributive effect of the tax-benefit system using the tax burden and direct cash-transfers in México. In general, the fiscal system in the country has a positive impact on reducing inequality by 8.9 points and uses a moderate sensitivity with the Gini-Atkinson index. However, the impact on inequality reduction is lower than that observed in transitional economy countries such as Croatia and Slovenia, where the same index was found to decrease inequality by 10 points. The Slovenian fiscal system leads to a greater impact on VE and has a greater redistributive effect.
In Latin America, Uruguay seems to be a special case where a significant inequality reduction has come from both taxes and benefits combined (Bucheli et al., 2014). Nevertheless, in México, our evidence shows a progressive fiscal system with poor results for fighting poverty and raising revenues.
This is due to several reasons, one of which is that capturing isolated effect of transfers received in a household, the full tax burden of which is on direct and indirect taxes, causes reranking, due to low effectiveness as a result of both coverage and reduced levels of the average cash transfer.
Based on the DJA model, we find that Prospera contributes the most (by 7 points) to RE, followed by the elderly programme (6.8 points). Prospera constitutes the most important social program in México, the RE results sustain the fact that it fairly targets the poor. However, for both cases, potential RE dissipates due to low coverage among the poor.
Combining the effect of taxes and benefits may not improve the post-fiscal situation as expected, but indeed to a lesser extent. The HI (27.2 per cent), which captures the non-equal treatment of the pre-fiscal situation, is equal (those that have practically the same pre-fiscal income but are treated unequally in the system), and the reranking component (about 17.8 per cent) captures the extent of imperfections in the non-synchronisation between the different fiscal interventions.
Benefits inadequately cover the poor, and thus it might be justified to provide them with more money through taxes: particularly through scholarships, which has the highest standard deviation as does the benefits for the elderly. As indirect taxes redistribute well, they can be improved as long as 35 per cent of HI reverses the VE component. This is due to the high amount of exemptions and zero rates on food and medicines, which differently subsidize the group of taxpayers in the income distribution.
For future research, we recommend analysing fiscal redistributive reforms for both direct and indirect taxes. This will serve to simultaneously increase taxable base and income redistribution, as well as to reduce the persistent HI within the Latin American Economies, particularly in México. Allocation of resources should be improved for the most progressive transfers’ programmes in order to strengthen government public services so that they have a greater coverage, and that the tax-burden and social welfare are improved. Also, it may be of interest to analyse the RE between countries by considering similar tax-benefit structures, and also to use counterfactual scenarios as a means of evaluating fiscal policies. Furthermore, for focused policy intervention, a disaggregated analysis of RE decomposition by population groups should be undertaken.