


 English (pdf)
 Article in xml format
 Article references
 Send this article by e-mail
 Cited by SciELO
  Cited by Google
  Similars in
SciELO
Similars in
SciELO  Similars in Google
 Permalink
INTRODUCTION
A large middle class plays a key role in economic development. Most importantly, it is associated with the absence of high inequality (Easterly, 2001), which has been shown to have negative economic effects (Bénabou, 1996; Herzer & Vollmer, 2012; Halter, Oechslin & Zweimüller, 2014; Ostry, Berg & Tsangarides, 2014; Dabla-Norris, Kochhar, Suphaphiphat, Ricka & Tsounta, 2015). The specific mechanisms that explain the positive effect of a middle class have been identified in the literature. According to Doepke and Zilibotti (2005, 2008) and Chun, Hasan, Rahman and Ulubaşoğlu (2017), the middle class tends to invest more in human capital and also save more. In addition, the middle class consumer has a preference for quality goods and is willing to pay more for them, thus encouraging firms’ reinvestment in the country (Murphy, Shleifer & Vishny, 1989). Finally, the middle class promotes social and political stability, and thus constitutes a key element for good governance and democracy (Birdsall, 2010; 2015).
Throughout the previous decades, there has been an explosion in the size of the middle class in the developing world (Ravallion, 2010; Milanovic, 2016). This has also been the case in Latin America: Ecuador in particular (Birdsall, 2012; Cárdenas, Kharas & Henao, 2015; Dayton-Johnson, 2015; Ferreira, Messina, Rigolini, López-Calva, Lugo & Vakis, 2013). In the period between 2005-2015, the population share of the middle class in Ecuador doubled from 18.58% to 37.40%. Because of its positive effects, the rise of the middle class in Ecuador over the last decade should provide a solid basis for a process of sustained political and economic development (Birdsall, 2012)1. We assess this premise by analysing the dynamics of four different social groups, based on income level: disadvantaged, vulnerable, middle, and upper. As expected, the rise of the middle class is closely associated with the other groups’ dynamics. Most importantly, during the last decade, the population share classified as disadvantaged has dropped to less than half (19.82% in 2015 compared to 46.25% in 2005).
The rise of the middle class in Ecuador can be explained by both economic growth and inequality reduction, although growth is responsible for almost 77.5% of the total change. These results are consistent with similar evidence for the Latin American region (see e.g. Ferreira et al., 2013; Azevedo, López-Calva, Lustig & Ortiz-Juárez, 2015). We also look at possible mechanisms that can help explain the rise of the middle class, particularly the evolution of the macroeconomic and labour market conditions associated with the recent commodities boom.
Based on the evidence that will be discussed in the following sections, we conclude that the rise of the Ecuadorian middle class is likely to be ephemeral as it was dependent on the oil boom and the specific dynamics that were in play during the period analysed. From 2005-2014, Ecuador had an average economic growth rate of 4.48% per year (Banco Central del Ecuador, 2016) and large reductions in inequality (the income-based Gini coefficient dropped from 0.55 to 0.47) as well as poverty (the income-based poverty rate fell from 42.2% to 22.5%) (SIISE, 2016). However, since 2015 these trends have come to a halt, and there are early signs of a reversal (Gachet, Grijalva, Ponce & Rodríguez, 2016). We argue that these changes pose a risk to the size of the middle class, which is an issue that will need to be addressed in the coming years. After undertaking the analysis, we conclude that a key social policy focus (e.g. a reduction in inequality or the promotion of the middle class) needs to be designed centring on the long-term, with an emphasis on sustainability. In Ecuador, the rise of the middle class may be reversed precisely because of the lack of a long-term perspective.
This paper makes four main contributions. First, we analyse the rise of the middle class in Ecuador year-by-year over the period 2005-20152. This is important because to the best of our knowledge no such detailed analysis has been conducted for a country in the region. Second, using the decomposition proposed by Datt and Ravallion (1992), we show the relative importance that growth and inequality reduction have had on the rise of the middle class in Ecuador. Third, using the decomposition by income source proposed by Lerman and Yitzhaki (1985) we also show that the rise of the middle class has been accompanied by a distortion in the shares of the sources of income. Finally, based on these analyses, we provide initial evidence that the rise of the middle class in Ecuador is coming to an end.
IDENTIFYING THE MIDDLE CLASS IN ECUADOR
There are several ways to identify the middle class based on, for example, education, occupation, asset ownership, or even a system of beliefs (e.g. support for democracy). We adopt an economic view and identify the middle class based on household per capita income, for which the literature has developed two perspectives. Some studies define the middle class based on the specific distribution of household per capita income, i.e. in relative terms. In this case, the income thresholds used to identify the middle class are determined in one of two ways: as an income interval around the median -for instance 0.75 to 1.25 times the median- (see e.g.Birdsall, Graham & Pettinato, 2000), or as the specific location in the distribution -for instance the second, third and fourth quintiles- (see e.g.Easterly, 2001).
The identification of the middle class based on relative income is subject to two main limitations. First, it precludes comparability across countries and over time regarding population shares. Second, in the case of analyses that define the middle class in terms of specific quintiles, the size of the middle class is fixed ex-ante, i.e. it does not vary by definition. Thus, the relative approach is appropriate to analyse the share of income accruing to the middle class; but it is not helpful when we are interested in analysing the share of the population belonging to the middle class.
In response to these issues, the second alternative to identify the middle class is based on specific income thresholds, i.e. in absolute terms. This is the same approach used to calculate income or consumption-based poverty using poverty lines. The income thresholds are specified in terms of standardized international dollars (PPP), which makes them comparable across countries and over time. Traditionally, however, these thresholds have been largely arbitrary3. To deal with this limitation, López-Calva and Ortiz-Juárez (2014) propose a definition of the middle class based on the likelihood of households falling into poverty. The idea is that a key characteristic of the middle class is economic security, which these authors interpret as a low likelihood of falling into poverty. More precisely, they identify the lower bound of the middle class as the level of income (in PPP) that is associated with at most a 10% probability of falling into poverty within a period of five years4. According to their definition, the middle class is composed by households with a per capita income of $10-$50 PPP (2005 international $) per day5.
The definition proposed by López-Calva and Ortiz-Juárez (2014) is appropriate for Ecuador for four reasons:
It explicitly distinguishes between the middle class and the vulnerable segment of the population. Vulnerability is understood as a larger-than-10% probability of falling into poverty. As previously mentioned, López-Calva and Ortiz-Juárez (2014) found that the per capita income threshold corresponding to this level of risk is around $10. This is important because a household does not automatically become part of the middle class by not being poor as the original papers in this literature assumed (see e.g. Banerjee & Duflo, 2008; Ravallion, 2010). On the contrary, a key aspect of the middle class -the ability to not indulge in gratification but instead invest in human capital and save- is inherently dependent on its ability to remain non-poor. López-Calva and Ortiz-Juárez (2014), thus, define this thresh-old as the lower boundary for the middle class on the grounds that a higher-than-10% probability of falling into poverty is not compatible with this notion of middle class.
It is designed specifically for the Latin American region where incomes are significantly higher than in the rest of the developing world, with the exception of Central Europe. Banerjee and Duflo (2008) and Ravallion (2010) set the lower bound for the global middle class at $2, and the upper bound at $10 and $13, respectively. If we apply these definitions to Ecuador over the 2005-2015 period, it turns out that the size of the middle class actually decreased (using the $10 upper bound) or increased only marginally (using the $13 upper bound). These results are counterintuitive given the high growth and inequality reduction rates throughout these years6. On to this point, it is important to note that López-Calva and Ortiz-Juárez (2014) use a $4 poverty line, which is a more meaningful standard for Latin America.
Ecuador’s PPP income levels and evolution are similar to those of Perú (see Figure 1). This is important because López-Calva and Ortiz-Juárez (2014)’s definition is based on panel datasets from Chile, México, and Perú, which are not necessarily similar to Ecuador. Because Ecuador does not have panel datasets that allow these thresholds to be directly calculated, our use of the thresholds proposed by López-Calva and Ortiz-Juárez (2014) need to be justified. Indeed, because the income distributions in Chile, México, and Perú are different from each other, and mobility is also different, the income threshold corresponding to a 10% probability of falling into poverty is $8.4 in Chile, $9.8 in México, and $9.6 in Perú7. While these differences are not large, it makes sense to compare Ecuador’s income levels and trends with these countries. In Figure 1 we show that Mexico and Chile have higher GDP per capita levels in PPP than Ecuador; however, Peru’s income is more similar. Furthermore, for the period analysed by López-Calva and Ortiz-Juárez (2001-2006), Ecuador actually had a higher GDP per capita in PPP than Perú. Additionally, the trends for all four countries appear similar over the 1990-2015 period.
Finally, adopting these thresholds allows for a direct comparison of the recent research regarding the middle class in Latin America. Several studies, including Ferreira, Messina, Rigolini, López-Calva, Lugo & Vakis, (2013) and Dayton-Johnson (2015) use the same definition in their analyses.
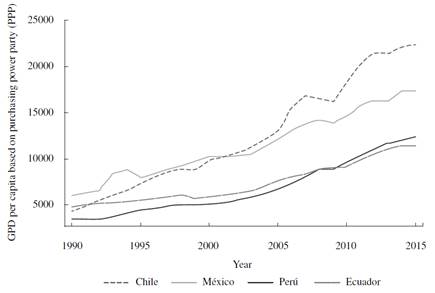
Source: World Bank, International Comparison Program database
Figure 1 GDP per capita PPP, various countries, 1990-2015
We classify Ecuador’s population into four groups: disadvantaged, vulnerable, middle class, and upper class. Households belong to the disadvantaged if they have an income per capita of less than $4 (PPP - 2005 international $) per day, the vulnerable if their income per capita is at least $4 and less than $10, the middle class if it is at least $10 and less than $50, and to the upper class if it is $50 or more.
THE RISE OF THE MIDDLE CLASS IN ECUADOR
Based on our definition of the middle class in Ecuador, in this section we discuss its evolution during the period 2005-2015. We contrast the middle class with the evolution of the disadvantaged and vulnerable groups -and to a lesser extent the rich- as its rise is intimately associated with the dynamics of these other groups. Our analysis is based on the December Ecuadorian employment surveys (ESs). These are national surveys carried out by the Ecuador’s National Institute of Statistic and Censuses (INEC)8.
Table 1 provides information on the disadvantaged, vulnerable, middle, and upper classes, including population and total income shares as well as other measures of income and relative income. Panels A and B provide evidence of the large changes that have taken place during the period analysed. Panel A shows that between 2005-2015 the population share of the lower class dropped more than 26 percentage points. Consistent with this decline, the share of the vulnerable class increased by almost seven percentage points and, most importantly, the middle class expanded by almost 19 percentage points - doubling its share. The upper class also increased, but only marginally, with an average of 1.61% population share over the period. Indeed, in 2015 the middle and upper classes comprised close to 40% of the Ecuadorian population, which is high by regional standards. Consistent with these changes, panel B shows that the share of income accruing to the middle class has also increased substantially from 45% in 2005 to almost 59% in 2015.
Table 1 Social groups and income, 2005-2015
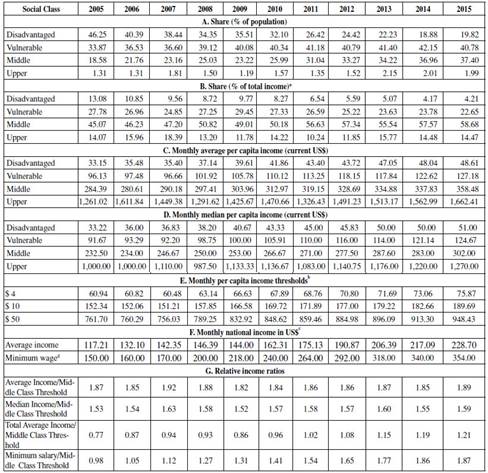
a The share of income is estimated by dividing the total weighted per capita income of each group by the total weighted per capita income in each year. b The thresholds are defined based on López-Calva and Ortiz-Juárez (2014) and converted using the purchasing power parity conversion factor. (World Bank, 2016). c Average income is estimated based on the ESs –various years; minimum wage is taken from SIISE (2016). d The minimum wage is the minimum salary set by the government at the beginning of each year.
Source: Authors’ estimations using Ecuador ESs - various years
To see how the income structure has changed over this period, refer to panels C and D. These provide evidence of the large increase in income (average and median) that has taken place. The group that benefited the most is the lower class, for which the average income in nominal terms rose by 47% over the period. Average income for the vulnerable and the rich increased by around 32%, and the group that benefited the least is the middle class, whose average income only increased by 26%.
Panel E presents the levels of nominal monthly per capita income corresponding to the $4, $10, and $50 (PPP 2005 international $) thresholds that define each social group9. Panel F presents aggregate average income and minimum wage over the period. Panel G uses this information to calculate measures of the relative income of each social group and of society in general. In the first part, we calculate the ratio of the middle class' median monthly per capita income (panel D) in comparison to the monthly per capita income that is required to be part of the middle class (i.e. the monthly per capita income corresponding to 2005 PPP $ 10, panel E). The ratio has increased over the period, thus providing further evidence of the improvement that has taken place throughout the last decade. In the second part, we calculate the ratios of the average per capita income and the minimum salary compared to the household per capita income required to be part of the middle class. These ratios show that the average income and the minimum salary have significantly increased relative to the income required to be part of the middle class. While in 2005 the average monthly income represented 0.77 of the middle class threshold and the minimum wage covered 0.98, by 2015 they covered 1.21 and 1.87, respectively. Thus, becoming part of the middle class has become significantly easier over the last decade.
IS THE RISE OF THE MIDDLE CLASS SUSTAINABLE?
The growth of Ecuador’s middle class over the last decade has been impressive and it has been associated with a widespread transformation in the economic structure of the country - as was discussed in the previous section. A logical question to ask is whether the rise of the middle class can be sustained once the economic conditions in Ecuador have changed following the end of the commodities boom. To shed light on this question, in this section we discuss three aspects associated with the dynamics of the middle class during the last decade. These highlight the challenge that Ecuador faces over the coming years. First, we briefly discuss economic and social trends: Ecuador has benefited from the commodities boom and, in particular, the rise in the price of oil. Second, and related to the previous point, Ecuador has enjoyed strong economic growth, which has been accompanied by large reductions in inequality and poverty as well as improvements in social indicators. Finally, these dynamics have been reflected in changes in the labour market, which we also analyse.
Consider first the context in which the rise of the middle class in Ecuador took place. Table 2 provides a brief summary of the main economic and social indicators in Ecuador during the last decade. Ecuador has experienced high rates of growth and strong declines in inequality. We can see, however, that growth has been associated with the rise of the price of oil (and other commodities). Between 2005 and 2013, the terms of trade grew by 31%, and between 2005 and 2011 the real price of oil more than doubled. But, in the same way that a rising oil price fueled growth during most of the period, large declines in 2009 and 2015 -which are also reflected as large falls in the terms of trade- had negative effects on growth. The rebound between 2010 and 2014 temporarily helped restore growth, but Ecuador’s macroeconomic and fiscal balances had already changed in 2009. Since that year, the trade balance has been negative and the non-financial public sector (NFPS) has experienced primary deficits. To some extent, these macroeconomic conditions have been compensated for by increasing internal and external debt as well as higher taxes. Despite this, prospects in the short-run are not encouraging.
Table 2 Economic and social indicators, 2005-2015
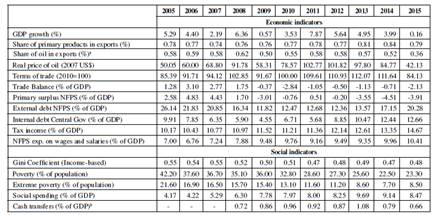
a Includes crude oil and oil products exports.
b There is no available information for cash transfers before 2008.
Source: Authors’ elaboration based on data from the Banco Central del Ecuador (2015, 2016) and ECLAC (2016).
The changing macroeconomic conditions do not seem to have had a large impact on social indicators up to 2013-2014. The only exception is inequality reduction, which was already stagnated after 2011. Post 2009, poverty and extreme poverty continued to fall following the trend from previous years, and social spending continued to increase. However, social spending and cash transfers reached a peak as a percentage of GDP in 2013; they have significantly declined ever since. Likewise, the falling trend in poverty and extreme poverty seems to have stopped in 2014.
The relevance of growth and inequality
The previous overview highlights some of the challenges that policy-makers in Ecuador will face over the next few years. To further understand the dynamics underlying the rise of the middle class and the limits of its sustainability, we will now look at the role of growth and inequality.
Table 3 shows the results from a decomposition of the effects that growth and inequality reduction have had on the changes in the disadvantaged, vulnerable, middle class, and upper class population shares during the period 2005-2015. The analysis is based on the methodology proposed by Datt and Ravallion (1992), which originally quantifies the relative contribution of growth and redistribution to changes in poverty (e.g. the headcount index). The decomposition separates the total variation in poverty into two components: growth and redistribution. The growth component is defined as the variation in poverty due to a change in mean income while the distribution of income is held constant at the initial level. The redistribution component is defined as the variation in poverty due to a change in the distribution while the mean income is kept constant at the initial level10.
Table 3 Growth and inequality decomposition by social group, 2005-2015
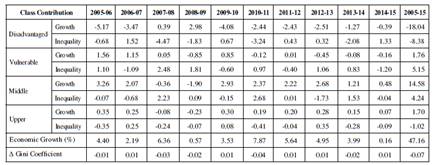
Source: Authors’ estimations based on ESs - various years
We adapt Datt and Ravallion’s methodology to be used for the four groups analysed in this paper. The decomposition shows how growth and redistribution contribute to the changes in the shares of each one of these groups both year-by-year and over the whole period. Table 3 conveniently repeats the growth rates over the period, and it also includes the changes in the income-based Gini coefficient. Growth and inequality have both contributed to the rise of the middle and vulnerable classes and to the drop in the number of disadvantaged people. Throughout the whole period, growth has contributed 77% to the expansion of the middle class and 68% to the fall in the number of disadvantaged. The increase of the vulnerable segment is much smaller and is explained mostly by the reduction in inequality (75%). Finally -consistent with intuition- growth contributes positively to the increase in the upper class while the reduction in inequality contributes negatively.
As mentioned above, the rise of the middle class is mirrored by the fall in the share of the disadvantaged. The annual contributions of growth and inequality reductions presented in Table 3 provide evidence consistent with this idea. In general, higher growth and larger reductions in inequality are associated with increases in the middle class and reductions in the share of the disadvantaged. This is particularly clear in the case of inequality. Its largest contributions to the rise of the middle class and the fall in the number of disadvantaged occurred in the three years in which inequality dropped the most (2008, 2011, and 2014). For most years, this is also the case with growth. The only exception is 2008, when a 6.36% growth rate was associated with a small decline in the share of the middle class and a small increase in the share of the disadvantaged.
What can be expected in the following years? As shown in Table 3, growth and inequality both played an important role in the rise of the middle class (and the fall in the share of the disadvantaged), which was observed in Ecuador over the previous decade. However, these changes seem to be coming to an end. On the one hand, since 2011 inequality has had a negative (-0.23 percentage points) contribution to the share of the middle class, and its contribution to the share of the disadvantaged has been exactly 0. On the other hand, since 2011 growth has contributed 6.59 percentage points to the increase in the share of the middle class and 6.60 percentage points to the reduction of the share of the disadvantaged. These changes correspond to 51% and 37% of the change for the whole period (2005-2015). This means that more than half of the rise of the middle class in Ecuador was due to growth in the last four years and that inequality ceased to contribute in 2011. There is no reason to expect inequality to decline in the short-term, and Ecuador grew by -1.5% in 2016 (Banco Central del Ecuador, 2017). As a consequence, we believe that in the next couple of years the shares of the middle class and the disadvantaged will remain constant or even show a reversal. The beginning of 2015 already showed a small increase in the share of the disadvantaged (see Table 1).
Labour market dynamics
To further understand the dynamics portrayed in the previous sections, we now turn to an analysis of the labour market. There are several mechanisms that may have contributed to the rise of the middle class. First, a common argument that explains the reduction in inequality -and also the expansion of the middle class- in Latin America over the last decade is that a previous education drive should have reduced the earnings gap between skilled and unskilled workers (Lustig & López-Calva, 2010; Lustig, López-Calva & Ortiz-Juárez, 2013; Ponce & Vos, 2014). For the case of Ecuador, Gachet et al. (2016) find that, while the share of skilled and unskilled workers remained constant during the period, the income of skilled relative to unskilled workers did indeed fall. The ratio of skilled to unskilled average income fell from 2.84 in 2005 to a minimum of 2.22 in 2011; in 2015 it was 2.42. Likewise, the ratio of median income fell from 2.90 in 2005 to a minimum of 2.17 in 2014; in 2015 it was 2.31 (see Table 7 in Gachet et al., 2016).
Second, an additional mechanism that may have also contributed to the rise of the middle class is the expansion of public employment and the rise of the minimum wage. Gachet et al. (2016) find that between 2005 and 2015 public employment in Ecuador increased by 29%, corresponding to 2.34 percentage points. The ratio of average public to private income remained relatively constant at around 2.08 (see Table 7 in Gachet et al., 2016). Additionally, as shown in Table 1, in this period the minimum wage increased 1.36 times in nominal terms.
Finally, a key element that may have contributed to the rise of the middle class is government transfers in the form of either cash transfers or social security and retirement pensions. There has been a cash transfer programme in Ecuador since 1998, which is currently called the “Bono de Desarrollo Humano (BDH)”. Until 2005, the monthly grant was US$ 15, but it was raised to US$ 30 in 2007, US$ 35 in 2009 and finally to US$ 50 in 2013. In addition, in 2007 the grant was unified for all beneficiaries, and the number of beneficiaries increased significantly until 2013, since when the number of beneficiaries has been reduced. Regarding social security and pensions, the government has also increased the amount paid as well as the number of beneficiaries.
To analyse how these changes have affected households’ income, in Table 4 we present the results of a decomposition of income inequality by source for the disadvantaged, vulnerable and middle class groups. We separate sources of income into labour, capital, remittances, cash transfers, and other sources. The last category includes social security benefits, retirement pensions, and donations and gifts.
Table 4 Income source decomposition by group a, 2005-2015
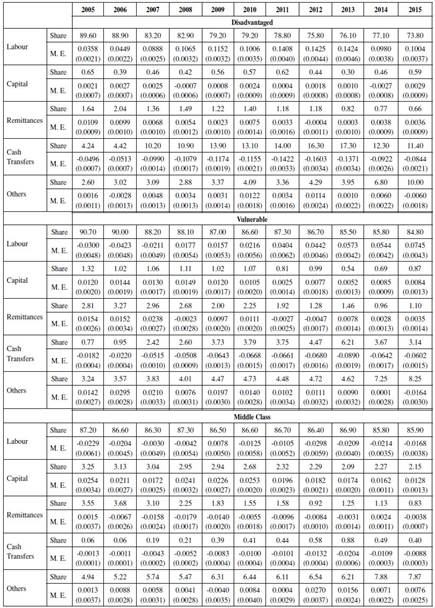
a The standard error of the estimate is shown in parenthesis. M. E.: means marginal effect.
Source: Authors’ estimation based on ESs - various years
Social security benefits and retirement pensions constitute the majority of this category.
The decomposition is taken from Lerman and Yitzhaki (1985)), which allows the sources of income to be separated based on their shares, and then each source’s marginal effect on inequality can be estimated11. For this paper, because of the separation of social groups, the marginal effect refers to inequality within each group.
We first consider the shares of each source of income; in all cases the most important source is labour. This represents 84.8% or more for the vulnerable and the middle class throughout the period. However, it tends to be lower for the disadvantaged, reaching a minimum of 73.8% in 2015. For all cases, the share of labour income fell between 2005-2015. But, while this reduction is 1.3 percentage points for the middle class and just under six percentage points for the vulnerable, in the case of the disadvantaged it is almost 16 percentage points. A large part of this change is associated with the dynamic that other sources of income play, particularly cash transfers and others. Let us first consider cash transfers: this is the second largest source of income for the disadvantaged and it has increased significantly over the period. At its peak in 2013, it represented 17.3% of their income. Since then, it has fallen almost six percentage points, but it still represented 11.4% of the disadvantaged’s total income in 2015. The third main source of income for the disadvantaged is others, which include mainly social security benefits and retirement pensions. These benefits did not vary significantly up to 2013, representing between 3 and 4% of total income. However, by 2015 they constituted 10% of total income. These changes, while expected given the large movement out of the disadvantaged group, highlight the potential financial pressures on the public sector if households from other social classes fall back into that group.
For the vulnerable and the middle class, other sources represent the second largest share of income. As in the case of the disadvantaged, this share has expanded over the period, representing around 8% in 2015 for both groups. This figure has increased from 3% in 2005 for the former group and 5% for the latter. Cash transfers are the third largest source of income for the vulnerable, and they reached a peak of 6.21% in 2013, falling back to 3.14% in 2015. For the middle class, cash transfers play a minor role, representing less than 1% of total income throughout the period.
Remittances are also an important source of income; they are the third largest for the vulnerable (1-3%) and the middle class (1-3.5%). Yet, their share has fallen for all groups following the 2008 financial crisis, and it currently represents around 1% for the vulnerable and less than that for the middle class and the disadvantaged. Finally, regarding capital income, as expected, the middle class has the largest share (2-3%) although it has decreased somewhat over the period. For the vulnerable the share is around 1% and it is 0.5% for the disadvantaged.
We now consider the effects of inequality from each source. First, regarding labour income, it is notable that this contributes to reducing inequality among the middle class; however, for the vulnerable (since 2008) and the disadvantaged it actually contributes to increasing inequality. Furthermore, the magnitude of these effects among the latter groups is much larger, and it has increased over time. For instance, in 2015 among the disadvantaged a 1% increase in labour income was associated with a 10% increase in the Gini coefficient within the group.
Capital income promotes inequality in almost every case, but it does not have a great effect. Remittances have an equalizing effect on the middle class, but they tend to increase inequality among the vulnerable and the disadvantaged. Cash transfers have an equalizing effect for all groups, but the magnitude of the effect is particularly large for the disadvantaged and the vulnerable. However, this effect has declined since We use the stata code developed by López-Feldman (2006) 2014 following the changes to the “human development bond” programme in 2013. Finally, other sources of income have contributed to increasing inequality in most cases, but the effect is small.
There are two conclusions following this brief analysis. First, income has become more dependent on governmental sources (cash transfers and others) for all groups analysed in this section (disadvantaged, vulnerable and middle class). We have already mentioned the case of the disadvantaged for whom these sources represented more than 21% of total income in 2015 - up from 7% in 2005. To reiterate, this is in part due to relatively richer households moving out of this group. However, the shift away from labour income also occurs among the vulnerable and the middle class. For the former, income from these two sources rose from 4% in 2005 to 11.39% in 2015 while for the latter it went from 5% to 8.27%.
The second conclusion is that the shift away from labour income towards cash transfers and other sources of income (mostly social security benefits and retirement pensions) has contributed to the reduction in inequality. Recall that the marginal effect of labour income among the disadvantaged and the vulnerable is positive and large, and therefore promotes inequality. Thus, a reduction in its share in favour of other sources of income contributes to a reduction in inequality. This is very clear in the case of cash transfers as their marginal effect is negative. But, even in the case of other sources of income, this is also true. This follows because their effect on inequality, which, positive, is much smaller than the effect of labour income.
The main problem with these changes is that, considering the current fiscal challenges faced by the Ecuadorian Government (see Table 2), it is unlikely that it will be able to provide such high levels of resources in the future.
To conclude, there is evidence that the skilled premium has fallen over recent years, which is consistent with the literature on the Latin American region. This is a welcome fact for inequality reduction as it represents a structural change that may continue in the following years given the large investment in public education. However, there are important mechanisms that have contributed to the rise of the middle class that are unlikely to continue in the future. Increased public employment is one such factor. The other important element has been the shift from labour income to cash transfers and other sources of income. While these help reduce inequality, they consume public resources that have become much more scarce since the end of the commodities boom. On the aggregate level, growth and inequality have contributed to the rise of the middle class. However, inequality has stopped contributing since 2011 and it seems unlikely that it will start to do so once again. Likewise, the slowdown of the Ecuadorian economy means that growth will fail to continue fueling the rise of the middle class in the short-term. Thus, we believe that the next few years will pose serious challenges to the middle class’ sustainability.
CONCLUSION
In this paper we provide evidence of the rise of the middle class in Ecuador throughout the past decade. Since 2005, its population share doubled, reaching 37.40% in 2015. We showed that this increment is associated with the fall in the population share of the disadvantaged, which decreased by more than 26 percentage points, and was, more generally, due to a broader change in the structure of the social classes in Ecuador.
During this period, Ecuador enjoyed a high rate of economic growth as well as a significant reduction in inequality and poverty. This has been a consequence of both the commodities boom and the government’s policies. Both growth and redistribution have contributed to the rise of the middle class, but growth contributed over three quarters of the total. In our view, the main challenge with the rise of the middle class is that it was the result of a growth process that was destined to end. Similarly, the redistribution policies that contributed to a reduction in inequality -and thus to the rise of the middle class- were dependent on the abundance of resources. During this period, the different social groups’ income has shifted from labour income to other sources of income: mainly cash transfers and social security benefits and retirement pensions. However, while these mechanisms helped reduce inequality, they also imposed additional pressure on public finances, which, following the 2008 financial crises, have shown signs of deterioration as there are large financing needs and an increasing internal and external debt. The extreme dependency that governmental policies have on growth means that its slowdown will also have negative consequences for the reduction of inequality, and thus for the middle class.
As growth turns into contraction following the end of the commodities boom and inequality starts to increase, Ecuador’s middle class will likely shrink over the next few years. We do not foresee a return to 2005 levels, but even a small reduction in the share of the middle class will pose serious challenges to politicians and economic policy makers. As Fukuyama (2012) and Birdsall (2015) argue, the rise of middle classes around the world provides a strong foundation for democracy. Conversely, based on recent experience in developed countries, Fukuyama (2012) argues that the decline in the middle class poses a threat to liberal democracy. From this perspective, a decline in the middle class, along with Ecuador’s weak institutions, provides a fertile ground for the emergence of populist and/or illiberal leaders. Indeed, Ecuador’s case is particularly problematic because the rise of the middle class in the last decade was not associated with a consolidation of liberal democracy but with a weakening thereof (Andrango, Grijalva & Romero, 2016; Gachet, Grijalva, Ponce & Rodríguez, 2016; Conaghan, 2016).
Despite the challenges ahead, it is important to note that the reduction in inequality and the rise of the middle class that took place in Ecuador are remarkable. As argued by Ross (2007) and Ross, Lujala and Rustad (2012), within the context of a natural resource boom, politicians have an incentive to direct the revenues for the purpose of their own benefit. The reduction in inequality is an encouraging sign showing that politicians have, at least in part, resisted the temptation of concentrating the windfalls from oil. Maybe, at least in the short-term, the still fresh experience of the 1999 crisis and the significant political instability of the 1997-2006 period imposed an implicit check on politicians, who became more conscious of the need to respond to the electorate. But, as we have shown in this paper, this does not seem enough to sustain the rise of the middle class.
The question then becomes how to deal with the economic slowdown and the associated fall in the middle class within a context of limited democracy. The only sensible way to address this question seems to be to restore Ecuador’s weakened institutions so that the next boom may give rise to policies that are more sustain-able and more likely to provide a strong foundation for a stable middle class.

