Inglés (pdf)
 Articulo en XML
 Referencias del artículo
 Enviar articulo por email
 Citado por SciELO
  Citado por Google
  Similares en
SciELO
Similares en
SciELO  Similares en Google
 Permalink
INTRODUCTION
The incorporation of new EU countries at the beginning of the 21st century has broken the equilibrium that existed between the Core and the Mediterranean economies. This process has created a new scenario in which transition economies have attracted an increasing amount of intra-European FDI flow, which facilitates firm entry. Based on this scenario, this paper analyses the drivers of innovation activities and the factors that promote the appearance of High-Growth Firms (henceforth HGFs) in thirteen EU members. We observe that the different business conditions in EU countries increases the heterogeneity on a country level. One of the main reasons for this is that factors which may act as an incentive for the emergence of HGFs in some developing countries may become a barrier in others.
R&D and innovation activity is one potentially positive factor that may boost a firm’s growth. Direct and positive links between R&D, innovation, and productivity play a crucial role in developed countries (Mohnen, Mairesse, & Dagenais, 2006) while in developing countries the situation is more complex and heterogeneous. In the latter, firms find it difficult to build innovative networks in which information and knowledge help them to invest in R&D (Raffo, Lhuillery, & Miotti, 2008)1.
The relative position of each country, institutional quality and the technological context affect the HGFs’ growth capacity and their ability to invest in R&D activities (Hölzl, 2009). Recently, Daunfeldt, Elert and Johansson (2016), Krasniqi and Desai (2016) and Brown, Mawson and Mason (2017) have noted that these conditions are important for all countries, and they may cause non-homogenous impacts of R&D on firm growth2. This has been relevant since the promotion of R&D and innovation to foster HGFs and the development of a better manufacturing structure have become key issues in the current European objectives.
In this paper, we analyse the impact of innovation outputs on the likelihood of manufacturing firms becoming HGFs. We consider that the effect of innovation on firm growth differs between countries according to the macro conditions of each country and their distance with respect to the technological frontier.
To carry out our empirical analysis, we use a detailed dataset from the Community Innovation Survey (henceforth CIS), provided by Eurostat, covering the period 2008-2010 for thirteen European countries. Furthermore, we classify the EU countries into three clusters: Core countries, Mediterranean countries, and New EU countries. According to the characteristics of the data, we have applied a biprobit model to calibrate the effects that technological (product and process innovations) and non-technological (organizational and marketing innovations) innovations have on the capacity of European firms to become HGFs. This allows us to control for unobserved characteristics that may potentially and simultaneously affect whether a firm becomes a manufacturing HGF, in addition to its capacity to innovate.
Our main results suggest that technological innovations increase the probability of becoming an HGF for a Core country while non-technological innovations are a key determinant for Mediterranean countries. Conversely, with respect to manufacturing firms in New EU Member countries, the more crucial variables are those closely related to firm characteristics and their internationalization. Hence, our paper sheds light on how the context where a firm operates may determine its capacity to grow and become an HGF. This approach is particularly of interest in the EU, where the incorporation of New EU members has considerably increased the heterogeneity among sectors and countries.
Our main contributions are the following: Firstly, we show evidence of the linkages between R&D and innovation and the probability of becoming an HGF for a group of New EU members. Secondly, our results shed light on how the higher intensity of manufacturing industries in New EU member countries has increased the presence of HGFs there. Finally, our results offer information on the key role that the transference of knowledge and innovation play so that manufacturing firms can become HGFs in those countries that have more robust Innovation Systems.
The paper is organized as follows: The second section, based on each country’s characteristics, describes the literature on firm growth and the different role innovation plays. The third section presents the database and the main statistics. The fourth section explains the econometric methodology. Finally, the paper concludes with the main results and the resulting policy implications.
LITERATURE REVIEW
High-growth firms and innovation
Since Birch’s (1979) seminal work, economists and policy-makers have paid considerable attention to HGFs3. Firms’ innovative effort is key among the many factors analysed in the literature on firm growth (see Audretsch, Segarra-Blasco, & Teruel, 2014). According to the Schumpeterian theory of creative destruction, HGFs are created by entrepreneurs who can cope with market opportunities, develop their ideas, and transform them into innovations that will result in the rapid growth. Their capacity to generate new jobs and exploit their competitive advantages represents a shake-out in the market distribution. Analysing the relationship between innovation and firm growth is of particular interest since HGFs that innovate face higher risks (Coad & Rao, 2010).
Firms’ innovative performance promotes the development of their internal capabilities and this is a key factor in consolidating their market position. In a similar vein, Mason and Brown (2013) and Brown and Mawson (2016) highlight the importance of promoting “dynamic capabilities” rather than resource acquisition. Hence, it seems that innovative behaviour may be key to generating and fostering HGFs. Consequently, we might expect policy-makers to emphasize the generation of those “dynamic capabilities”, which will lead firms to adapt and grow rapidly4.
It is unclear how, or even whether, firms’ innovative capabilities directly impact their growth. This issue is even less clear when we observe HGFs. Early papers (Geroski & Machin, 1992; Storey, 1994) found a positive relationship between innovating firms and fast growth rates, but Smallbone, Leig, and North (1995) demonstrate that product management and market development are the factors that most consistently distinguish HGFs from other firms. More recently, Cucculelli and Ermini (2012) found product innovation had a positive impact on sales growth while Colombelli, Haned, and Le Bas (2013) show an unambiguous positive association between product, process, and organizational innovation and sales growth5. Hence, R&D and innovation performance are expected to have positive effects on a firm’s growth; its innovation output, which reinforces its market position and; consequently, increasing its sales and expanding the labour force required for new production. Secondly, innovative performance potentially has no impact when new products or processes substitute the previous ones without having been changed.
Finally, new processes or non-technological innovations may have a negative impact on firm growth. For instance, innovations may entail adjustment costs or even reduce the number of workers (for example, the substitution of the labour force with machinery). However, even in this case, the long-term impact may be positive if there is an increase in productivity and a fall in price, which results in an increase in demand. These results are in line with the negative impact that innovation activity has on the lower quantiles growth distribution (Coad & Rao, 2008; Coad, Segarra, & Teruel, 2016; Segarra-Blasco & Teruel, 2014).
Heterogeneity at country level
In general, previous analyses of the determinants of a firm’s HGF propensity have focused on individual countries. However, countries differ in terms of their market structure and institutional framework; consequently, innovation may play different roles in the generation of HGFs. However, there has not been much work undertaken that analyses cross-country behaviour (Brown et al., 2017); the most out-standing exceptions come from Bravo-Biosca (2010, 2011), Bravo-Biosca, Criscuolo and Menon (2016), Hölzl (2009), Krasniqi and Desai (2016), Navaretti, Castellani and Pieri (2014), Schreyer (2000), Segarra-Blasco, Teruel-Carrizosa, and Jové-Llopis, (2016), and Teruel and de Wit (2017).
Schreyer (2000) analysed the behaviour of HGFs for OECD countries at industry level in the 1980s and 1990s. His results show that HGFs are more R&D intensive. Bravo-Biosca (2010, 2011) analysed the industrial behaviour of twelve OECD countries between 2002 and 2005. His focus is on the relationship between total factor productivity (TFP) growth and the growth distribution. He finds that countries with a larger share of firms that remain static show lower productivity growth.
Meanwhile, Teruel and de Wit (2017) explore data from seventeen OECD countries between 1999 and 2005. These authors focus on the incidence of macroeconomic determinants from three driving forces behind high growth: entrepreneurship, institutional settings, and opportunities for growth. Hölzl (2009) explores data from sixteen countries during the period 1998-2000. He finds that HGFs exhibit a greater R&D intensity than non-HGFs in countries closer to the technological frontier. Similarly, Segarra-Blasco et al., (2016) analyse the effect innovation has on the capacity to become an HGF using CIS microdata covering the 2006-2008 period for fifteen European countries that was provided by Eurostat. They examine HGFs in countries that invest heavily in R&D in comparison with those with a lower level and found that drivers to innovate and become an HGF differ across EU member countries. In leader countries, HGFs are related to R&D and innovation, whereas in laggard countries HGFs depend on firms’ characteristics and market dynamics.
Similarly, for a sample of French, Italian, and Spanish manufacturing firms with more than ten employees in the period from 2001 to 2008, Navaretti et al., (2014) found that in HGFs the number of employees in R&D activities and graduates is positively correlated with firm growth in upper quantiles. Hence, their evidence supports the thesis that HGFs will be positively affected by their innovation capabilities. More in line with our analysis but using macroeconomic data for 26 transitional countries between 1998 and 2009, Krasniqi and Desai (2016) highlight the influence that formal and informal institutions have on the share of HGFs. Their results also highlight the importance of the velocity of transition and the influence of these institutional factors.
From a complementary perspective, Bravo-Biosca et al., (2016) examine the impact of employment protection legislation and financial institutions on firm growth dynamics using a recently-developed database that captures the full distribution of firm growth rates across several countries (the United States, Canada, and eight European countries: Austria, Denmark, Finland, Italy, the Netherlands, Norway, Spain and the United Kingdom). Their empirical analysis shows that both employment protection legislation and financial institutions have a heterogeneous impact across the distribution of firm growth, and therefore, have an impact on the speed of the resource reallocation process. Finally, from a set of African countries, Goedhuys and Sleuwaegen (2010) analyse the growth performance of a large set of entrepreneurial firms and the determinants of HGFs in eleven Sub-Saharan African countries with a sample of firm-level data collected by the World Bank Investment Climate Survey. They found that public intervention should aim to raise capabilities through an improved educational system that upgrades the skills of both the entrepreneurs and the labour force.
Although the relationship between innovation and HGFs has been examined for countries that have been integrated into the EU for some time, this evidence does not exist for new members. Following the classification adopted by Hölzl (2009), we have distributed the thirteen European countries included in our dataset into three groups that present different levels of technological development: Core countries, Mediterranean countries, and New EU countries6.
Recent empirical studies have found that the institutional and technological contexts in which European firms operate affect not only HGFs’ growth capacity but also their capacity to invest in R&D activities. Hölzl’s (2009) findings support the importance of a country’s technological development so that R&D has an incidence on HGFs. His results point out that, in technologically developed countries, HGFs are more R&D intensive that non-HGFs. Firm’s incentives to invest in R&D and the innovation outcomes vary widely among countries. In developing countries, firms have fewer incentives to invest in R&D since the risk is higher, and the returns appear only after long periods. In these countries, innovative firms invest less in R&D and are more prone to invest in technological development. They also acquire machinery and imitate rather than innovate. More frequently, firms in less developed countries introduce more incremental innovations and register fewer patents. On the macroeconomic level, Krasniqi and Desai (2016) found evidence of the positive influence innovation has on the existence of HGFs in various countries.
The incorporation of New EU members
Over the last two decades, the Eastern European emerging and transition economies have experienced an important structural change. However, the starting point of the Eastern economies is diverse. Before the transition period, the Czech Republic was already R&D oriented, Hungary and Poland had a high share of R&D, and Hungary was technologically open (Radosevic & Auriol, 1999).
The transition process from the post-socialist period to EU institutional rules has been complex and difficult, especially on the institutional level. One key institution to foster innovation capabilities and the capacity to grow is the Innovation System. Individual companies, domestic businesses, and sectoral determinants primarily drive the Innovation Systems of these New EU countries. As Radosevic (1999) remarks, the innovation patterns at firm and sector level are diverse. Additionally, the links between firms’ innovation patterns and Innovation Systems are weak and differ between sectors and countries. Hence, the transition that these New EU countries have experienced is a discontinuous process which may affect the capacity of their economies, in terms of innovation, to catch up with the developed economies.
Foreign direct investment (FDI) is a potential booster of the Innovation System in new countries. For a panel of sixteen Eastern European transition countries, Krammer (2009) found that the globalization and the integration of the EU highly facilitate the development of innovations through FDI inflows and trade. In this sense, the slow removal of trade barriers, reduction of bureaucracy, and advances in governance decreased transaction costs, which facilitated the inflow of FDI.
These countries need to develop the broad range of institutions and policies that are necessary to create conditions for favourable economic growth to catch up with more developed economies (Globerman & Shapiro, 2002). In this sense, inadequate bureaucracy is a deterrent to foreign investors as increased transaction costs adversely affect the profitability of investment projects. Bevan and Estrin (2004), using panel data on bilateral flows of FDI between 1994 and 2000, observe that the most important influences on the FDI flows from EU countries to New EU members are unit labour costs, market size, and proximity; the host country risk is a not significant determinant.
In general, Eastern European countries that have a large market, good infrastructure, transparent institutions, and an educated labour force are more likely to receive more FDI from traditional EU countries in the tradable sectors (Globerman & Shapiro, 2002; Kinoshita, 2011).
According to Bevan and Estrin (2004), countries that have successfully implemented transition policies have been promised a relatively speedy EU membership, which further accelerates FDI and, in turn, generates more growth and development. In contrast, countries that were less successful in implementing transition policies attracted fewer FDI inflows from EU members. Despite the growth of FDI inflows to the New EU members, the empirical evidence shows that, during in the 1990s, there was a clear negative impact on the amounts of FDI inflows received by traditional European countries (Brenton, Di Mauro, & Lücke, 1999).
Furthermore, the incorporation of New EU members has led to the relocation of parts of their production chain from the Mediterranean countries to new European countries. This relocation has produced negative effects on production and employment growth in Mediterranean countries, especially for the services sec-tor and in their most traditional industries. The impact has not been positive for employment in technologically intensive manufacturing industries and business services (Savona & Schiattarella, 2004). In fact, this relocation process has caused, according to Pianta, Lucchese and Nascia (2016), Mediterranean countries to have very few leading firms in global markets. They have also experienced a continuing loss of ownership of major firms to foreign investors.
Table 1 shows data on how New EU members have had a greater capacity to transform their manufacturing activities and to preserve higher levels of industrialization than other EU countries. In the EU, the share of manufacturing value added has decreased nearly five points in the Core countries, the Mediterranean countries, and the New EU members. The cluster of New EU members has had to go through a major adjustment process but, nonetheless, the share of the manufacturing activities is still larger than in the other countries.
Table 1 Manufacturing Share and High-Tech Exports in European Countries. 1995-2015.
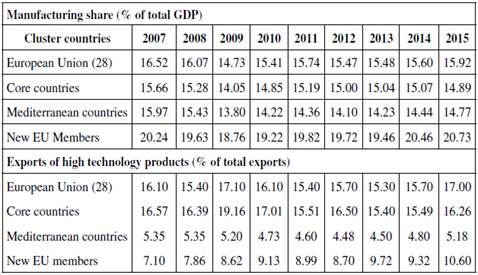
Note: Core countries include Belgium, Denmark, Germany, France, Luxembourg, the Netherlands and the UK; Mediterranean countries include Greece, Italy, Portugal and Spain; and New EU countries include Bulgaria, the Czech Republic, Estonia, Croatia, Cyprus, Latvia, Lithuania, Poland, Romania, Slovenia and Slovakia.
Source: Eurostat.
Since the 1980s the importance of the manufacturing industry has considerably declined. The impact of the current recession has exacerbated this situation. Within this context, the EU’s goal to increase manufacturing shares to 20% of GDP by 2020 should be a main objective in terms of European countries’ industrial policy. However, according to the dynamics registered over recent years, this objective often appears to be unattainable.
Table 1 presents the development of high technology exports. The data is explicit. While in the Core countries, the importance of technology-intensive exports remains stable, for the New Members, high-tech exports have increased to a level of ten per cent of total exports, and for the Mediterranean countries, these exports remain at a moderate percentage that barely exceeds five percent. This evidence highlights those asymmetries that have occurred since the recession in the European Union.
The slowdown experienced by European manufacturing industries has not similarly affected all countries in the European Union. Furthermore, these differences have increased in European economies with the incorporation of the emerging and transition economies in Central and Eastern Europe into the European Union. During this process of an increasing openness towards Eastern European countries, the traditional equilibria among the economies that form the Core and the Mediterranean countries has shifted considerably.
This trend poses a challenge for the EU. Therefore, analysing the occurrence of HGFs in the manufacturing sector may be interesting, especially when we undertake a comparison between the Core, the Mediterranean countries, and the new EU members. We assume that firms in more advanced countries are more closely related with R&D investment and the innovative activity of the firm while firm specific characteristics and institutional framework will be key for the appearance of HGFs in New European countries. The Mediterranean countries are suffering from the constraints of the current crisis and their lack of innovative capabilities.
THE DATABASE AND SOME DESCRIPTIVE STATISTICS
Database
Following the guidelines set out in the Oslo Manual developed by the OECD -Eurostat (2005), several countries have designed a common questionnaire, the CIS, for firms’ innovation activities. CIS surveys are carried out every two years by EU member states as well as several other non-EU countries (e.g. Norway, Iceland). Hence, the CIS facilitates access to a range of information related to how European firms innovate. Since the data are only available for a limited set of EU members’ states, scholars must focus their work on a restricted sample of countries. Although the database provided by Eurostat presents some limitations (such as the lack of representativeness at country level, among countries close to the technological frontier, and the high presence of dichotomous variables), the final source allows a series of relevant conclusions to be reached.
Our database is limited to CIS 2010, which covers the period 2008-2010. This paper analyses the determinants of HGFs using an extensive sample of firms belonging to thirteen countries classified into three clusters according their gap with the European technological frontier: Core country (Germany), Mediterranean countries (Portugal and Spain), and New EU members (Bulgaria, Croatia, Cyprus, Czech Republic, Estonia, Hungary, Lithuania, Romania, Slovenia and Slovakia).
The main advantages of the CIS are: i) it contains detailed information on the innovation behaviour at firm level in much greater detail than in other datasets; ii) CIS data are internationally comparable based on a common survey questionnaire and methodology. However, there are also some drawbacks. First, CIS is a cross-sectional dataset. Second, CIS data has little financial information, which is a crucial variable for firm growth. Finally, and most importantly, the country coverage varies substantially depending on the indicators considered. This limits our capacity to incorporate variables that are available for some countries but not for others.
Finally, our database was subject to a filtering process. First, we selected firms from the manufacturing sectors (Divisions 10-33 NACE classification). To control for outliers, we restricted observations to those firms with a growth or decline of sales and employees under 250% per year. Although the filtering process reduced the initial database from 97,496 to 40,822 firms, the sampling improved the data consistency.
Descriptive statistics
The definition of HGFs follows the criteria adopted by the OECD and Eurostat in the Manual on Business Demography Statistics (Eurostat-OECD, 2007, pp. 61), which defines HGFs as: “All enterprises with average annualized growth in employees (turnover) greater than 20% a year, over a 3-year period, and with 10 employees at the beginning of the observation period”. The CIS data do not include the number of employees (only a variable recoded between three size classes: firms with 10-49, 50-249, and 250 or more employees); it also does not contain information about turnover. Given the restrictions of our database, we identify HGFs as firms with a turnover growth equal to or greater than 20% between 2008 and 2010. We deflated this variable using an industrial price index.
Our final data contains 40,822 firms, of which 3,377 (8.27%) were HGFs (Table 2). The percentage of HGFs in the Core countries is 5.73%, in the Mediterranean countries is 5.24%, while, in the New EU countries is equal to 10.81%. The difference in the percentage of HGFs in the Core and Mediterranean countries versus the New EU countries may be explained in part by the fact that New EU countries are benefitting from still being in a process of economic convergence and having weaker market structures.
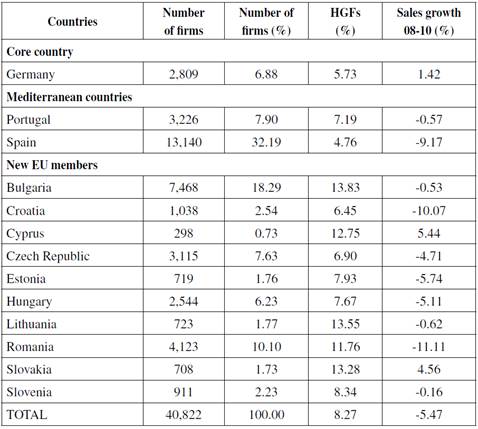
Table 3 shows the main features that distinguish HGFs between the three country clusters that are considered in this study:
a) Eastern countries’ moderate propensity to invest in R&D or cooperate in R&D projects with other partners reflect the weakness of their Innovation Systems at the regional and country level to facilitate innovation activities in their local firms.
b) Firms in Core and Mediterranean countries introduce more innovations, both technological and non-technological, than New EU members. Furthermore, countries that have been integrated into the EU project for many years receive more public funds that New EU members.
Table 3 Descriptive Statistics by Country Groups (mean values)
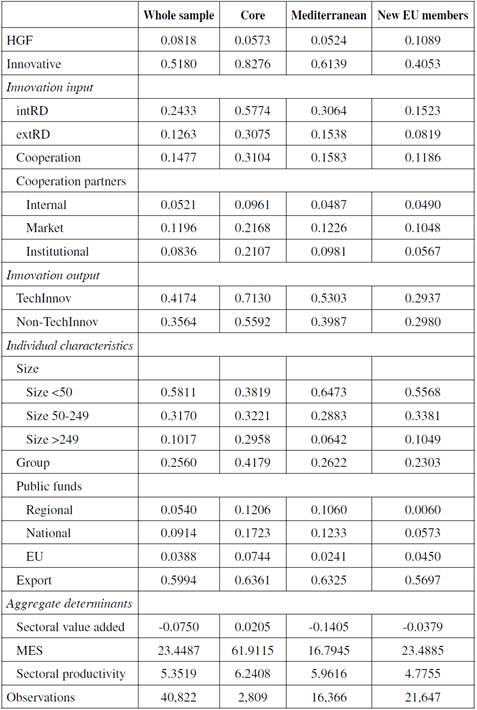
Source: Authors’ own calculations based on CIS2010, Eurostat.
Table 4 presents statistics for HGFs and Non-HGFs in the three groups of countries. The table´s main characteristics are the following:
a) The proportion of those HFGs that state they are engaged in R&D activities is greater in the Core and Mediterranean countries than in New EU member countries. HGFs in countries close to the technological frontier that are involved in R&D also undertake more intensive cooperation agreements than HGFs in countries that have recently been integrated into the EU.
b) In contrast, HGFs in New EU Member countries are less innovative as they have a lower percentage of R&D effort and technological and non-technological innovation in comparison with Core and Mediterranean countries.
c) In general, the HGFs in Core and Mediterranean countries are more innovative, more active in investing in R&D, cooperate more in R&D projects with other firms or institutional partners, and are more likely to receive regional and national public funds.
d) However, in New EU Member countries, Non-HGFs are slightly more innovative than HGFs. They are more likely to invest larger amounts in R&D (internal and external) and cooperate more in R&D projects with other partners. Moreover, Non-HGFs in New EU countries export less than HGFs.
Tabla 4 Descriptive Statistics of HFGs and Non-HGFs by Country Groups (mean values)
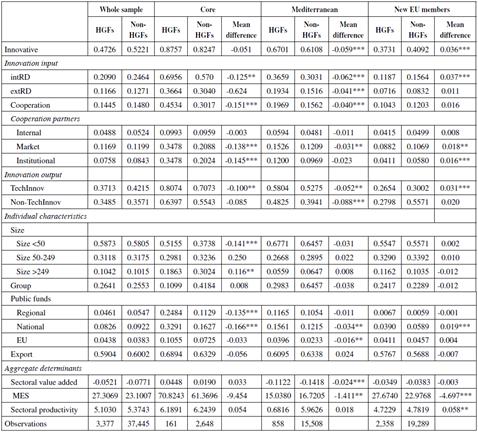
Note: comparison of the two samples (HGFs versus Non-HGFs) using the statistical t-test. ** and *** indicates levels of significance to 5 and 1%.
Source: Authors’ own calculations based on CIS 2010, Eurostat.
In short, the values reflected in the three clusters of countries, together with the substantial significance of the t-test, suggest that the profiles of HGFs and non-HGFs from countries that have been EU members for longer periods of time differ slightly from those in New Member countries.
ECONOMETRIC MODEL
We apply a bivariate probit as the econometric methodology to analyse the effect that innovation activity has on the probability of becoming an HGF. Since our database is cross-sectional, our estimations will not be able to capture the impact that innovation has on the probability of being an HGF. Hence, we consider a simultaneous model in which the innovation inputs, innovation outputs and the capacity of the firm to become an HGF are interrelated.
Our model follows the CDM approach (Crepon, Duguet, & Mairesse, 1998) where the firm makes an effort to innovate, which has an impact on innovation output and, thus, there is an impact on firm performance. Hence, our model is composed of two equations:
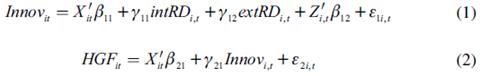
and where
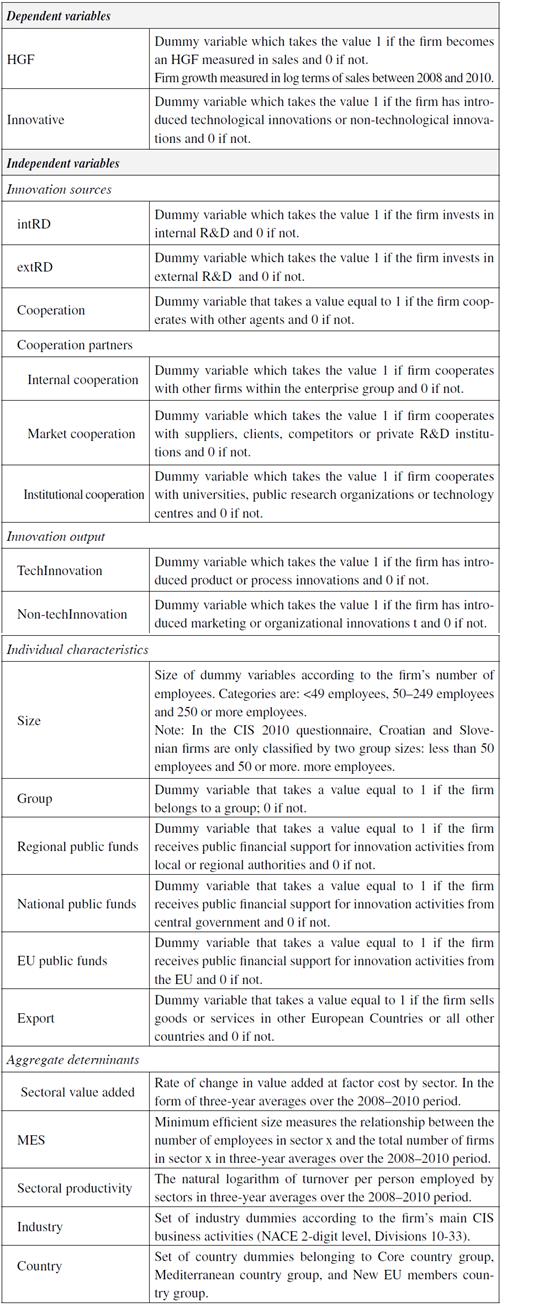
Equation (1) estimates the probability that a firm innovates7. Innov is a dummy variable equal to 1 if the firm reports having introduced new or significantly improved technological or non-technological innovations between 2008 and 2010. As explanatory variables specific to this equation, we include the innovation inputs such as the internal R&D (intRD) and external R&D activity (extRD) and a set of explanatory variables (Z). These belong to the different types of cooperation partners such as whether the firm cooperates with other firms within the enterprise group (Internal), suppliers, clients, competitors or private R&D institutions (Market) or universities, public research organizations, or technology centres (Institutional).
Equation (2) calculates the probability of being an HGF. HGF is a dummy variable equal to 1 if the firm is an HGF as measured in terms of sales. In this second equation, we have distinguished between our main explanatory variable between technological (TechInnov) and non-technological innovations (Non-TechInnov) during the 2008-2010 period.
Both equations control for common explanatory variables (X). First, we intro-duce firm characteristics such as firm size (dummies that identify firms between 50 and 249 employees and those with 250 or more employees), if the firm belongs to a group, if the firm exports or cooperates, and if it has received public funds (at regional, national, or EU level). Finally, we include macroeconomic variables such as sectoral valued added, sectoral minimum efficient scale, sector productivity, country dummies and sectoral dummies.
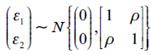
We assume that εi are independently and identically normally distributed residuals. The parameter ρ identifies the correlation between the disturbances and accounts for omitted or unobservable factors that simultaneously affect the decision to innovate and the likelihood of becoming an HGF8.
Our results show that the coefficient is significantly different to 0 when we simultaneously estimate all the countries. However, when we break this down using our three categories of country, the parameter is not significant. We present the joint results, but our results remain similar when we estimate the univariate probit models.
The bivariate probit regression model has several advantages. First, it allows the propensity to innovate and the capacity to become an HGF to be estimated together. Second, it allows unobserved common determinants to be controlled. The probability of innovating and the probability of becoming an HGF must be estimated simultaneously since there may be unobserved characteristics that explain a firm’s capacity to innovate and their capacity to become an HGF (see for instance Coad et al., (2016); Segarra-Blasco and Teruel (2014). Also, Decker, Haltiwanger, Jarmin and Miranda, (2016) recently pointed out the relationship between the presence of Young Innovative Companies (YICs) and HGFs.
Furthermore, the uncertainty associated with the innovation output also depends on unobservable firm-specific risk factors, which may affect the capacity of a firm to introduce its goods into the market and, consequently, this may affect its capacity to become an HGF.
RESULTS
Table 5 reports the results of the average marginal effects from the innovative activity determinants and being an HGF (in terms of sales). We report the marginal effects for the whole database and for the three groups of countries considered in this study (Core, Mediterranean and New EU members).
Table 5 Average Marginal Effects of Bivariate Probit of the Probability of Innovating and the Probability of Becoming an HGF
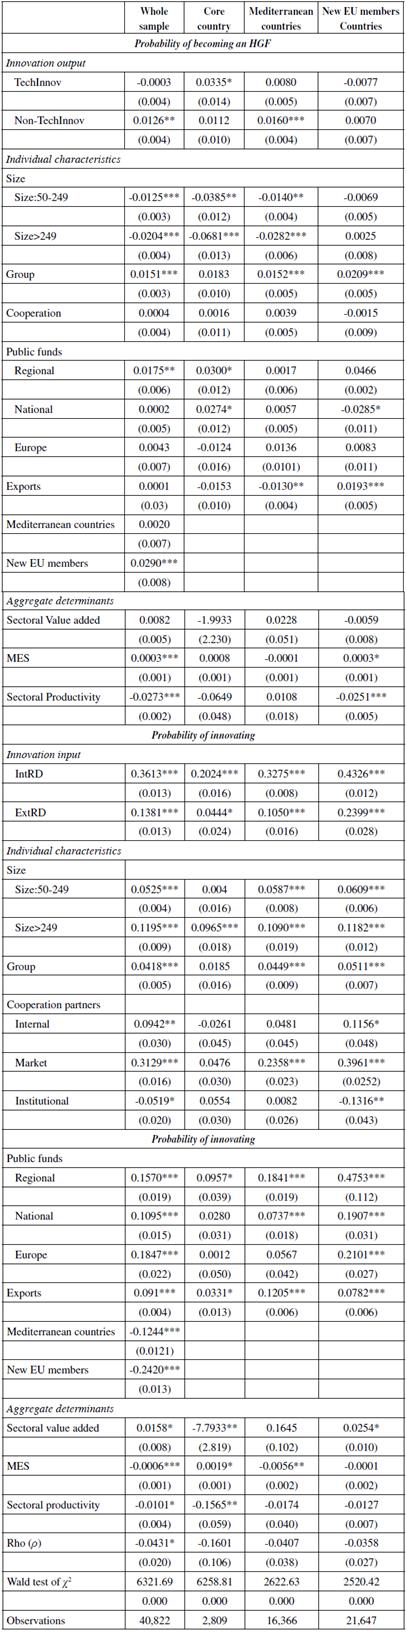
HGF high-growth firms. Core country: Germany; Mediterranean countries: Portugal and Spain; New EU members’ countries: Bulgaria, Croatia, Cyprus, Czech Republic, Estonia, Hungary, Lithuania, Romania, Slovenia, and Slovakia.
Estimations control for country and sector dummies. *; **; *** indicate levels of significance equal to 10.5 and 1 %. Robust standard errors in parentheses.
Source: Author’s own calculations based on CIS2010, Eurostat.
The following observations are the main results for the determinants that affect the probability of being an innovative firm: In terms of the impact the R&D investment has on the probability of innovating, the estimation across all country clusters shows a positive and highly significant relationship between investments in internal and external R&D as well as the probability of introducing both technological and non-technological innovations.
The role assigned to the characteristics of firms is in line with previous results. First, medium and larger firms show a larger propensity to innovate than small firms. Second, firms belonging to a group are more likely to innovate, especially in Mediterranean and New member countries. This may be because firms belonging to a group have greater support in carrying out innovative activities. Third, firms that cooperate and export show a greater correlation with being an innovative firm. Institutional cooperation seems to be more important for Core country firms whereas Mediterranean firms rely more on market cooperation such as competitors, suppliers, or clients. In contrast, cooperation with other firms that belong to the group and with competitors, suppliers, or clients positively affects New EU member countries’ ability to innovate.
In terms of access to public funds, we observe that this variable has a positive correlation with the likelihood of being an innovative firm (both technological and non-technological) in all countries. The availability of regional public funds seems to be influential for Core firms while both regional and national public funds are important for Mediterranean countries. Furthermore, in addition to regional and national public funds, EU subsidies show a greater correlation with the probability of being an innovative firm in the New EU member group.
Concerning the aggregate variables, we observe that the sectoral value added shows a significant positive impact on New EU members’ probability of innovating while the relationship is significant and negative for the Core country. The different impact shows that the firms that have a larger probability of innovating in the New EU countries are in sectors with larger added value growth. In the Core country, however, the capacity to innovate is negatively related to dynamism in the sector. Similarly, the minimum efficient size (MES) has a different coefficient. On the one hand, we observe a positive significant coefficient for firms in the Core country while the sign becomes negative for the Mediterranean countries.
This result highlights the different nature of the sectors and market competition. While sectors with higher average productivities show a positive association with the probability of innovating, innovative firms show more innovation difficulties in sectors which are dominated by large-scale firms. Finally, the sectoral productivity shows a negative impact on the probability of innovating, which is significant only for the Core country.
Hence, our results provide a clear indication that there is a statistically significant difference between country groups with regard to their own R&D and innovation behaviour. This is in line with the sectoral differences at a country level.
Regarding the relationship between innovation and the probability of becoming an HGF, our results suggest significant differences between country groups in line with Segarra-Blasco et al., (2016).
First, we observe that technological and non-technological innovations are not decisive determinants. Mainly, firms located in the technological frontier of Core country and Mediterranean countries seem to rely more on technological innovations and non-technological innovation, respectively. In contrast, in New EU countries, innovation outputs do not influence the probability of becoming an HGF.
Second, our results confirm previous empirical evidence on the negative relationship between firm size and the probability of being an HGF. Hence, small firms have a larger propensity to become an HGF in countries that have been incorporated in the EU project for many years.
Third, in Mediterranean and New EU member countries, those firms that belong to a group also show a positive association with the likelihood of becoming an HGF. However, the group variable does not influence HGF for the Core cluster.
Fourth, the export activity has relevant differences between the country clusters. Although a negative relationship with being an HGF is found for Core and Mediterranean countries, international activity is positive and significant for Mediterranean firms. In contrast, for New member firms, our results confirm the existing literature that shows firms with international activity are more likely to be an HGF9. In line with these results, Du and Temouri (2015) the literature so far does not adequately explore the link between HGFs and productivity. This paper investigates the empirical link between total factor productivity (TFP and Mason & Brown, 2010) observe that HGFs are characterized by a larger internationalization and integration in global value chains.
Concerning the aggregate determinants, the variables are only significant for the New EU countries. First, we only observe a positive impact of MES on the probability of becoming an HGF for New EU members. This result highlights that these countries have systemic barriers to foster the growth of the firms in the domestic market. Hence, firms in sectors with a larger size have a higher capacity to innovate. Finally, sectoral productivity shows a negative coefficient on the probability of innovating. This implies that the capacity to introduce innovations is closely related to the productivity gap that may exist in these countries.
Given these relationships, the results clearly confirm our conjecture that HGFs are different for country groups that have been recently incorporated into the EU project than for countries that have been incorporated for many years. While success in innovation is closely related to previous investments in R&D and public funds in all countries, being an HGF is associated with innovative activity at firm level only in Core and Mediterranean countries (not in New member countries). HGFs in transition countries are seen to differ somewhat from those near the technological frontier because of issues such as being part of a group, undertaking an inter-national activity, or having suitable partners within an enterprise group.
CONCLUSIONS
This paper began with the proposition that the enlargement of the EU due to Eastern European country membership has modified the current balance in the EU. During this process, the Innovation System in these New EU countries has diversified intensively. In line with other studies that examine the differences in innovation drivers, our results show that there is a direct link between R&D, innovation and firm growth in Core and Mediterranean countries (Krammer, 2009; Mohnen et al., 2006); however, New EU member countries have a weak connection between R&D, innovation, and firm growth. In Eastern countries, institutions such as universities, FDI, and the progress of institutional governance all play a crucial role promoting innovation and firm growth.
By applying a bivariate probit regression model, we analyse the propensity to innovate and the capacity to become an HGF in three different groups of countries (Core, Mediterranean, and New EU members) at firm level. First, we observed substantial heterogeneity between countries, which is the result of their very different contexts. Second, firms’ dynamics in terms of growth are explained by different determinants such as the institutional context and the relative position of the countries in relation to the other economies. When the countries are near the technological frontier, product and process innovations foster the probability of becoming an HGF, while non-technological innovation appears as a major driver in Mediterranean countries. Lastly, individual firm’s characteristics and export intensity play key roles in New EU countries.
One of the main conclusions is that during the period 2008-2010, firms in New EU countries invested and cooperated less in R&D and, consequently, they had less capacity to generate innovations than the other members. Paradoxically, East-ern European countries have more HGFs than countries from the Core or Mediterranean clusters. In fact, firms in Eastern European countries are more sensitive to R&D investment. Additionally, the fact that they belong to a group of companies, their foreign-market orientation, and the sectoral minimum efficient size are factors that affect their probability of becoming an HGF.
Over recent years, as some authors have highlighted (Audretsch et al., 2014; Brown & Mawson, 2016; Daunfeldt et al., 2016) the link between firm growth, R&D investment, and high-tech sectors was made on misconceived preconceptions. In countries that are close to the technological frontier, with robust systems of science and innovation, R&D plays a central role and there is a stronger link between R&D, innovation output, productivity, and firm growth. However, in countries with weak National Innovation Systems, such as Spain, this link is weaker and needs to be reinforced with more effective public policies. Consequently, the Mediterranean countries are suffering from the constraints of the current economic crisis and their lack of innovative capabilities. Eastern European countries, however, require a set of stable actions facilitating greater connection between universities, technological centres, and innovative firms in order to consolidate a National Innovation System that eliminates the isolated position of innovative firms that aspire to grow through R&D investment.
Since 2004, the enlargement of the EU has seen the addition of thirteen new countries most of which were satellites of the USSR until the 1990s. The transformation experienced by the EU has been considerable, but are the EU countries ready for the consequences? New EU members are completely different in economic, social, and institutional terms. Since joining, New EU members have experienced a high flow of direct foreign investment and considerable growth in trade flows. As we have continuously emphasized, the traditional North-South balance has led to a more unstable territorial balance, which has been to the detriment of the Mediterranean countries.
Focusing on the individual and environmental factors that affect manufacturing firms’ ability to become HGFs, we found that drivers differ considerably between European countries. In Core countries, technological innovations emerge as crucial drivers to foster a firm’s capacity to become an HGF. Conversely, non-technological innovations are the major driver for the Mediterranean members while, for the New EU members, exports appear as a key force in promoting a firm’s capacity to become an HGF. These results highlight the need to develop a less mono-lithic industrial policy than the traditional recommendations offered by European institutions. The traditional industrial policy applied in the EU must be more sensitive to the specific context of each country and industrial sector. In summary, the policy of fostering innovation in Europe should not be considered homogeneous but must be coordinated with actions undertaken by the governments and public agencies in each country.