English (pdf)
 Article in xml format
 Article references
 Send this article by e-mail
 Cited by SciELO
  Cited by Google
  Similars in
SciELO
Similars in
SciELO  Similars in Google
 Permalink
INTRODUCTION
Entrepreneurship has long been recognized as a key driver of innovation and economic development (Schumpeter, 1934; Audretsch, 2012). Renewed interest in an understanding of micro-macro linkages between firm-level activities and their collective impact at the national level have taken on heightened importance of late in part because of the global recession of 2008-2009 that affected both industrial and developing countries alike, with devastating effects on income, employment, and growth. In that context, academics and policymakers have become increasingly aware that it is not the quantity of firms that matters for economic performance, but the quality of these firms (Henrekson & Sanandaji, 2014; Acs, Åstebro, Audretsch, & Robinson, 2016; Lederman, Messina, Pienknagura, & Rigolinia, 2014). In particular, as noted earlier, a small number of firms can account for a disproportionately large share of job creation (Birch, 1979). And, as has been seen with the advent of the internet, a few of such enterprises can also contribute to the emergence of new sectors (Bos & Stam, 2014, OECD, 2015) and provide jobs for individuals who might otherwise be marginalized on the labour market (Coad, Daunfeldt, Johansson, & Wennberg, 2014a). This coincidence of circumstances and events has led to growing interest in High-Growth Firms (HGFs) (Delmar, Davidsson, & Gartner, 2003; Henrekson & Johansson, 2010; Coad, Daunfeldt, Hölzl, Johansson, & Nightingale 2014; Bianchini, Bottazzi & Tamagni 2017; Demir, Wennberg & McKelvie, 2017). In particular, international organizations such as the European Commission and the OECD are increasingly interested in macroeconomic indicators, at the national level, regarding the frequencies of high-growth firms (Eurostat-OECD, 2007; European Commission, 2014). However, most of the research and discussion on HGFs has been focused on industrialized countries, e.g. (Henrekson & Johansson, 2010; OECD, 2011; Coad et al., 2014b) even as developing countries increasingly recognize the importance of the issues associated with such enterprises (Navarro, Benavente, & Crespi, 2016; OECD, 2016, McKenzie, 2017).
In light of these various considerations, this exploratory research note contributes to the literature by presenting novel findings on HGFs in Peru. Given its recovery from macroeconomic instability in the 1970s, 1980s, and 1990s (Tello & Tavara, 2010), as well as the challenges inherent in a dichotomous business sector much of which remains mired in informality (Schneider, Buehn, & Montenegro, 2010; Machado, 2014), Peru constitutes an interesting case for entrepreneurship research. More specifically, a series of recent studies of entrepreneurship, innovation, and growth in company sales in Peru - many of which were focused on a particular point in time - reaffirm the appropriateness of a firm-level analysis over a more sustained period (Chaston & Scott, 2012; Scott & Chaston, 2012, 2013, 2014). In a similar vein, other recent research that focused on the evolution of firms in particular sectors points to the usefulness of a broader approach aimed at under-standing the performance of firms across the entire economy (Llosa & Panizza, 2015; Tello, 2017). Furthermore, based on available data for other countries and Peru´s recent record of rapid economic growth (World Bank, 2017), preliminary findings suggest that Peru may well have had a relatively high share of HGFs in recent years. This study then seeks to explore the incidence, duration and characterization of HGFs in Peru during the period 2001-2016 both to inform private sector participants regarding recent firm performance and to provide added empirical evidence to the on-going policy debate related to innovation and entrepreneur-ship (OECD, 2016).
This paper is organized as follows: Section 2 contains a brief overview of the Peruvian economy during previous decades so as to better contextualize the cur-rent analysis. Section 3 presents the data utilized for this study followed by the analysis in Section 4. Section 5 provides some concluding remarks and identifies a number of emerging issues for future research.
BACKGROUND ON THE PERUVIAN ECONOMY
Recent estimates indicate the GDP of Peru was 403 billion in PPP Intl$ (international dollars), and its GDP per capita was Intl$ 12,6391, below that of its neighbours Chile (24,170), Brazil (15,941), and Colombia (14,164), but above that of its neighbours Ecuador (11,839) and Bolivia (6,530). Peru is currently preparing to join the OECD (Organization of Economic Co-operation and Development) (CGBS, 2016), perhaps as early as 20212. Peru´s current economic indicators belie the outcome of a tumultuous and violent journey through economic, political, and social turmoil during the 1970s, 1980s, and early 1990s characterized by four drastically different governments in succession that had a major impact on firm survival, let alone the potential for firm growth. A brief review of these past developments is intended to put our analysis of firm performance in the more recent period under review in proper context and, thereby, to facilitate a more grounded interpretation of associated statistical analysis.
A leftist military regime throughout the 1970s sought to give the State control over economic activities by confiscating foreign and domestic companies alike (Dancourt, Mendoza, & Vilcapoma, 1997; Flores & Ickis, 2007) while drastically curtailing civil liberties (e.g., freedom of speech, freedom of the press) in the process (Quiroz, 2008). By the late 1970s, sharply deteriorating real incomes due to economic mismanagement, graft, and corruption forced a return to civilian rule in 1980 (Skidmore & Smith, 1997).
From 1980-1985, the democratically elected government fostered a policy of import substitution that favoured certain firms and sectors for domestic capitalist development while maintaining State enterprises and encouraging foreign direct investment in others e.g., mining (Kasturi, Barton, & Reficco, 2012). High interest rates on an inherited foreign debt, the El Niño natural disaster of 1983, and a public sector without a significant tax base all contributed to an inflation rate of 150% a year in 1985, and a sharp drop in per capita incomes and also the prospects for firm growth based on domestic demand in the process (Dancourt, Mendoza, & Vilcapoma, 1997). Adding to the already challenging convergence of circumstances, terrorism became emboldened through funding based on a major expansion in coca cultivation tied to production and shipment of illegal drugs (Gonzales de Olarte, 1991) and the absence of a coherent government strategy to suppress it (Murakami, 2007).
In 1985, Alan Garcia’s newly elected government gained international attention by embracing economic heterodoxy - promising to reassert the role of the State in economic activity, e.g. by controlling prices for basic food commodities, only paying 10% of export earnings towards the foreign debt and covering the subsequent fiscal deficit by printing money (Pastor & Wise, 1992; Rossini & Santos, 2015). The resulting hyperinflation reached over 7000% a year by 1990 driving many firms into bankruptcy as terrorist activity became much more widespread, eventually leading to nearly 70,000 civilian casualties (Loayza, 2008; World Bank 2017).
With the nation on the verge of bankruptcy and isolated from international capital markets, the Fujimori government embraced a greatly reduced role of the government in economic affairs and instead opted for a policy of globalization-aggressively seeking free trade agreements with various countries, privatization of State enterprises as a way of attracting much needed foreign direct investment, liberalization, i.e. the elimination of price controls on basic household commodities (e.g., food, fuel), and a freely floating exchange rate (Pasco-Font & Saavedra, 2001; Llosa and Panniza, 2015; Rossini & Santos, 2015). The counter terrorism strategy was also revamped by focusing on the leadership instead of fighting the rank and file. By the mid-1990s, the success of these policies led to a stabilization of the economy and the capture of many of the leading terrorists. As the economy opened up to much greater foreign competition in the domestic market for the first time in decades, many long-established firms were bought out, forced into mergers, or consolidated into larger enterprises given the pressures on their financial viability (Shimuzu, 2004). But the recession of 1997-98, brought in part by the cri-sis in Asia and a recurrence of El Niño, gave way to a series of revelations regarding massive corruption in government involving many prominent private firms and the eventual end of the Fujimori government (Conaghan, 2005; Abusada & Cusato, 2007).
Entering the new millennium, the combination of higher world prices for minerals and metals and successive governments’ consistent embrace of privatisation and market liberalisation paved the way for year after year of rapid economic growth (Hausmann & Kingler, 2008; Anon., 2009; González Vigil, 2009). So much so that in the midst of the 2009 global recession, Peru was one of only a handful of countries worldwide that registered positive economic growth despite the major downturn in most Western economies (IMD, 2010) thereby enabling it to emerge as one of the strongest economies in Latin America (Tello & Tavara, 2010).
Abundant mineral resources have supported strong export performance, and, in recent years, growth has spread to other sectors of the economy including tourism, agribusiness, and construction. Peru has also witnessed a revival of domestic demand with rising real incomes stimulating greater food production for the internal market (De Althaus, 2007; Scott, 2011; Loayza, 2008) and a boom in both residential and commercial construction. Tourism continues to flourish, generating billions in revenue and numerous new jobs in hotels, transportation and the restaurant industry.
The succession of positive economic developments enabled Peru to enjoy a growth rate of 5.8% or more for each year during 2010-2013, although since then it has slowed down slightly, with 2.4% in 2014, 3.3% in 2015, and 4.1% in 20163. None-theless, Peruvian exports remain heavily dependent on mining and agricultural products (World Bank, 2017). Moreover, the structure of the economy continues to be characterized by a small number of conglomerates made up of family-owned and controlled large firms (Shimizu, 2004; Conaghan, 2005) that are complemented by the presence of multinational enterprises in certain sectors (e.g., mining, energy, telecommunications, and retail trade) and a large number of informal enterprises that account for an estimated 35% - 60% of GDP and employ some 60% of the economically active workforce (Machado, 2014).
DATA DESCRIPTION
According to government statistics (INEI, 2017), some 2.1 million legally registered firms currently operate in Peru (Table 1), with perhaps another 2.1 million more informal enterprises based on available estimates of their share of GDP (Schneider, Buehn, & Montenegro, 2010). Over 94% of all these companies are micro-businesses. In that context, we analyse the Peru Top 10,000 dataset, which collects the annual statistics on the largest legally constituted firms; they are grouped in successive waves and joined together into a panel. Previous work on this dataset includes Shimizu (2006), Alarco Tosoni (2011) and Tello (2017).
Table 1 Peru: Companies, by Business Segment, 2015-16
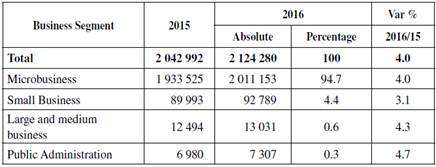
Source: Instituto Nacional de Estadística e Informática (2017).
We use the most complete available dataset: “Base Completa VIP”4. Our data focuses on the largest firms in Peru; thus, small, young firms are under-represented. Having said that, it should be also be noted that a “large” firm in this dataset might best be understood as including some firms that would indeed be considered large in terms of revenues or numbers of employees, but given published statistics on all legal firms in Peru, a collection of the largest 10,000 firms is perhaps best understood as made up of firms that are the largest compared to all the others, (it is certain to include medium-firms and possibly even some small firms). Be that as it may, our use of this dataset implies a potential source of sample selection bias, for example if small firms, which may have higher growth rates (Sutton, 1997), are not included in our analysis. This focus on the largest firms should be kept in mind when interpreting our results.
The database includes information on revenues as well as other firm characteristics such as age and sector of activity5. The panel stretches from 1993 to 2017 although data on revenues is only available for the years 2000-20166.
Firms are identified by their ‘RUC’ (‘Registro Único de Contribuyentes’) identifier code, which is a national code used by tax authorities for statistical records of economic activity. In the raw data, the same RUC code may appear more than once in a year, in cases where the contact details of different individuals from the same firm are listed. We therefore drop duplicates by keeping only the first occurrence of each group of duplicated observations for each RUC code in each year. Our data cleaning also involves dropping possible cases of negative revenues.
Firm growth is usually measured in terms of total sales or employment (Shepherd & Wiklund, 2009). The employment variable seems problematic in our dataset7, so we focus on revenues (‘Ingresos’) growth. The growth rate of revenues, for firm i in year t, is calculated by taking log-differences of annual revenues (Tornqvist, Vartia, & Vartia, 1985; Coad, 2009).
Gr_revenuesit = log(revenues)it - log(revenues)i,t-1
Age is calculated with reference to the year of founding8. Cases of negative age, which are sometimes observed in the early years of the panel, are implicitly dropped from the analysis by taking the logarithm of age in the regressions. A variable ‘estatal’ provides information on whether a firm is a State-owned enterprise, but it does not distinguish between non-State-owned enterprises, and missing observations (the variable only takes the value 1 or missing; and we convert all missing observations to zeroes to create a dummy). Therefore, this variable for State-owned firms should be interpreted with caution.
Deflating the data
Our focus on revenue growth rather than employment growth requires that we deflate our data to address inflation. This is an important methodological step to avoid confounding inflation with genuine firm growth. This is especially important in the Peruvian context, because Peru suffered inflation of over 50% for every year between 1981 and 1992, with over 7000% inflation in 1990 (Loayza, 2008; Rossini & Santos, 2015). However, inflation has remained below 10% from 1996 onwards.
To control for inflation, ideally, we would use accurate sector-specific deflators to account for possible differences across sectors - however, we did not find any such deflator. Therefore we use the GDP deflator (annual %) from the World Development Indicators of the World Bank national accounts data, and OECD National Accounts data files (indicator code: NY.GDP.DEFL.KD.ZG; downloaded from https://data.worldbank.org/indicator/NY.GDP.DEFL.KD.ZG , last updated 14th December 2017). To be precise, “Inflation as measured by the annual growth rate of the GDP implicit deflator shows the rate of price change in the economy as a whole. The GDP implicit deflator is the ratio of GDP in current local currency to GDP in constant local currency9”.
ANALYSIS
Descriptives
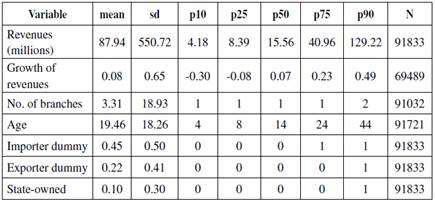
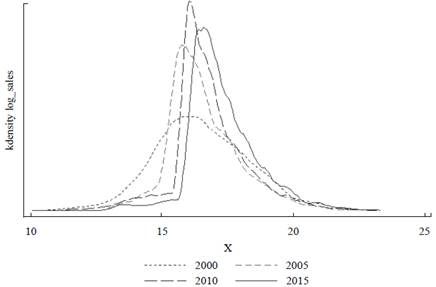
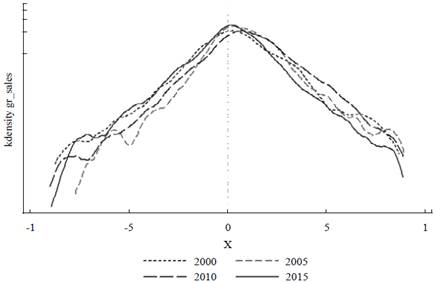
Table 2 contains some summary statistics for our data. Figure 1 shows the firm size distribution, for different years. Firm size has been increasing over years, as the distribution shifts to the right. Since 2000, the distribution has a narrower support - there is a lower proportion of relatively smaller firms in our dataset in later years.
Source: Our calculations.
Figure 1 Firm Size Distribution (Where Size is Measured in Terms of log of Revenues), for Different Years.
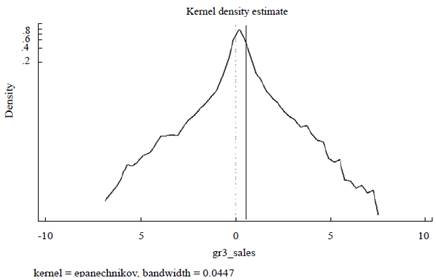
Figure 2 shows the growth rates distribution for firms in our sample. In contrast to previous work for other countries (e.g. Stanley et al., 1996 for the US; Bottazzi & Secchi, 2006 for Italy; Bottazzi, Coad, Jacoby & Secchi, 2011 for France), the growth rates distribution is not symmetric, but rapid growth is relatively common, and (especially in 2005) rapid decline is relatively rare. The large firms in our sample appear to be surging forward in terms of rapid revenues growth.
Source: Our calculations.
Figure 2 Growth Rates Distribution for Our Dataset, for Different Years. Note the log scale on the y-axis. The dotted line is at growth=0.0000.
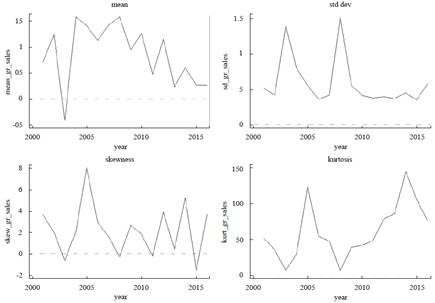
Figure 3 shows the evolution of the first four moments of the growth rate distribution throughout the years. As Peru pulled out of the 1990s crisis, one could have expected a period of high growth, and perhaps decreasing business volatility. Figure 3 complements Figure 2 and shows that the mean growth rate has usually been above zero, corresponding to positive revenues growth, and also that - apart from a few peaks - the standard deviation of growth rates seems to have remained fairly flat. The skewness errs on the positive side, which suggests that the growth rate distribution is asymmetric, with a larger weight at the right tail (i.e. there are more firms enjoying large positive growth rates than large negative ones).
Source: Our calculations.
Figure 3 Evolution of the 4 Moments of the Growth Rate Distribution Over Years.
Figure 4 shows the bivariate density of growth rates in consecutive years, following Coad, Daunfeldt, & Halvarsson, (2018). The area that has the highest density (i.e. the area with the darkest shading) corresponds to mild-positive growth rates in t-1 and also t. However, all possible combinations of growth are observed (including the possibility of decline in two consecutive years, which would correspond to the bottom left quadrant).
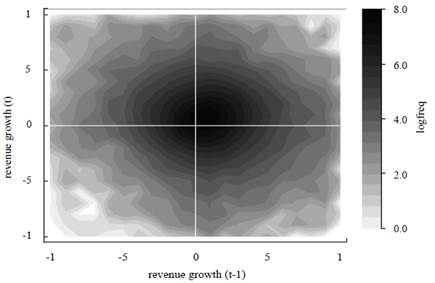
Note: Colouring shades correspond to the frequency of the number of firms that have been categorized into logarithmic bins. White areas contain no observations without interpolation. The contour is delimited to growth rates ±1. Source: Our calculations.
Figure 4 Contour Plot of Revenue Growth in Consecutive Periods. All Years Pooled Together
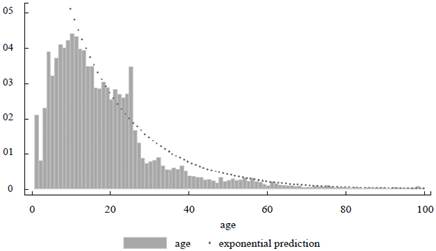
Figure 5 shows the age distribution of firms in our sample. The majority of firms are relatively young, in the sense that they are less than thirty years old. Some firms are older than 100. To the extent that the true age distribution is exponential (Coad, 2010), or perhaps Weibull-distributed (Axtell, 2016), the fact that the mode of the age distribution occurs at age around ten suggests that firms aged less than ten years are under-represented in our dataset. An exponential fit is plotted alongside the empirical density, fitted for the range of firms that are ten or older, (because the mode is at around ten years) and for ages up to 100. Compared to the exponential fit, the empirical density has a relatively large number of firms aged in their early twenties (i.e. born in the 1990s), but, with a few notable exceptions (Marquina, 2010; Lavardo Gagliardi, 2013; Paan, 2013), relatively few firms in their thirties (i.e. relatively few born in the 1980s).
Source: Our calculations.
Figure 5 Age distribution with reference to the year 2018, for ages up to 100. Firms aged over 100 are not plotted here. The fitted exponential distribution, which serves as an approximate visual aid, is inserted manually using OLS predicted values of (log of) number of firms of each age, for firms in the range 10-100 years.
Analysis of HGFs
Descriptives of HGFs
The OECD-Eurostat definition of a High-Growth Firm refers to an average of 20% annual growth over a three-year period (Eurostat-OECD, 2007), i.e.:
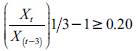
where X is the size of the firm in year t10. Some previous investigations into high-growth firms have thus often measured growth over a three-year period (Holzl 2014, Zhou, De Kok, Hartog, & Van Der Zwan, 2012; Daunfeldt, Johansen, & Halvarsson, 2015; Choi, Rupasingha, Robertson, & Leigh 2017). Figure 6 pre-sents the distribution of growth rates over a three-year period and illustrates the threshold above which the OECD-Eurostat definition would classify a firm as an HGF. Many firms in our sample have growth rates above this threshold.
HGFs by Sector
Are HGFs more common in certain sectors than others? Despite the excitement about high-tech HGFs, nevertheless HGFs are not more common in high-tech sec-tors (Mason & Brown, 2013; Daunfeldt, Elert & Johansson, 2016) although the survey by Henrekson and Johansson (2010) finds that they are over-represented in services.
Source: Our calculations.
Figure 6 Position of the threshold for being an HGF (solid line): growth (on average) of 20% each year over three years. The dotted line corresponds to growth = 0.000. All years pooled together.
Figure 7 shows that the number of HGFs has been decreasing in recent years. This could correspond to a slowing down of the Peruvian economy after the boom during the first decade of the 2000s.
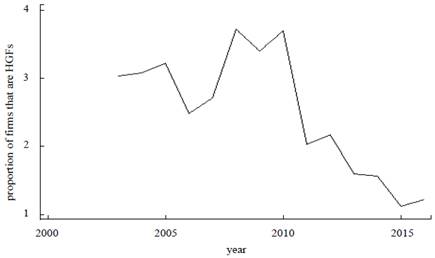
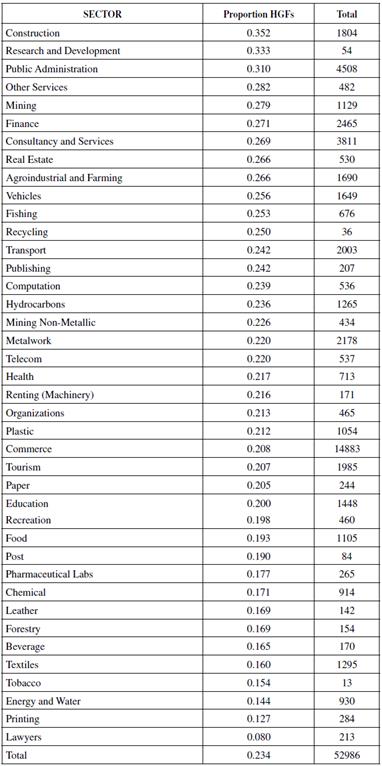
Table A1 (in the Appendix) shows the proportions of HGFs in each sector. To avoid the ‘law of small numbers’ statistical fallacy (Kahneman, 2011, Chapter 10), we focus on sectors with a larger number of firms11. Similar to Choi et al. (2017), we find a large share of HGFs in the construction sector. HGFs are also particularly common in public administration, ‘other services’, mining, finance, consultancy and services, real estate, and the agro-industrial and farming sector. HGFs are conspicuously less common in textiles, energy and water, printing, and law.
It should be remembered, though, that just because these sectors had a relatively large share of HGFs in the past, this is no guarantee that they will have many HGFs in future.
Comparing HGF numbers with Other Countries
How does the frequency of HGFs in Peru compare to other countries? Although we do not have access to microdata from other countries, nevertheless we can make use of some calculations reported by the OECD. In particular, we report the share of High-Growth Enterprises (turnover definition) of the SDBS Business Demography Indicators, for available years and countries12.
By international comparison, the Peruvian firms in our dataset have had an extraordinary growth performance (see Table 3). (Remember that our revenues data has already been deflated to remove inflation.) Compared to other countries, a relatively high share of them would qualify as HGFs. Other countries with high shares of HGFs are Latvia, Estonia and Bulgaria.
Table 3 Percentage of firms that are high-growth firms, where high growth is defined in terms of growth of (deflated) revenues.
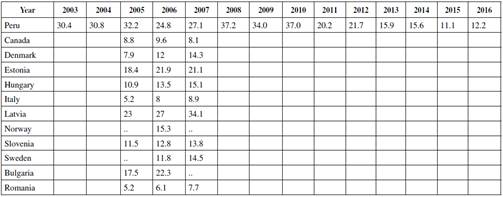
Notes: Rate of High-Growth Enterprises (20% annual growth based on turnover), as a percentage. OECD data refer to Manufacturing, for firms with ten employees or more.
Source: Data for Peru comes from our TOP 10,000 dataset (deflated revenues growth). Data for other countries comes from the OECD SDBS Business Demography Indicators.
Regression Analysis on Growth
Our preceding non-parametric analysis is followed by some parametric regressions, which allow us to investigate the factors associated with growth and control for potentially confounding effects in a multivariate setting. We begin with logit regressions in Table 4, where the dependent variable is the firm’s HGF status (taking values 1 for HGFs and 0 for non-HGFs). In Table 5, we focus on the factors associated with a firm’s growth rate in an individual year, in an augmented Gibrat’s law framework (Gibrat, 1931; Coad, 2009), to investigate the role of lagged size and other variables on the subsequent growth performance. Given that the growth rate distribution is not Gaussian but displays a ‘tent-shape’ reminiscent of the Laplace distribution (see our Figure 2, and also Bottazzi et al., 2011), we prefer least absolute deviation (LAD) regression, also known as median regression, to the usual ordinary least squares (OLS) regression model.
Table 4 Logit Regression Results to Determine Which Firms are HGFs. Robust standard errors. Key to significance stars: *** p<0.01, ** p<0.05, * p<0.1
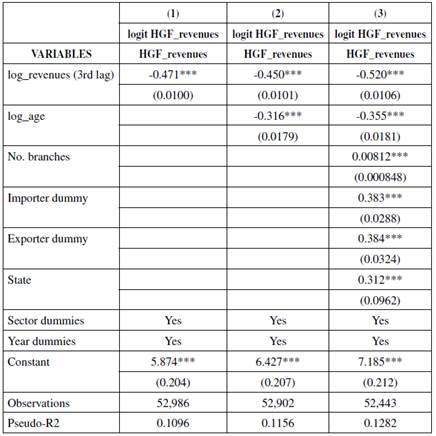
Source: Our calculations.
Table 4 shows that younger and smaller firms are more likely to be HGFs, in keeping with a wide range of other studies (Henrekson & Johansson, 2010). Firms that are importers and exporters are more likely to be HGFs. Similarly, Table 5 shows that younger and smaller firms have lower growth on average.
Table 5 Median regression results (i.e. quantile regression at the 50% quantile), along with OLS and panel fixed-effect least-squares estimates. Standard errors are clustered at the firm level. Key to significance stars: *** p<0.01, ** p<0.05, * p<0.1
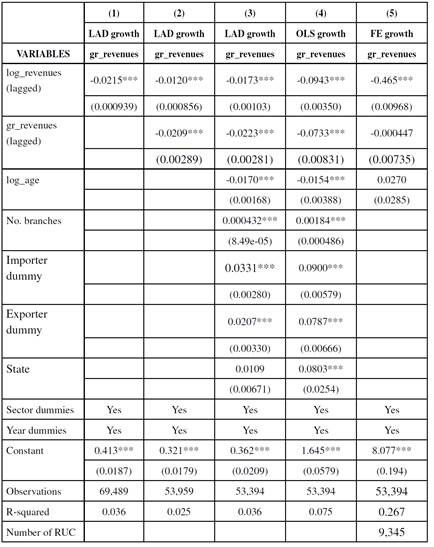
Source: Our calculations.
In Table 5, the slightly negative coefficient on lagged growth suggests that revenues growth has a negative autocorrelation. Firms that grew rapidly in one period are unlikely to repeat this performance in the following period.
Tables 4 and 5 also show that revenues growth is more likely (whether measured in terms of HGF status or in terms of the annual revenues growth rate) for firms that have more branch offices (‘sucursales’) and that are active on an international scale (in terms of importing and exporting activity). Also, State-owned firms are more likely to be HGFs (Table 4) and to have higher growth rates (column (4) of Table 5).
CONCLUSION
This research note presents an exploratory study of HGFs in an emerging economy context that has, until now, escaped attention: Peru. Firms in our dataset enjoyed a bullish growth in revenues during the period studied. HGFs are relatively com-mon in Peru, compared to other countries, although their share has decreased over the time span of our analysis. We confirm several previous findings, such as the heavy-tailed growth rates distribution, and the superior growth performance of small and young firms.
Our sample focuses on relatively large firms, and undersamples young firms. Indeed, it is difficult to obtain data on small Peruvian firms, because many small-scale entrepreneurs in Peru prefer to remain informal (Scott & Zelada, 2011; Andersson & Waldenström, 2017), and, hence, are not visible to data collectors. Further work could investigate the growth performance of samples of younger and smaller firms in Peru if data becomes available.
Our findings on the strong growth performance of Peruvian firms leads to questions about the role of HGFs in economic growth and recoveries. Is economic growth like a rising tide that lifts the growth rates of all firms? Or, on the other hand, do HGFs bring about large-scale growth through some kind of ‘multiplier effect’? Which is the most important direction of causality? Future work could more closely investigate the causal relation between frequency of HGFs and economic development.