English (pdf)
 Article in xml format
 Article references
 Send this article by e-mail
 Cited by SciELO
  Cited by Google
  Similars in
SciELO
Similars in
SciELO  Similars in Google
 Permalink
INTRODUCTION
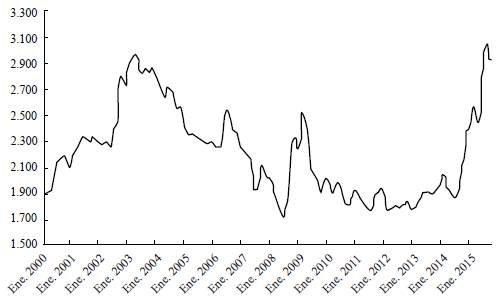
After a period of stability between 2010 and 2014, the Colombian peso experienced an unprecedented undervaluation. Figure 1 shows the exchange rate (peso/USD) from January 2010 to May 2016. At the end of September 2014, the exchange rate started to trend upward from around COP$2,007 per USD on September 25th, reaching its highest valuation on February 12, 2016, at COL$3,434 per USD. Depending on the period, the undervaluation may be as high as 50% or as low as 30%, approximately.
The transmission of exchange rate changes to domestic prices is known as Exchange Rate Pass-Through (ERPT). ERPT has been widely analysed in the literature. Although the findings of these analyses suggest the presence of such effect in different economies, most findings differ according to which methodology is used. Campa and Goldberg (2002, 2005) and Baqueiro, León and Torres (2003) measured the ERPT for a panel of countries, and find a partial effect that depends on the level of inflation of the economy, this being coherent with Taylor (2000), who found that high volatility is related to high levels of pass-through. Similarly, López-Villavicencio and Mignon (2017) measured variables related to the behaviour of monetary policy and its inflation volatility, finding that countries with a higher level of inflation and monetary uncertainty have a higher level of ERPT.
Delatte and López-Villavicencio (2012) used asymmetric cointegration models to measure the effect of an appreciation and depreciation of the currency and found that the pass-through has a heterogeneous effect, where a depreciation has a higher effect than an appreciation. Choudhri, Faruqee and Hakura (2005) and Ito and Sato (2008), using VAR models, measured the ERPT for different countries and found evidence of an incomplete effect. Recently, Brun-Aguerre, Fuertes and Greenwood-Nimmo (2017) used the non-linear auto-regressive distributed lag (NARDL) for 33 developing and developed countries to measure the asymmetric effect of exchange rate variations on inflation prices and found no conditional effect for the type of country. For Colombia, González, Rincón and Niño (2008); Rincón Caicedo, and Rodríguez (2007) and Rincón and Rodriguez (2014) found evidence of an incomplete effect on the consumer price index (CPI), with variations in the effect associated with the economic cycle.1
There is a lack of literature regarding ERPT into the prices of healthcare goods and services paid for by consumers. A likely explanation is that in most countries, consumers are "protected" by healthcare insurance, and therefore consumers do not face full prices but deductibles and coinsurance. Colombia's health system is mainly designed around the managed competition model. Funding comes from employee-employer mandatory contributions and general taxes. Private insurers compete for members nationally and receive a risk-adjusted capita per member from the government to cover a government-defined benefits package. Providers compete to be included in the insurer's networks. Additionally, there is a private market for supplementary health insurance. Public providers are mostly dominant in rural towns while private providers are abundant in highly populated cities.
Figure 2 shows the relationship between the exchange rate (ER) of the Colombian peso to US dollar (COP/US) and inflation measured as the yearly change in the Consumer Price Index (CPI) for all goods and services and that of healthcare goods and services. Both graphs give an initial approximation on the effect of ER on both general and healthcare inflation. Based on the graphs, the ERPT of both series can be described as unequal, as the general inflation exhibits higher sensitivity to changes in exchange rate than healthcare, especially to the depreciation of recent years. It can be expected that the ERPT of general inflation be higher than that of healthcare.

Source: Departamento Administrativo Nacional de Estadística (DANE).
Figure 2 ER and General CPI, ER and Healthcare CPI in Colombia
Taking advantage of the unprecedented depreciation of the peso, our goal is to test whether there is an ERPT into the Healthcare CPI in Colombia and its subgroups (i.e., over-the-counter medicines, etc.) and if there is, what its magnitude is. This question is of policy relevance for at least two reasons. First, Colombia is perhaps the country with the lowest out-of-pocket (OOP) expenditure as a percentage of total healthcare expenses in the developing world, at 14% (Fan & Savedoff, 2014). At the same time, the country is in severe financial distress, which has policymakers discussing the possibility of increasing OOP as a way to find additional financial resources for the system. Second, for equity reasons, an unexpected increase in consumer prices of healthcare goods and services may disproportionally affect vulnerable populations such as the poor and the elderly.
The effect was estimated using a FAVAR model following Bernanke, Boivin and Eliasz's (2005) approach, which has been widely used in the macroeconomic literature to analyse the impact of economic shocks (Kilian & Lütkepohl, 2017; Stock & Watson, 2016). This model takes into account the information contained in a large number of time series, to avoid the bias generated by using a smaller set of variables to model the relationship between the exchange rate and the health CPI and its components. The results of the model suggest that, although there is an incomplete effect of the exchange rate on the healthcare CPI, there is a significant effect of the ERPT on over-the-counter (OTC) medicines and durable medical equipment prices.
This study expands on the previous literature by tackling the concept of ERPT by focusing on a desegregated measure of inflation instead of the aggregate Import-Consumer inflation. We focus on healthcare inflation and its subgroups. This approach allows us to analyse a specific policy and market that traditional measurements cannot achieve. By using disaggregated indexes, we can trace the specific markets that transmit the effect to the general level of healthcare inflation, and so, understand the shock sources and transmission to design an optimal health policy. On the methodological side, the present study expands on the Colombian literature by using a novel econometric methodology to research ERPT in Colombia which tackles some of the critiques made of the previous methods used for the Colombian case. Furthermore, this econometric approach offers a comprehensive measurement of the effect of exchange rate on healthcare prices.
METHODOLOGY
The effect of unexpected innovations in the exchange rate on the healthcare CPI inflation and its components of expenditure is estimated using the methodology proposed by Bernanke et al. (2005), the Factor-Augmented Vector Autoregressive (FAVAR). The use of factors is related to the theory of rational expectations, as this measures all the information captured by the all of the variables that are used in the identification of the factor model. Therefore, the methodology overcomes most of the criticism made by Evans and Kuttner (1998) and Rudebusch (1998a, 1998b) about the VAR models. Their criticism is related to the bias generated in the Impulse Response Functions (IRF) by the inclusion of a scarce number of variables that do not characterize the economy adequately. Consequently, these factors allow for the introduction of more information, without losing many degrees of freedom and maintaining a relatively simple specification of the model.
FAVAR framework
As proposed by Bernanke et al. (2005), let Y t be vector Lx 1 of the L observable variables that are supposed to interact within the economic activity. In our case, this vector includes the different components of consumer health price indexes (one at a time), and the indicator of economic activity, and trade measurements. To capture the effect of additional information not included in Y t on each of its components, the FAVAR model includes a vector, Kx 1, of the K non-observable factors, F t . The latter vector summarizes all information that is available in the economic indicators that are not included in Y t . The number of factors (of dimension F t ) are expected to be few, as the aim of the methodology is to include as small a number of variables as possible to reduce the loss of degrees of freedom.
The factors may or may not have an economic definition, as they can be created as a general group (Bernanke et al., 2005) or as different groups of factors within economic activity (Belviso & Milani, 2006). In other words, the factors collect the available information in a wide number of economic variables that could not be included one by one in a VAR estimation.
Adhering to Bernanke et al. (2005), the FAVAR model can be expressed as
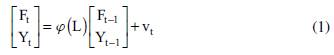
where ((Ι.) is a lag polynomial of order p, which may contain the a priori restrictions of the structural VAR, and vt represents the vector of errors that follows a normal distribution with mean zero and covariance matrix Q.
As pointed out by Bernanke et al. (2005), factors F t are unobserved, therefore model [1] cannot be estimated directly. The authors propose two identification methods: the two-step procedure and the Bayesian Likelihood approach. They conclude that both methods arrive at relatively similar results, but the first provides "plausible responses" without the highly computational and restrictive identification of the latter approach. Considering these findings, we employ the two-step method in this study. Following this approach, first, K is identified and F t estimated, and second, [1] is estimated using the estimates of F t .
Bernanke et al. (2005) propose that to identify the number and the factors, the method put forward by Stock and Watson (2002, 2005) and Bai and Ng (2008) should be used. In other words, they suggest using a Dynamic Factor Model (DFM). The DFM implies the decomposition of a set, i, of observable time series (X it ) as a distribution of the lags of a small set of unobserved factors, f t , and an idiosyncratic error, u. it . The factors can be expressed as the following equation,

where X
it
represents the set of the series i = 1…,n; whereas

 is the vector of the dynamic loadings of order s; f
t
is the vector of the q unobserved factors; u.
t
are the idiosyncratic innovations; and t the analysed period t = 1,...,T.
is the vector of the dynamic loadings of order s; f
t
is the vector of the q unobserved factors; u.
t
are the idiosyncratic innovations; and t the analysed period t = 1,...,T.
The DFM model can be expressed as a static model with r factors,

where F has a larger dimension than f , as it includes the dynamic and static factors. The number of static factors can be expressed as r = q (s + 1).Principal Component Analysis (PCA) is used to estimate the factors and the selection of the number of factors is determined using the information criteria presented in Bai and Ng (2002, 2007) for DFM.
The common components of
 , are estimated using the first principal of PCA. As the information contained in C
t
is a lineal combination of F
f
and Y
t
, a particular order cannot be imposed for the VAR identification of the innovation. Henceforth, the information in C
t
that is not represented by Yt,
, are estimated using the first principal of PCA. As the information contained in C
t
is a lineal combination of F
f
and Y
t
, a particular order cannot be imposed for the VAR identification of the innovation. Henceforth, the information in C
t
that is not represented by Yt,
 , needs to be estimated. The estimation is carried out by dividing the series into "slow-moving" and "fast-moving" variables. Each classification depends on how each variable responds contemporaneously to Y
t
, where variables that do not respond contemporaneously to shocks (like economic activity) are slow-moving. Consequently, variables that respond contemporaneously (such as financial asset prices) are fast-moving. Then, the information contained in the slow-moving variables and Y
t
is extracted. The linear regression is determined using the following equation,
, needs to be estimated. The estimation is carried out by dividing the series into "slow-moving" and "fast-moving" variables. Each classification depends on how each variable responds contemporaneously to Y
t
, where variables that do not respond contemporaneously to shocks (like economic activity) are slow-moving. Consequently, variables that respond contemporaneously (such as financial asset prices) are fast-moving. Then, the information contained in the slow-moving variables and Y
t
is extracted. The linear regression is determined using the following equation,
where F
t
l
represents the factor estimated for the slow-moving variables.
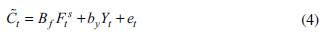
 is calculated as the difference between the common components C
t
and Yt, constructed as
is calculated as the difference between the common components C
t
and Yt, constructed as
 . Then, the estimated factors
 are used to estimate the VAR model expressed in [1]. In this particular case, a Cholesky Decomposition is needed to estimate the IRF from [1], and the exchange rate is the last variable.
DATA AND RESULTS
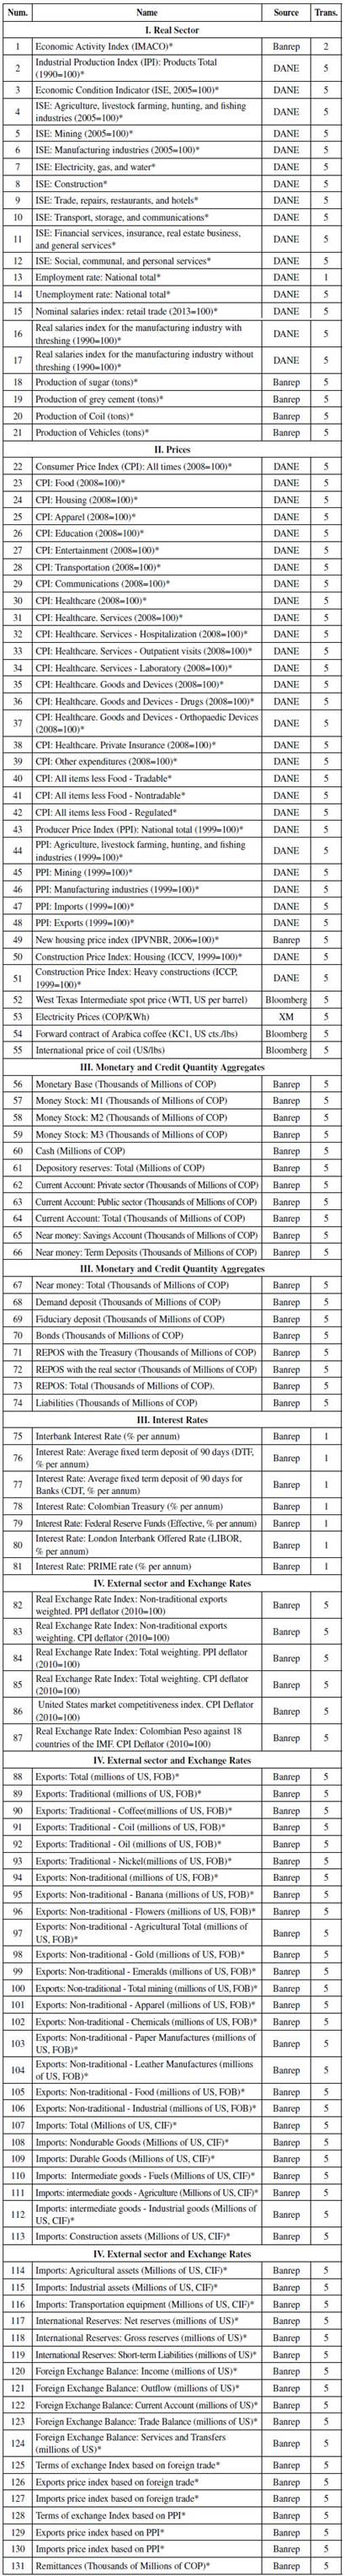
To analyse the effect of the Exchange Rate on the Healthcare CPI (and its components), a database of 131 monthly economic variables was created. These variables span from January 2000 to December 2015.2 Because most of the series originate in the 2000s, previous years cannot be analysed in our FAVAR framework. The main sources of data are the national statistics agency -Departamento Administrativo Nacional de Estadística (DANE)- and the data repository of Colombia's Central Bank.3 All series were periodically adjusted, if necessary, following the X13-ARIMA algorithm. These series were then transformed to induce stationarity.4
Using the stationary transformation of the original series, the number of static and dynamic factors to be included in the model are determined following the information criteria provided by Bai and Ng (2002, 2007). The results of the information criteria suggest the use of static factors 8, 5, 3, and 1.5 As there is no clear evidence that suggests which of the information criteria offers better results, the selection of the number of factors is determined by the number of factors used in Sargent and Sims (1977), Bernanke et al. (2005) and Londoño, Tamayo and Velásquez (2012). Their applications suggest the use of two or three factors, without losing the robustness of the results. This is related to the fact that three factors normally explain at least 60% of the information of all the variables. In the present case, our results are similar. Hence, there are three factors included in our model, consistent with the information criteria and previous studies mentioned.
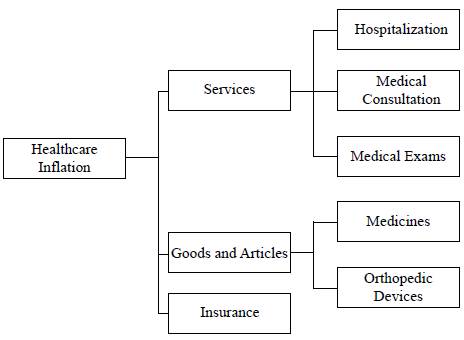
To analyse the effect of the exchange rate on the CPI of healthcare goods and services, the estimation of the FAVAR is expanded to each one of its groups and subgroups. Figure 3 shows the grouping of goods and services included in the Colombian healthcare CPI. The three principal groups of healthcare inflation are Services, Goods and Articles, and Insurance. The subgroups of each are divided into those corresponding to Services: hospitalization, medical consultation and medical exams, and those of Goods and Articles: medicines and orthopedic devices. Because both Services and Insurance are not intensive in terms of import products or services, it is expected that the ERPT of the components be low or non-existent. Goods and Articles may have the contrary effect, as Colombia is not a net producer of either, and so they could be exposed to the effect of changes in the ER that affect their internal prices, and therefore, their ERPT.
The results of the present study are based on the measurement of the Exchange Rate Pass-Through, defined as the median ratios of the impulse responses of healthcare prices to exchange rate shocks. The orthogonal impulse response functions (IRF) for each expenditure component of the Colombian healthcare CPI are shown in Figures 4 to 9. The IRFs were estimated using a FAVAR with 12 lags and three factors. Confidence intervals of 95% were estimated using bootstrapping methods with 10,000 runs.6 The impulse is generated by the novelty of an increase of one percentage point in the exchange rate growth.
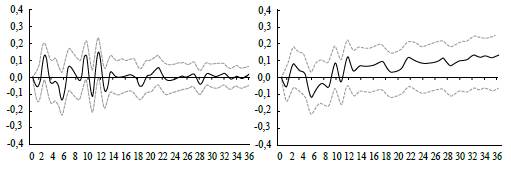
Note: The left panel represents the IRF and the right panel the cumulative response of the shock. Source: Authors' calculations.
Figure 4 Response and Cumulative Response Function of the Inflation Rate
Figure 5 presents the IRF of an ER change in the total Healthcare Inflation rate. There is a significant increase in inflation for only the second month of about 0.2. In the case of the cumulative effect (Figure 5), the only meaningful period corresponds to the interval between the second and fourth month. In conclusion, the ERPT effect produces an incomplete effect on health care CPI inflation in the short run, especially in the first four months, and the effect tends to stabilize to 0.1 in the long run.
Note: The left panel represents the IRF and the right panel the cumulative response of the shock. Source: Authors' calculations.
Figure 5 Response and Cumulative Response Function of the Healthcare Inflation Rate
Based on Figures 4 and 5, it can be concluded that the expected effect of the ER shock on healthcare inflation is greater than the general inflation response in the short term. The expected effect on the healthcare CPI inflation is, at times, greater than 0.2, contrary to general inflation, estimated at 0.1. This result means that the effect of an exchange rate shock has a higher impact in the months immediately following it, which may influence consumers with an inelastic price-elasticity of demand to a greater extent. Although the effect in the short term on healthcare inflation is higher, the cumulative effect on general inflation increases steadily in the long term, contrary to that of healthcare which stabilizes at 0.1 following the first year.
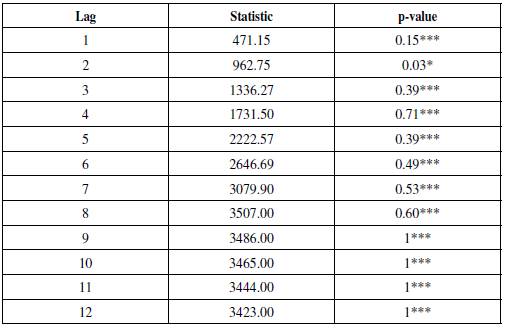
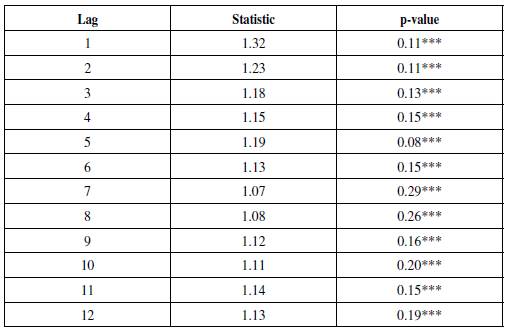
In the long run, the effect can be measured by the Forecast Error Variance Decomposition (FEVD) of the healthcare CPI inflation rate (Table 1). This measurement allows us to estimate the contribution of each factor used in the FAVAR model to the h-step forecast error of the total consumer health basket inflation rate. Based on this result, apart from the healthcare inflation itself, the ER contributes to a significant portion of the healthcare forecast variance.
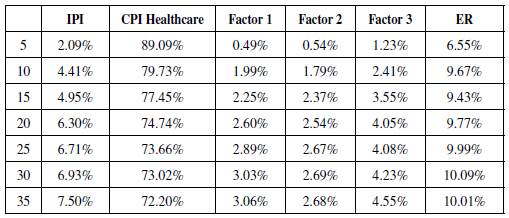
In sum, there is an ERPT into the total healthcare basket inflation rate, nonetheless, the effect is not complete, and does not exceed 0.3 percentage points in the short term and 0.1 percentage points in the long term.
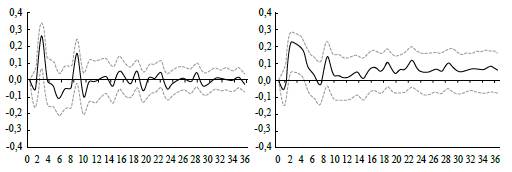
Turning our attention to groups and subgroups of the healthcare basket to explore whether the effect on the aggregated health CPI holds for the divisions of goods and services, [1] is re-estimated using the corresponding groups and subgroups in Y. Figures 6 - 8 present the results of these estimations.
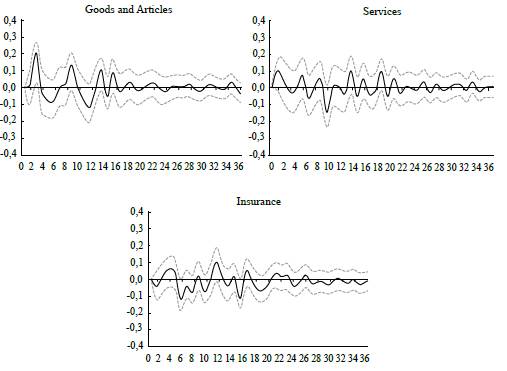
Note: Impulse responses (bootstrapping with 5% and 95% confidence intervals) of healthcare subgroups' inflation to an exchange rate shock: Goods and Articles, Services, and Insurance. Source: Authors' calculations.
Figure 6 Response Function of the Inflation Rates of the Healthcare Basket Groups
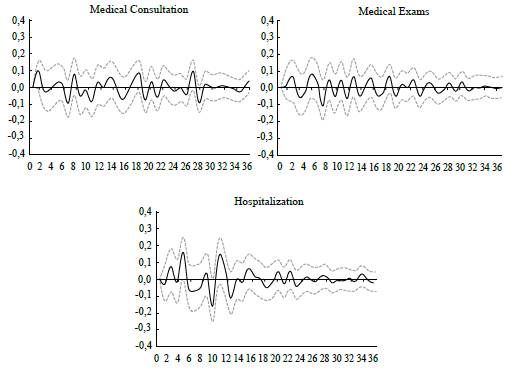
Note: Impulse responses (bootstrapping with 5% and 95% confidence intervals) of Services subgroups' inflation to an exchange rate shock: Medical Consultation, Exams, and Hospitalization. Source: Authors' calculations.
Figure 7 Response Function of the Inflation Rate of the Subgroup Services
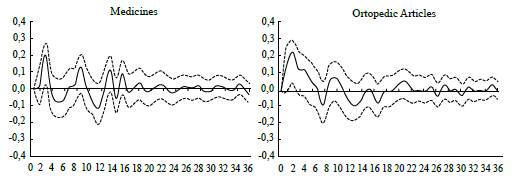
Note: Impulse responses (bootstrapping with a 5% and 95% confidence intervals) of Goods and Articles subgroups' inflation to a shock of the Exchange rate: Medicines and Orthopedic Articles. Source: Authors' calculations.
Figure 8 Response Function of the Inflation Rate of the Subgroup Goods and Articles
Results show that the effect of the ERPT on healthcare CPI inflation is mainly explained by the subgroup Goods and Devices, as there is not a significant effect on either of the other two components, Services and Insurance. This was expected because the latter are not imported input intensive, while medical devices are typically not produced in Colombia.
DISCUSSION AND CONCLUSIONS
In the context of an unprecedented depreciation of the Colombian peso against the US dollar, the existence and the magnitude of the exchange rate pass-through to the Healthcare CPI in Colombia and its subgroups was studied. The results of low levels of ERPT are consistent with the study by Aron et al. (2014) on emerging markets with floating exchange rates. Nonetheless, the result of the ERPT to healthcare inflation was lower than the effect on the general level of inflation in the referenced literature (between 0.7 and 0.3).
The evidence shows the existence of a slightly low ERPT to consumer healthcare prices, explained by an increase in the price of imported devices not covered by the defined national package (i.e., hearing devices). Within this category of goods, the effect is shared by both medicines and orthopaedic devices, but the effect is bigger for the latter.
There are two policy implications. First, the ERPT to consumer healthcare prices is relatively low in comparison to the general ERPT and to the measurements for emerging countries presented in the literature (see Aron et al., 2014). This means that the Colombian healthcare system effectively protects consumers from ER volatility. Thus, ER volatility may not be a reason for the government to increase the share of OOP to help finance the current deficit in the system.
Nonetheless, imported goods are critical to the healthcare provision of medical services, and as such, protection comes at a cost to either providers or insurers. Providers may control costs by lowering the quality of their imported inputs, and insurers by increasing waiting times for elective surgeries, especially those where the imported inputs represent a significant share of the cost.
Second, for equity reasons, the government may need to regulate consumer prices for those items that hit the pockets of vulnerable populations hardest, such as non-covered medical devices and OTC drugs (Prada, Duarte & Guerrero, 2015). Further research may focus specifically on the non-covered and highly demanded retail drugs and their price changes in response to the fluctuations of the exchange rate.
One limitation of the present study is that the Colombian healthcare system has a particular structure and context; the market frictions and agents' dynamics are a unique case among world health systems. For example, the government subsidises some drugs covered in the universal health plan. Thus, the results, and thus the real effect of the ER, may be distorted by the distinctive characteristics of the Colombian system. Hence, the previous results cannot be easily compared or extrapolated to other emerging economies, with similar macroeconomic characteristics but different health systems.
Another limitation of the study is that the identification scheme can be uninformative if the goal of the analysis varies. The estimated ERPT depends on the identification scheme selected. In our case, the Cholesky identification scheme was used and thus, the principal source of shock is the exchange rate, and so, the measurement will be the median effect of the exchange rate shock. As argued by Forbes, Hjortsoe and Nenova (2015), different sources of shock have an impact on the magnitude of the ERPT. Their methodology may be more informative than the present procedure, but it implies the imposition of a higher number of restrictions on the model to isolate the shock and desired effect. In the present study, the variation in healthcare prices is the result of interest, especially in the context of the price regulation policy. For the Colombian government, regulating the price of a few components may be more efficient than coordinating a monetary policy with the Central Bank to reduce price variations in the health sector. Nevertheless, further research should combine both methodologies to determine the sources of the variations in the health components of medicine and orthopaedic aids.