


 English (pdf)
 Article in xml format
 Article references
 Send this article by e-mail
 Cited by SciELO
  Cited by Google
  Similars in
SciELO
Similars in
SciELO  Similars in Google
 Permalink
INTRODUCTION
Standardized test scores play a central role in determining college admission decisions in developed and emerging countries. As Chetty et al. (2011) have shown, the results obtained in these tests are potentially correlated with future academic and labor opportunities. For that reason, there has been a substantial increase in the courses offered by schools and other educational institutions to prepare students for these exams.
In recent years, supplementary tutoring, also known as shadow education1, has become a common practice in the United States of America and several countries in Asia (China, Republic of Korea, South Korea, Taiwan, and Vietnam) and Europe (Turkey and Switzerland). This practice has caught the attention of educational researchers, as it is unclear whether additional preparation has a positive and significant effect on academic achievement, even though it is a common, time-consuming and often expensive practice.
It has also been of interest to policymakers because only some students have access to preparatory activities, potentially creating a gap between students from different socioeconomic backgrounds. If this is the case, the preparatory activities could be exacerbating the already unequal access to higher education for students who are at risk. The massification of supplementary tutoring has also been a concern for schools, parents and government officials, since these activities may generate perverse incentives for schools to teach to the test, disregarding other essential factors of education, and for teachers to provide lower-quality education within the school system, leaving the responsibility of teaching to coaches outside school (Jayachandran, 2014).
In an attempt to accurately estimate the effect, there is a large body of literature that studies the effect of test preparation on student performance using an ample variety of methodologies (instrumental variable, propensity score matching and nonparametric methods, among others). However, the results of these studies have not been conclusive. Besides, few studies have attempted to quantify the effect of getting prepared at different types of institutions, and whether the duration, it is an important factor in assessing the effectiveness. Furthermore, the literature that studies the heterogeneous effects of preparation by socioeconomic strata and type of school (public vs private) is very scarce.
To the best of our knowledge, no efforts have been made to econometrically quantify the effect of test preparation on achievement for a Latin American country. The objective of this paper is to gain a better understanding of the relationship between test preparation and the results in the Colombian high school exit examination (Saber11). This paper also aims to assess the heterogeneous effects of preparation on specific subgroups (gender, socioeconomic strata, type of school). Additionally, this study contributes to the literature by examining the effect of getting prepared at different sites (schools, test preparation institutions, universities) and analyses whether the duration of these activities may lead to different results.
The rest of this paper is organized as follows: Section 2 reviews the academic literature that has studied the effects of test preparation on achievement. Section 3 describes the Colombian educational system. Section 4 presents an overview of preparatory activities for the Saber11 examination. Section 5 describes the theoretical framework used in this article. Section 6 presents descriptive statistics of the dataset used for the analysis. Section 7 describes the methodology employed for the analysis and discusses the specification of the model. Section 8 reports the main results. Section 9 presents the results of the robustness checks. Section 10 provides a discussion of the main results and policy implications, and Section 11 presents conclusions.
LITERATURE REVIEW
In the United States, a country with a long tradition administering standardized tests, there is a consensus that participation in preparatory activities can lead to an increase in SAT scores. However, the magnitude of the effect is still a matter of debate. According to Briggs (2002), at least thirty-four studies have been published since 1953. evaluating the effect of coaching on SAT scores. For instance, Domingue and Briggs (2009) use a representative longitudinal sample of high school students in the United States and propensity score matching to determine the effect of preparatory activities on SAT scores. The results of Domingue and Briggs (2009) indicate that students who took the PSAT (equivalent to a mock SAT) and had some other type of preparation scored higher in math. However, they did not find a statistically significant effect on language. Buchmann, Condron, & Roscigno, (2010) find that students from the most-advantaged families are more likely to engage in private tutoring, and the tutoring they receive is of the highest quality. Byun and Park (2012) assess the effect of two types of private tutoring: commercial test preparation courses and one-to-one tutoring, on SAT performance for different racial/ethnic students. Using OLS regressions, the authors find that commercial SAT preparation courses have a positive and significant effect only for East Asian American students, and one-to-one tutoring did not display any effect for any of the racial/ethnic students.
Several studies have also examined the effect of private tutoring on academic performance outside of the United States. Dang (2007) uses household survey data, containing information about household expenditures in private tutoring and (self-reported) academic performance of students in Vietnam, to analyze the effects of preparatory activities on exam performance. Dang (2007) finds that private tutoring can help improve the performance of primary and secondary students. For the case of South Korea, using OECD's PISA results, Choi, Calero, & Escardíbul. (2011) find that the effect of the time spent in private tutoring activities depends on the specific subject that is being examined. The results show that the effect is positive for mathematics, positive but decreasing for reading, and non-significant for science. In a similar study, Ryu and Kang (2013) also examine the causal effect of private tutoring expenditures on the academic performance of middle school students in South Korea using instrumental variables. The results indicate that higher expenditures on private tutoring have a positive but fairly small effect. Ryu and Kang's (2013) results reveal that a 10-percent increase in overall expenditure is related to an improvement of 0.03 SD (Ryu & Kang, 2013).
For China, Zhang (2013) uses an instrumental variable approach and a hierarchical linear model to show that private tutoring has a mixed and heterogeneous effect on mathematics and language in the National College Entrance Exam (NCEE). Zhang and Liu (2016) also study the Chinese case using a propensity score matching approach, differentiating between four types of private tutoring according to the size of the tutoring class. Their results reveal that, in general, private tutoring has no significant effects on the results obtained in the NCEE, even after accounting for class size. Only large class size tutoring in mathematics has a significantly positive effect on the NCEE scores, and only for rural students is the effect quite considerable (0.248 S.D.).
For the case of students in junior high schools in Taiwan, Kuan (2011) observes a small effect that mathematics cramming programs have on mathematics performance. This researcher also shows that students who are more likely to attend cram schools benefit less from math cramming compared to students who are less likely to attend or who come from less-advantageous social backgrounds. Liu (2012) also finds that cram schooling has a positive effect on analytical ability and math performance. However, the positive effects of cram schooling decrease when cram schooling hours are extended.
Studying the effect of private tutoring for a European country, Hof (2014) finds a heterogeneous and nonlinear effect on the academic outcomes for Swiss students in reading and mathematics in the PISA-2009 examination using nonparametric methods. Accounting for non-random selection, Gurun and Millimet (2008) assess the causal effect of private tutoring on the probability of university placement in Turkey. Their results show that private tutoring has a negative causal effect on a university placement.
As reviewed in this section, several researchers have contributed to the literature that studies the relationship between test preparation activities and levels of achievement. However, there is still much ground to cover in this area of research. As was highlighted throughout this review of the literature, there are mixed results in the existing literature, even within a country, that justifies more research on this topic. Furthermore, preparation activities are very different in each of the cases studied in the literature. The activities conducted in tutoring sessions differ in type, quality and quantity (for a more comprehensive discussion, see Bray, 2014).
Additionally, the evidence for Latin America is very scarce. To the best of our knowledge, only one effort has been made to try to understand the effect of preparation on achievement for the Colombian case. Such an effort was made by Hernandez (2011). This researcher uses the scores from the 2009 Saber11 examination and the results from a survey conducted in schools to demonstrate that there is a relationship between test performance and the type of preparation. The results reveal that performance depends on the degree of involvement in the test preparation activity offered at the school, and not on the socio-cultural context of the individuals enrolled at the educational institution. However, these results cannot be used to determine the effect of preparation on academic performance quantitatively.
Therefore, this paper contributes to the literature in several ways. First, we contribute to the search for new and better ways to understand the relationship between test preparation and educational achievement in a Latin American context. Second, we quantify the effect of preparation in academic performance by characterizing the effect of the different institutions that offer preparation activities and by incorporating into the analysis the duration of the preparatory activities. Third, unlike previous studies, we use census data of students who took the same exam on the same day, which allows us to obtain reliable and generalizable estimates for the population studied.
COLOMBIAN CONTEXT
The Colombian Educational System is divided into four levels: pre-school, basic (primary and secondary), upper secondary and higher education. The first compulsory level of education in Colombia is pre-school. Students usually enroll in pre-school at age 5. At age 6. students go on to basic education (Grades 1-9 for 6-14-year-olds) where they complete two sub-levels: primary school (Educación Primaria - 5 academic years) and lower secondary school (Educación Secundaria -4 academic years). At age 15-16. students start upper secondary school (Educación Media - 2 academic years), and upon successful completion, they receive the bachiller certificate. In our dataset, the average age of students at graduation is 16.83 years old (Table 1).
Some students enrolled in upper secondary school attend classes in the morning and the afternoon (full time - jornada única). However, other students go to school only for half a day, either in the morning or the afternoon, at night or during the weekends. The students enrolled in a full-time schedule spend on average 8 hours at school every day, whereas students enrolled in a morning, afternoon or night shift only spend 4 to 5 hours per day.
To qualify for higher education studies, all students must take the Saber11 exam. According to Colombian Law2, High School Principals have to report a list of all students who are currently enrolled in the last year of Upper Secondary School so that they get registered to take the Saber11 examination. The Colombian nation-wide high school exit exam, administered by the Colombian Institute for Educational Evaluation (ICFES), was first established more than forty years ago in order to provide support to universities and other higher education institutions in their admissions processes. Throughout these years, the exam has gone through a series of significant changes to capture the needs of the educational system in Colombia. The exit examination was initially conceived as an exam to test specific contents, but in the year 2000, it became an exam to test competencies.
The Saber11 exam is divided into two main components: the core subject component (eight subjects) and the flexible component. The core subject's component is compulsory for all test takers, and it evaluates language (Spanish), mathematics, biology, chemistry, physics, social sciences, philosophy, and English. The flexible component has two different types of tests: advanced skills and interdisciplinary. The advanced skills exam tests one of the core subjects at a higher level of complexity. Students can choose from language (Spanish), mathematics, biology and history. The flexible component exam tests multidisciplinary problem-solving skills. The results for each of the core subjects are reported on a 0 to 100 scale, with an average score of 50 and a standard deviation of 10 (ICFES 2010). A global score that measures the performance in all areas of the exam is also calculated as the weighted average of the score obtained in all the subjects3. According to ICFES guidelines, the scores are calculated using a standardization process constructed using Item Response Theory (IRT).
Tertiary institutions are autonomous to decide their admissions criteria. However, the most selective universities in Colombia use the Saber11 results as their only criteria. Other universities use a set of admissions criteria to determine admittance to a program, including a combination of Saber11 results, interviews and other specific tests.
PREPARATORY ACTIVITIES FOR THE SABER 11 EXAMINATION
Earning a high score on the Saber11 examination is crucial because these results are used in Colombia as a filter to be admitted to higher levels of education, to qualify for scholarships and to be accepted when applying for jobs. Every year, the Ministry of Education organizes a special event, The Night of the Best (La Noche de los Mejores), to recognize those students who obtained the highest scores in the Saber 11 examination. Fifty students receive a full scholarship that includes tuition, board, books and transportation. High school officials are also interested in the Saber11 results because these scores are used to construct rankings and are often interpreted as a measure of the school's quality. For instance, the Ministry of Education constructs an Index, The Synthetic Index of Education Quality (Índice Sintético de Calidad Educativa - ISCE), to rank schools based on the results that students obtain in the Saber examinations (Ministerio de Educacion 2017). The Colombian media have also used the results of the Saber11 exam to construct rankings of what they consider to be the best academic programs. A nationally recognized magazine, Revista Dinero (2017), publishes a special issue every year titled "The Best Schools in Colombia According to the Saber11 exam". This magazine ranks the quality of schools using the average results obtained by students at different institutions in the Saber11 exam. Individuals' perceptions of the education offered at different schools are influenced by these rankings, and the parents of prospective students often incorporate this information in their decision-making process. In sum, these rankings can affect the reputation of a given institution.
Students enroll in preparatory activities with the hope of achieving higher scores. The main preparatory activities offered to students are courses at i) a school with a schoolteacher, ii) a school with external faculty, iii) a university and iv) a private educational institution commonly known as a pre-ICFES institute. The courses offered by a university or a pre-ICFES institute are considerably more expensive and require more time and dedication from families and students in comparison to preparation activities at school. Some students also choose to take the Pre-Saber exam, which is a diagnostic test that students can take approximately six months before taking the Saber11 exam. Both tests are similar in structure and are administrated by ICFES.
A considerable percentage of students in Colombia get prepared at school. Schools have incentives to offer these courses because their quality is classified based on the Saber11 scores obtained by their students (rankings). Furthermore, private schools use these rankings for advertisement purposes if they do well. Public schools that perform well in the exam use the results to obtain additional resources from the government. The percentage of students who get prepared at their own schools is around 70%. The remaining 30% get enrolled in other courses that have a cost such as the courses offered at universities and pre-icfes institutes4.
In the year 2012. ICFES decided to include a survey that students had to answer the day of the exam with questions about the preparatory activities. Those students who took the examination had to fill out the survey before the test started. The mandatory survey contained questions about the following: i) whether the student prepared for the test, ii) the institution where the preparatory course took place (at school with one of the school's teachers, at school with external faculty, at a University or a private educational institution commonly known as a pre-ICFES institute), and iii) the time spent on preparation. It should be acknowledged that this information comes from students' self-reports. It is possible that some students stated being prepared when in fact they did not, and those who received preparation might not have reported it. This reporting error seems more likely in the case of students who were prepared at school by their teachers. Some students may not recognize the difference between a preparatory activity and their regular classes. If preparation has a positive effect on the result, then these errors in self-reported information would generate a negative bias. Unfortunately, with the available data, it is neither possible to detect nor correct this error. According to this survey, the activities of the different preparatory courses are relatively homogenous. The teachers usually provide explanations about a particular topic, and then students practice answering multiple choice questions. Most of the courses also include a mock exam. Nevertheless, the survey showed that the intensity of the courses in terms of months differed among types of preparation.
The costs of preparatory activities can be relatively high in Colombia. For instance, the cost of a preparatory course offered at a certified Pre-ICFES institute can be as high as 4'800,000 Colombian Pesos (using an exchange rate of 2.900 COP/USD, it is approximately 1,724 USD), which is approximately 7.8 times the monthly minimum wage in Colombia. Furthermore, the cost of preparatory courses at universities can range from 400,000 COP to 1.700,000 COP, which is still an exorbitant cost for a family that earns one or two minimum wages. According to a survey conducted by ICFES in 2014. the cost of preparation at schools varies widely depending on the school, and it is the less-expensive alternative. Students pay on average between 200,000 COP and 300,000 COP for courses offered at school by external faculty5. These costs can vary dramatically by location. Capital cities are more likely to offer specialized courses and, usually, have the most expensive programs.
A pre-test, known as Pre-Saber, could be taken by anyone who signed up and paid for it, and it has the same duration and structure of the Saber11 examination. The cost of the Pre-Saber examination is approximately 56,000 Colombian pesos (which is approximately the equivalent of two daily minimum wages in Colombia). Some students, especially those facing financial difficulties, are unable to pay for these preparatory activities, and therefore, they only receive preparation at their own schools or do not receive preparation at all.
THEORETICAL FRAMEWORK
The literature on the economics of education provides models of schooling decisions using an educational production function. We consider the education production function model, proposed by Hanushek (1979) and Todd and Wolpin (2003), as the framework for estimating the effect of test preparation activities on students' performance on the Colombian High School Exit Examination. Following Todd and Wolpin's (2003) notation, let T i be a measure of achievement for student i. In this model, the inputs are given by the choices that are being made by parents and schools. F represents the vector of inputs supplied by the parents at a given age, and S represents the vector of school-supplied inputs. D. denotes external factors. In this case, the preparatory activities affecting student i are modeled so that they are included as part of the inputs supplied by the parents and schools. The student's endowed ability is denoted as μi and a measurement error in test scores as εi. The production function is represented as:

Missing data for past inputs can become problematic at the time of estimation. To overcome that problem, Todd and Wolpin (2003) formulated a specification that only depends on contemporaneous measures of school and family inputs. This contemporaneous specification is adopted in many empirical studies because of the limited availability of historical input measures or historical test score results. The implementation of a contemporaneous specification assumes that εi is an additive error that includes any omitted factors, including past inputs and endowed capacity, and the possibility of measurement error. Therefore, the residual term in equation (1) includes all the omitted factors.
To date, the literature has identified several factors that are considered to be determinants of students' educational outcomes. Hanushek (1986) points out that the inputs included in an educational production function should be relevant to the students under study. Following the structure of the educational production function described previously, in this research educational achievement of a given student at a particular point of time is presented as a function of the characteristics of the student's family, the characteristics of the schools and teachers, and innate abilities of the student (Hanushek 1986).
Family background variables can play a crucial role in educational achievement (Haveman & Wolfe 1995; Häkkinen, Kirjavainen, & Uusitalo, 2003; WoBmann, 2003). In this article, we included two variables to account for family background: parental education and socioeconomic strata. Parental education is incorporated into the analysis because WoBmann (2003) and Häkkinen et al. (2003) have shown that students whose parents have a higher level of education have better academic results. This could be explained by the genetic transmission of skills from parents to kids, and the cultural environment that highly educated parents provide, which fosters learning. The socioeconomic strata, our proxy for the income level of the families, is also essential for the analysis because as Davis-Kean (2005) and Belley and Lochner (2007) have shown, family income is also related to achievement.
According to Gamoran and Long (2007), the characteristics of the school also have an important impact on academic performance. In this article, several variables, for which there is data availability, are included to account for school characteristics. Some of the variables included are school location, school meeting time (shift) and school type (public/private).
The preparatory activities affecting student i are modeled so that they are included as part of the inputs supplied by the parents and schools affecting the educational production function. A large body of literature, including the contributions of Briggs (2002), Domingue and Briggs (2009), and Dang (2007), have studied the effect of test preparation on student performance on standardized examinations but the results from these studies have not been conclusive.
DESCRIPTIVE STATISTICS
We use cross-sectional data from the Saber11 examination administered in the second semester of 2012. Even though the results of the examinations in all subjects are available, we restricted the analysis to the global score and the scores in mathematics and language. However, our analysis could be extended to study other subjects that are also tested in the Colombian High School exit examination. We analyze the global score because Universities and scholarship-granting institutions in Colombia use it for their admissions and scholarship selection processes. The results in mathematics and language are also reported because these two subjects capture two essential competencies: quantitative ability and verbal ability. Additionally, these two subjects have been widely considered in previous studies about the effects of preparation.
The availability of a rich database provided by ICFES with information about the students' socioeconomic background, schools' characteristics, preparatory activities and Saber11 results opens new possibilities for the analysis of the relationship between test preparation activities and levels of performance. We considered several family and individual control variables. At the individual level, we included two variables in the analysis: gender and age. The variables we considered to account for family characteristics are parental education (mother's/father's highest schooling level), household economic status6 (strata), whether the mother is a stay at home mother, whether the household has an internet connection and area of residence (urban or rural). Two additional variables were included to account for school characteristics: the type of school (public or private) and the school's shifts (full-time, morning only, afternoon only, evening only, or Saturday only).
As for the variables to study the effects of preparation, we considered whether the student participated in a preparatory activity or not, the institution where preparatory activities took place (at school with one of the school's teachers, at school with external faculty, at a University or a private educational institution commonly known as pre-ICFES institute), and the time dedicated to these activities (measured in months).
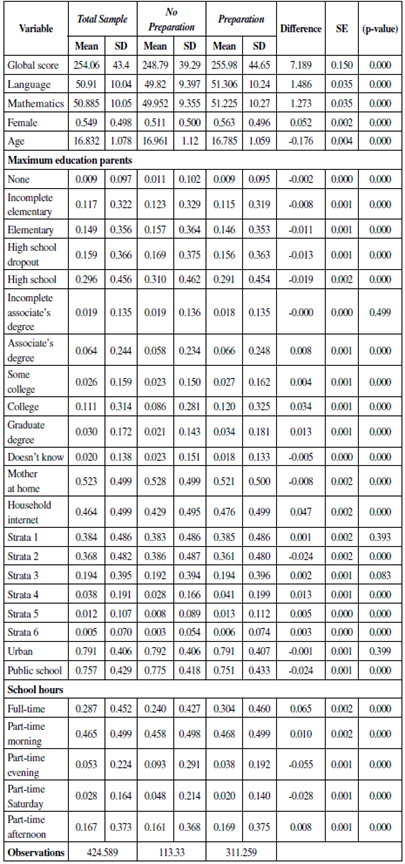
The original database has information from 549.823 students. However, to analyze a more homogeneous group, we restricted our analysis to students in the age range between 14 and 21 years old (92.6% of the complete sample). We also did not include in the analysis observations that have missing values for the key variables used in the regressions. Our final dataset contained information of 424.589 students (77% of the complete sample). Table 1a shows the descriptive statistics of this final (clean) database7.
Column 1 of Table 1a shows that the global score average is 254 points, and the standard deviation is 43. The average score in the math and language examinations is 51 points, with a standard deviation of 10. In the clean dataset, the average global score is four points higher in comparison to the original dataset. In the case of the clean dataset math and language exams, the average score is one point over the original distribution. This implies that those students who were dropped from the sample had lower scores in the examination. Column 1 also presents the descriptive statistics of the variables that capture the family background, personal and school characteristics. In general, the students in the sample can be characterized by the following traits: they live in urban areas (79%), belong to a low-income family (75% correspond to strata 1 and 2), attend a public school (76%), and most of their parents did not receive a college education (73%). In addition, there is a higher percentage of girls than boys (55% girls) in the sample, and the average age is 16.8 years old.
Columns 2 and 3 of Table 1a present a comparison of the characteristics of those students who participated in a preparatory activity for the Saber11 exam (treatment group) and those who did not (comparison group). There are systematic differences. If we compare the test scores by treatment (preparation), the average outcome in the math, language and global categories for those students who were treated slightly exceeds the average of those students who did not receive the treatment. The differences are 7.2. 1.5 and 1.3 points, respectively (0.16. 0.15 and 0.13 in a normalized Z-score), and they are all significantly different from zero (column 4). However, it is unclear whether the differences between the two groups are caused by the preparatory activities, the time spent on those activities or because the two groups differ in some relevant observed characteristics that affect their outcomes on the exam.
In fact, by examining the observed characteristics, it is possible to determine that those students who were treated tend to have more-favorable socioeconomic characteristics in comparison to their counterparts. The descriptive statistics (Columns 2 and 3 -Table 1a) show that a higher proportion of the treated students have the following characteristics: they spend more time at school (full-time, all morning or all afternoon), belong to a higher socio-economic stratum (strata 4. 5 and 6), and their parents have a higher level of education (high school, college and graduate degree). All these differences are statistically significant (Column 4). Other variables, such as the share of students residing in urban areas (75%), are similar between the two groups.
As part of the analysis, we also considered where the preparatory activities took place and the different durations. Table 1b presents descriptive information about the places where the preparation was conducted, by duration. Students are unevenly divided among the different places and the different durations. As reported in Table 1b, 71% of the students took a course at school (45% with school staff and 26% with external staff), 9% took a course at a Pre-ICFES institute, 1% took a preparatory course at a local University, and 18% of the students enrolled in preparatory activities at more than one place. There are also significant differences in duration. For instance, according to our data, 61% of the students who enrolled in a Pre-ICFES course participated in that activity for more than three months. On the other hand, 71% of the students who took a course at school, taught by school faculty, reported duration of fewer than three months.
Table 1b Preparation by institution and duration
| Preparatory Activity - Institution | Less than 1 month | Between 1 & 3 months | Between 3 & 6 months | More than 6 months | Total | % students by activity |
|---|---|---|---|---|---|---|
| School - School staff | 51,263 | 47,729 | 24,187 | 16,262 | 139,441 | 45% |
| (% by duration) | 37% | 34% | 17% | 12% | 100% | |
| School - External faculty | 16,866 | 27,565 | 26,170 | 10,471 | 81,072 | 26% |
| (% by duration) | 21% | 34% | 32% | 13% | 100% | |
| Course (Pre-ICFES Institution) | 3,848 | 7,545 | 12,357 | 5,554 | 29,304 | 9% |
| (% by duration) | 13% | 26% | 42% | 19% | 100% | |
| Course (University) | 885 | 1,108 | 1,141 | 392 | 3,526 | 1% |
| (% by duration) | 25% | 31% | 32% | 11% | 100% | |
| Several | 8,939 | 17,351 | 15,341 | 14,340 | 55,971 | 18% |
| (% by duration) | 16% | 31% | 27% | 26% | 100% | |
| Total | 81,802 | 101,299 | 79,197 | 47,020 | 309,318 | 100% |
Source: Authors' calculations.
Differences between the treatment and the comparison groups cast doubts on the validity of the estimates obtained using a linear method that does not compare comparable students. Therefore, in addition to OLS, we also use a Propensity Score Matching (PSM) methodology.
METHODOLOGIES
In this research, two econometric methods are used for the data analysis: 1) cluster-robust ordinary least squares, and 2) propensity score matching. The application of both methodologies will be explained in more detail below.
Ordinary Least Squares
To obtain a first estimate of the relationship between participating in test preparation activities and the score obtained in the Saber11 exit examination, we use an ordinary least squares regression model. However, to take into consideration the hierarchical structure of the dataset (i.e., students are enrolled in different schools), we employ a cluster-robust version of the model that corrects the standard errors for within-cluster error correlation. Specifically, we considered student-level cross-sectional data with school clustering8.
Propensity Score Matching
The matching process must be performed considering a full range of variables across which the students in the treatment group and the students in the control group might differ to eliminate potential bias. However, considering a full range of variables can be problematic in terms of dimensionality (Heinrich, Maffioli, & Vazquez., 2010). Therefore, it is necessary to make use of the propensity score matching (PSM) technique. Using PSM, we can tackle the dimensionality problem by defining a propensity score that allows us to carry out the analysis using a single dimension. In other words, instead of trying to match all values of the variables, by using PSM, we compare students based on propensity scores (Heinrich et al., 2010).
Two conditions should be met to implement the propensity score matching methodology. First, the variables on which the treatment and control groups differ have to be observable (the conditional independence or unconfoundedness assumption). Our database, which contains a complete set of information about the students who take the Saber11 examination, can help us meet that condition. Second, the common support or overlap condition should be met (Heinrich et al., 2010), which is visually tested.
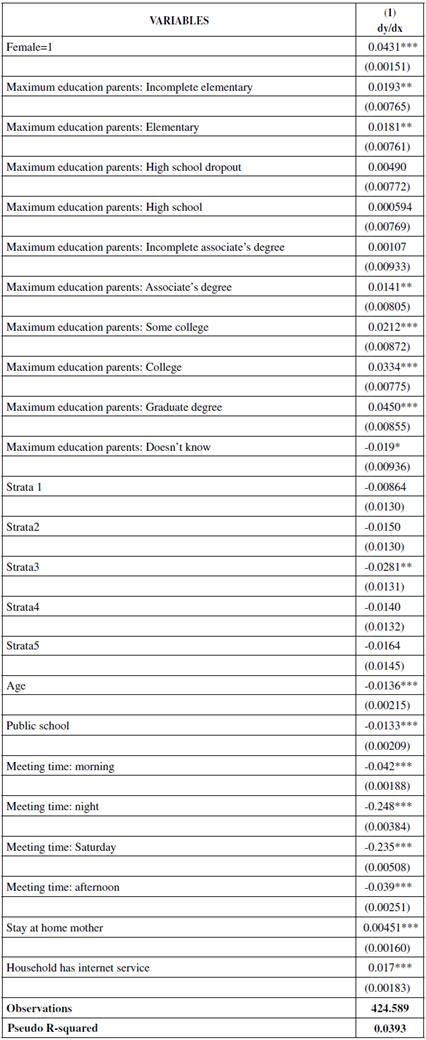
The first step to implement the propensity score matching method is to estimate the propensity score. In this case, the propensity score captures the probability of participating in Saber11 preparatory activities. Considering that the treatment status is dichotomous, a probit model is estimated. In this case, we estimate the following model:
PREPARATION = f (GENDER,PARENTAL EDUCATION,PUBLIC SCHOOL, SCHOOL LOCATION,MEETING TIME,SOCIOECONOMIC STRATA) (2)
The variable choice is guided by the conditional independence assumption that requires that the outcome variable be independent of treatment conditional on the propensity score. In other words, only variables that influence the participation decision and the outcome variable simultaneously, and those variables that are unaffected by participation were included in the analysis (Caliendo & Kopeinig, 2008). The choice of the matching variables was also based on the theoretical framework discussed in Section V and the previous empirical studies cited in the literature review. Table 2 provides a description of the variables included in the model used to estimate the probability of participating in Saber11 preparatory activities. Table 3 reports Probit estimates for the propensity score. Most of the variables considered in the analysis are significantly related to the probability of participating in preparatory activities. The fact that those variables are significant, and the signs of the coefficients are as expected is a good sign of result suitability.
Table 2 Description of the Variables Included in the Probit Model
| Description | |
|---|---|
| Gender | Specified as a dummy variable for female students (Female = 1). |
| Age | This variable is included as a continuous variable. |
| Parental Education | We include dummy variables to measure the highest level of education achieved by the parents of the student: incomplete elementary, elementary, incomplete High School, High School, incomplete associate's degree, associate's degree, incomplete college, college, and graduate degree. The omitted category is no education. |
| Public School | Specified as a dummy variable (Public School = 1). Approximately 76% of the students attend public schools. |
| School's Meeting Time | We include dummy variables to take into account that some schools in Colombia have different meeting times: morning, afternoon, night, Saturday. The omitted category is full time. |
| Stay at Home Mother | About half of the mothers of the students in our sample are stay at home mothers. We include mothers at home to control for the fact that these mothers may be spending more time monitoring their children's duties, including pre-test preparation. Specified as a dummy variable (The students' mother stays at home = 1). |
| Household has Internet Service | Specified as a dummy variable (Internet service = 1). |
| Socioeconomic Strata | Proxy for family income. Law 142 of 1994 mandates the use of stratification to classify Colombian population in distinct groups (strata) with similar social and economic characteristics. Housing characteristics are the main criteria used for this classification. There could be six strata: level one is lower-low, two is low, three is upper-low, four is medium, five is medium-high, and six is high. The omitted category in our empirical exercise is Strata 6. |
Source: Authors' calculations.
Table 3 Probit on Preparation for the Saber11 Examination - Complete
Standard errors in parentheses * p<0.10, ** p<0.05. *** p<0.01
Source: Authors' calculations.
A fundamental step to investigate the validity of the PSM estimation is to verify the common support condition (Heinrich et al., 2010). This condition warrants that units with the same characteristics have a positive probability of being either participants or nonparticipants. For this empirical exercise, we check the condition of common support between treatment and comparison groups by visually inspecting the propensity score distributions. Figure 1 presents the kernel distribution and the common support area for those students who got prepared for the exam [treated] and those who did not [untreated]. As the graph shows, there is a high degree of overlap in the propensity scores of the treated and untreated units. In other words, the characteristics observed in the treatment group are also observed in the control group (Caliendo and Kopeinig, 2008). The common support condition guarantees that each treated student has a matching unit in the group of untreated students.
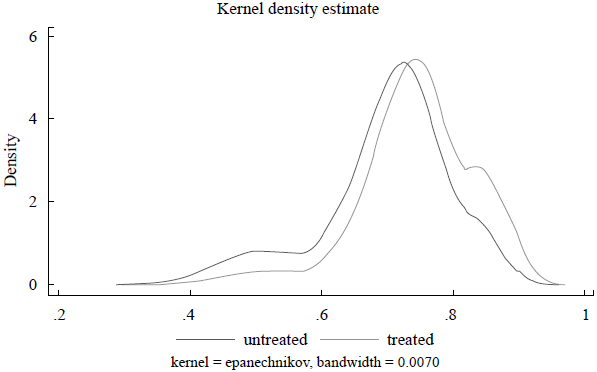
Source: Authors' calculations.
Figure 1 Kernel distribution and common support area across the 2 groups - Complete Sample
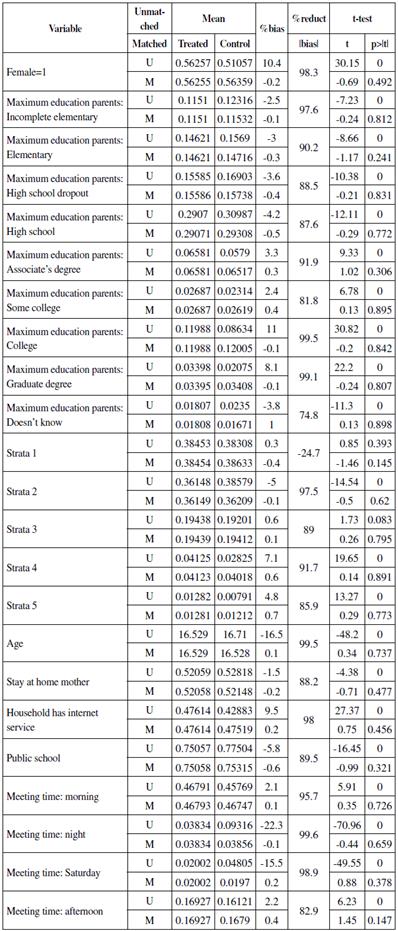
Table 4 presents evidence of covariate balance after matching. T-statistics for the equality of covariate means demonstrate that those students who participated in a preparatory activity and those who did not have very similar observable characteristics within each block in all cases. There were no significant differences in the means of the covariates between the treated and the control groups. The bias before and after matching, and the change in this bias, is also reported for each variable. We conclude that the balancing property is satisfied.
RESULTS
This section presents the results of the regression analysis on the relationship between participation in preparatory activities for the Saber11 examination and the scores obtained in the Saber11 examination.
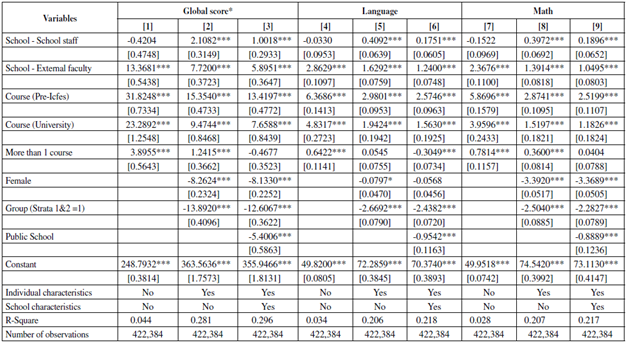
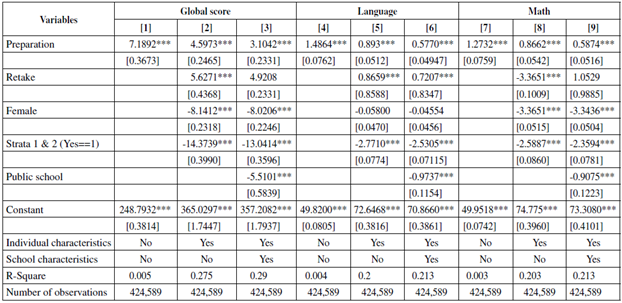
The results obtained using ordinary least squares are presented in Table 5. The specification without control variables, or naïve specification (Columns 1. 4 and 7), show that the effect of the preparation is positive and significant. The results reveal that the effect of the preparation is 7.2. 1.5 and 1.3 points on the results of the global examination, the language and the mathematics examinations, respectively. Columns 2. 3. 5. 6 and 8 in Table 5 present the results of the specifications that control for observable characteristics of the individuals and the schools. The inclusion of these variables attenuates the effect of preparatory activities. This implies that preparatory activities are highly correlated with observable individual and school characteristics. The results for these specifications indicate that participation in preparatory activities increases the global score by 3.13 points, the language score by 0.58 points and the math score by 0.59 points. The magnitude of this effect is modest if we consider that the standard deviation of the global, the language and the mathematics scores is 43.4. 10.04 and 10.05 points, respectively. In other words, the preparatory activities increase examination scores by approximately 0.058 to 0.07 standard deviations (SD). It should be noted that our measure of preparation includes activities that are offered both at school and out of school. Approximately 45% of the students were prepared at school by in-house staff, while only 9% at a pre-ICFES institute. The pre-ICFES institutes have personnel specialized in these tests, while most schools don't, which could explain at least in part why our results seem to be modest.
Table 5 OLS estimates of the effect of preparation on Saber 11° performance*
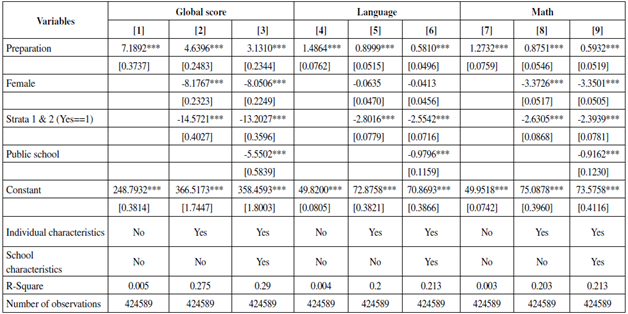
Notes: *SABER Global Score is calculated as a weighted average of the five subjects. Individual characteristics are age, highest level of education of parents (references level is none education) and area of residence (reference level is rural area). School characteristics is meeting time (references levelis full-time). Standard errors in square brackets.
* p<0.10, ** p<0.05. *** p<0.01.
Source: Authors’ calculations.
Our results can be contrasted with other results reported in the literature to get a better sense of the effect. Using an instrumental variables approach, Ryu and Kang (2013) find that a 10 percent increase in private tutoring expenditures raises the average overall score by 0.03 standard deviations (S.D). It should be noted that these researchers find an even smaller effect using a matching strategy (Ryu & Kang, 2013). Zhang and Liu (2016), estimate an OLS model and find a positive effect of large class mathematics tutoring of 0.248 S.D. In the case of small group language (Chinese) tutoring, they find a positive effect of 0.293 S.D. In sum, our results show a more substantial effect in comparison to Ryu and Kang's (2013) findings but are very modest in comparison to Zhang and Liu's (2016). Nevertheless, it is worth highlighting that the test preparation activities evaluated in these studies differ to those activities evaluated in our study.
Another way to have a better sense of the magnitude of the effect of the preparatory activities on exam performance is to compare the coefficient of the variable that captures preparation with the coefficients of other variables that were found to have a sizeable effect on academic performance in previous studies for Colombia. Table 5 reports the coefficients for gender, socioeconomic status and the nature of the institution (private or public). The results reveal that being female, belonging to socioeconomic strata 1 and 2. and studying in a public school have a negative and significant effect on the scores in the three examinations. These findings are in line with the results found in other studies for Colombia (Chica, Galvis, & Ramírez, 2011; Núñez, Steiner, Cadena & Pardo; 2002; Tobón, Posada, & Ríos, 2009; Gómez Soler 2016; 2017). In the most comprehensive specification (Columns 3. 6 and 9), being a woman reduces the global score by 8 points (0.18 SD). Hence, preparation activities seem to have a minimal effect if we compare the results discussed above with the results obtained for the preparation (treatment) variable.
The average treatment effect on those students who participated in preparatory activities (ATT), which was estimated using propensity score matching (PSM), is presented in Table 6. In line with the results that were obtained using cluster robust ordinary least squares, the estimates obtained with PSM show a positive and significant effect of preparation on the global score. Specifically, the results obtained using the five nearest neighbors algorithm indicate that participation in preparatory activities is associated with an increase in the score of 3.94 points in the global score, 0.75 points in language, and 0.76 in the math test. As shown in Table 6. the results are robust to the matching algorithms employed for the analysis. It should be highlighted that even though the effect obtained using the matching technique is larger than the effect using cluster robust OLS, it is still fairly small.
Table 6 Impact of Preparation - Propensity Score Matching
| Nearest Neighbor | 5 Nearest Neighbors | Caliper Matching 0.001 | |||||||
|---|---|---|---|---|---|---|---|---|---|
| SUBJECT | Diff. | S.E. | z | Diff. | S.E. | z | Diff. | S.E. | z |
| Global Score | 4.316*** | 0.350 | 12.32 | 3.939*** | 0.171 | 23.04 | 4.326*** | 0.296 | 14.60 |
| Mathematics | 0.773*** | 0.079 | 9.83 | 0.763*** | 0.042 | 18.06 | 0.775*** | 0.084 | 9.23 |
| Language | 0.865*** | 0.054 | 16.11 | 0 749*** | 0.047 | 15.91 | 0.867*** | 0.066 | 13.04 |
| Observations On Support | 424,559 | 424,559 | 424,378 | ||||||
| Observations Off Support | 30 | 30 | 211 | ||||||
| Observations | 424,589 | 424,589 | 424,589 | ||||||
Note: each column reports the matching estimator with a different matching algorithm (1) nearest neighbor matching using 1 nearest neighbor (2) nearest neighbor matching using 5 nearest neighbors (3) caliper matching with a caliper of 0.001. The standard errors reported are bootstrapped standard errors. *p<0.10, **p<0.05. ***p<0.01.
Source: Authors' calculations.
Heterogeneous Effects
An interesting question is whether preparation activities have a greater impact among the poorest, female, and public-school students, as these variables are found to have a large and negative effect on tests scores. It might be the case that preparatory activities can help close the gap in the scores of these subgroups. Tables 7a, 7b and 7c present the results of our heterogeneous effects regression by gender, socioeconomic status and public schools. The interactions of the preparation variable with the dummy variables for public schools and low-income students are negative and statistically significant. These results suggest that preparatory activities are less useful for low-income students attending public schools by approximately 5 points in the global score compared to their peers (0.12 SD). In contrast, the results for the interaction between the gender dummy variable (female=1) and the preparation variable show that preparation is more beneficial for female students in comparison to male students, as it increases their global scores by approximately 0.75 points (0.017 SD).
Table 7a OLS estimations of the heterogeneity of preparation on the Global Score
Individual characteristics are age, highest level of education of parents (reference level is no education) and area of residence (reference level is rural area). School characteristic is meeting time (reference level is full-time). Standard errors in [].
* p<0.10, ** p<0.05. *** p<0.01.
Source: Authors’ calculations.
Table 7b OLS estimations of the differential impact of preparation on the Language Score by Subgroup
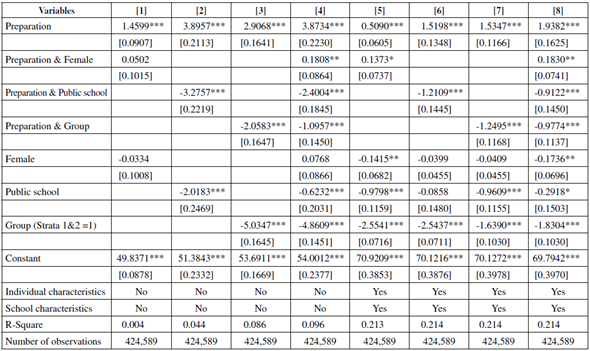
Individual characteristics are age, highest level of education of parents (references level is none education) and area of residence (reference level is rural area). School characteristics is meeting time (references level is full-time). Standard errors in square brackets
* p<0.10, ** p<0.05. *** p<0.01.
Source: Authors’ calculations.
Table 7c OLS estimations of the differential impact of preparation on the Mathematics Score by Subgroup
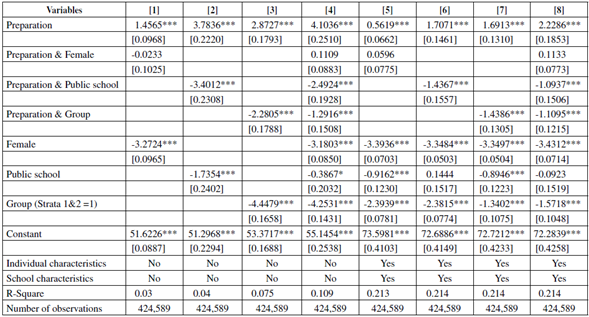
Individual characteristics are age, highest level of education of parents (references level is none education) and area of residence (reference level is rural area). School characteristics is meeting time (references level is full-time). Standard errors in square brackets.
* p<0.10, ** p<0.05. *** p<0.01.
Source: Authors’ calculations.
The results also show that, on average, a male student who attends a private institution and belongs to the highest socioeconomic status can increase his global score by 11 points by participating in preparatory activities. This corresponds to an increase of 0.25 SD.
Preparatory Activities and the Effects of Duration
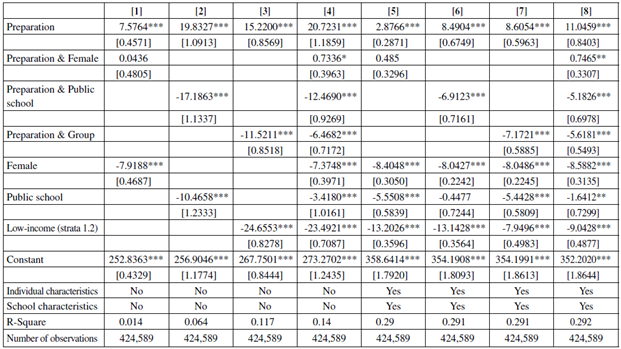
The data we employed in this study contains information about both participation in preparatory activities and the institution where these activities took place. This is especially important because the quality and the duration of the activities offered by each of these institutions might be very different. Table 8 presents the results by institution. After controlling for individual and school characteristics (Table 8column 3), we find that enrolling at a Pre-ICFES institution increases the global score by 13.42 points (0.3 SD). Participating in a preparatory course offered by a university increases the global score by 7.66 points (0.18 SD). Meanwhile, preparatory activities offered at school increase the global score by 5.89 (0.14 SD) points if taught by external faculty and by only 1 point (0.02 SD) if taught by school staff. The effect on language and math is very similar, if not identical.
Table 8 OLS estimates of the effect of preparation type on Saber 11° performance*
Notes: *Saber Global Score is calculated as a weighted average of the five subjects. Individual characteristics are age, highest level of education of parents (references level is none education) and area of residence (reference level is rural area). School characteristics is meeting time (references level is full-time). Standard errors in square brackets.
* p<0.10, ** p<0.05. *** p<0.01.
Source: Authors’ calculations.
We also controlled for the time spent on preparatory activities. The duration was measured in the following categories: less than one month, between 1 and 3 months, between 3 and 6 months, and more than 6 months. However, as students could enroll in preparatory courses in more than one place, they could also report a different duration for each place. To define a unique duration for each student, we use the maximum duration of all the preparatory activities reported by a student. Table 9 reports the results of the effect of course duration on test scores. The results show that preparatory activities that last longer than three months have a significant and broad impact on test scores. More specifically, we found an effect of between 0.18 and 0.28 SD depending on the subject. On the other hand, activities that last less than one month have a negative effect. However, the magnitude of this negative effect is quite small, approximately 0.07 SD.
Table 9 OLS estimates of the effect of duration of preparation on Saber 11° performance*
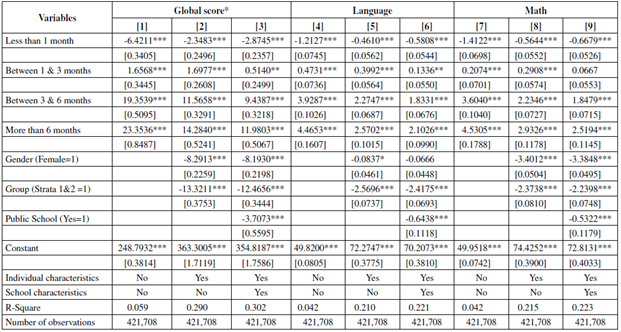
Notes: *Saber Global Score is calculated as a weighted average of the five subjects. Individual characteristics are age. highest level of education of parents (references level is none education) and area of residence (reference level is rural area). School characteristics is meeting time (references level is full-time). Standard errors in square brackets.
* p<0.1. ** p<0.05. *** p<0.01.
Source: Authors’ calculations.
Robustness Checks
We run robustness checks using subsamples that include additional information on the students taking the examination. First, we estimate a specification using the subset of students who took the Pre-Saber exam to control for ability differences before taking the Saber11 examination. We lost some observations, but the sample is still large (37,263 students). Table 10a reports the results. All the estimates are consistent but slightly smaller compared to the estimates in Table 5.
Table 10a OLS estimates of the effect of preparation on Saber 11° Global Score* with PRE-Saber subsample
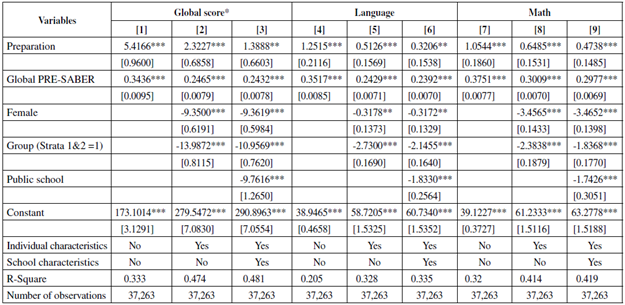
Notes: *Saber Global Score is calculated as a weighted average of the five subjects. Individual characteristics are age, highest level of education of parents (references level is none education) and area of residence (reference level is rural area). School characteristics is meeting time (references level is full-time). Standard errors in square brackets.
* p<0.1. ** p<0.05. *** p<0.01.
Source: Authors’ calculations.
Second, we consider a subset of students who were randomly questioned about their educational aspirations after high school graduation. We use this variable as a proxy of motivation because it is highly likely that those students who plan to go to college are more motivated to perform better on the Saber11 exam. Table 10b shows that when including the motivation proxy, all the estimates are also consistent but are slightly smaller compared to previous estimates.
Table 10b OLS estimates of the effect of preparation on Saber 11° performance with motivation subsample
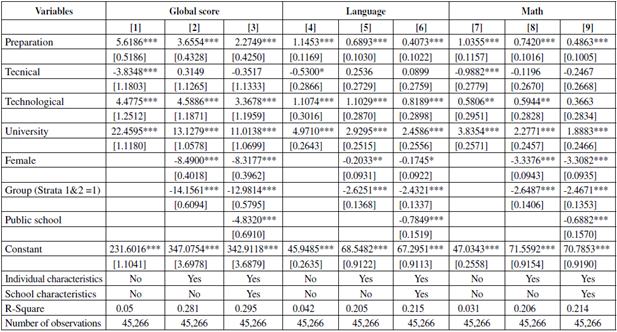
* Saber Global Score is calculated as a weighted average of the five subjects. Individual characteristics are age, highest level of education of parents (references level is none education) and area of residence (reference level is rural area). School characteristics is meeting time (references level is full-time). Standard errors in square brackets
* p<0.10, ** p<0.05. *** p<0.01
Source: Authors’ calculations.
We estimated another specification controlling for those students who took the Saber11 examination more than once. Table 10c presents the results. All the estimates are consistent but are slightly smaller compared to the estimates presented in the results section. This suggests that retaking the test does not have the same effect as taking a preparation course.
Table 10c OLS estimates of the effect of preparation (accounting for retaking the test) on Saber 11° performance*
Notes: *SABER Global Score is calculated as a weighted average of the five subjects. Individual characteristics are age, highest level of education of parents (references level is none education) and area of residence (reference level is rural area). School characteristics is meeting time (references level is full-time). Standard errors in square brackets.
* p<0.10, ** p<0.05. *** p<0.01.
Source: Authors’ calculations.
The results of the robustness checks are consistent with our previous findings, where preparatory activities tended to have a modest effect. As expected, our results show that omitting variables such as previous ability and motivation could lead to an overestimation of the effect. Therefore, it is likely that the effect of the preparation is even more modest than the results with the complete sample suggested.
DISCUSSION OF THE RESULTS
Getting prepared for the Colombian exit examination is associated with a 3-point increase (0.06 of a standard deviation) in the global score of the test. On average, this result seems modest in comparison to other interventions studied in the literature (Krueger, 2003; Banerjee, Cole, Duflo, & Linden, 2007). However, this small effect could significantly affect students who are close to the cutoff point of some scholarship programs awarded by the government. For example, three points could have been the difference for approximately 2.200 low-income students who in the year 2014 were a few points away from meeting the eligibility criteria for one of the most important government programs of the last years, Ser Pilo Paga (SPP-which stands for Being Smart Pays Off). SPP was a merit-need-based scholarship that covered the full cost of tuition at an accredited (high-quality) university in Colombia. The Colombian government awarded this scholarship to 10.000 students every year from 2014 to 2018. for a total of 50.000 students. To be eligible, prospective students had to obtain a score above a certain threshold (310 in 2014). The program had no strings attached, but the beneficiaries had to be in good standing at their programs.
The heterogeneous effects of preparation on students from more-vulnerable socioeconomic backgrounds are considerable. Our results demonstrate that students who participate in preparatory activities and are enrolled in public schools earn 5.2 points less (0.12 of a standard deviation) than those enrolled in private schools. Furthermore, low-income students earn 5.8 points less (0.13 of a standard deviation) than middle- and high-income students. These findings suggest that preparatory activities do not narrow the academic achievement gap of students from vulnerable socio-economic backgrounds.
Factors such as motivation and quality of the preparatory activities - which are not directly measured in our complete model- might also be captured in our results. Motivation is a particularly important factor. The slight difference in examination results between girls and boys may be due to both participation in preparatory activities and motivation. Considering that girls are between 20 and 40 percent less likely to participate in preparatory activities, it is possible that those who decide to participate in preparatory activities are more motivated to make good use of the additional materials and preparation, resulting in slightly better results than boys. As part of our research, we included robustness checks to analyze the possible effects of motivation; however, this factor should be further explored in future research.
The quality of the preparatory activities - which is often associated with costs - is another factor that may explain our results. Although the dataset does not allow us to unravel the effects of the quality of the preparatory activities, we were able to verify that insofar as the training is more effective, the chances of enrolling in the activity are considerably reduced for low-income students. The only preparatory activity for which the odds ratios are in favor of low-income students studying at public schools is the activity offered at school with in-house staff. The literature has shown that the education offered at public schools in Colombia is, on average, of lower quality than the education offered at private institutions (Angrist, Bettinger, Bloom, King, & Kremer, 2002), making it reasonable to conclude that the activities offered to the most vulnerable students are of lower quality. In that sense, the participation of low-income students in preparatory activities at their own schools may be perpetuating the achievement gap in the standardized examination. An intervention that should be considered by the local education authorities is to offer professional development to the teachers in public schools who are providing the preparation instruction.
Lowering the costs of high-quality preparation materials may contribute to decreasing the gap caused by unequal access to preparatory activities. As a response to this, the Colombian government has published free study materials on the ICFES web site. They have also distributed additional resources in the national newspaper. However, some students might not be able to obtain this material, because internet access is not universal in Colombia, and the newspaper has a cost. We consider that further actions should be taken. For example, the Government could send study materials directly to the schools to guarantee their availability without additional costs. The government could also offer differentiated rates, by socioeconomic stratum, for the Pre-Saber examination registration fee.
It is important to note that a necessary condition for low-income students to take full advantage of the available materials for preparation is for them to obtain adequate instructions about how to use these materials (Murnane & Willett, 2010). Therefore, in addition to the provision of materials, it is essential to have facilitators who can distribute this material and can explain its use and its scope adequately. In fact, Murnane and Willett (2010) have shown that having close supervision of how students use these materials in their preparatory activities is a key factor in the success of this initiative.
CONCLUSIONS
The returns of preparation, in terms of improving test performance, appear to be modest. We find that, on average, participating in a preparatory activity is associated with a 0.06 SD increase in the global scores on the exit examination. The results indicate that only those students who are enrolled in a Pre-ICFES institution and spend more than three months preparing, experience gains of up to 0.25 SD in their global score.
We also find that those students who benefit less from preparatory activities are public school students and students of low socioeconomic strata. This finding may suggest that preparatory activities can exacerbate the already unequal higher education opportunities. However, we cannot rule out that this finding may have been influenced by unobservable characteristics of the students, such as low motivation. Even though we included robustness checks to test the possible effect of motivation, this factor should be further explored in future research.
There are some limitations of this study that should be acknowledged. Given the non-experimental nature of the data, there is no guarantee that our results can be analyzed as causal estimations of the effect of preparation. However, it is important to highlight that we have taken special actions to reduce the risk of an erroneous estimate of the effect: i) we employed a rich data set, which provides a good set of observable variables and outcomes, ii) we use propensity score matching to properly compare treated and untreated cases, and iii) our results are robust when we take into account some measures that proxy non-observed variables such as ability and motivation.
Our results suggest that schools, parents and teachers should not rely solely on preparatory activities as a sufficient strategy to achieve high scores in exit examinations. It is very unlikely for a student to achieve an excellent score exclusively as a result of a short-term preparation activity (especially if the activity lasts less than 3 months). Other factors can play an essential role in determining individual results. The literature has shown that teacher's efforts, school resources and family characteristics are particularly important in determining success. Students should obtain a broad and solid academic education during elementary and high school. Obtaining a high score on an exit examination often depends on the knowledge and skills acquired in earlier years. Enrolling in a preparatory activity is probably insufficient to excel if the student does not have a good educational background.


