Inglés (pdf)
 Articulo en XML
 Referencias del artículo
 Enviar articulo por email
 Citado por SciELO
  Citado por Google
  Similares en
SciELO
Similares en
SciELO  Similares en Google
 Permalink
INTRODUCTION
One of the most important chapters of the Colombian economy was the implementation of the market reforms in the nineties, which for some people sharpened, and for others, initiated a process of productive structural change based on a hypertrophy of the mining and energy sectors which, in turn, meant a decline in the agriculture and industry sectors, causing a noticeable loss in the ability to create jobs.
The speculative growth model based on external booms resulted in one of the worst economic crises in the country at the end of the last century, causing a scenario where several economic agents became financially fragile. Therefore, this document aims to observe if there is a direct connection between the phenomena of structural change and corporate financial fragility in Colombia.
The work empirically consists of two phases; one carries out a descriptive analysis where the value of the Thirlwall Law for the Colombian economy is estimated, and, the other, creates a Minsky-Foley financial fragility index for 1846 Colombian companies which report data to the SIREM database of the Superintendencia de Sociedades.
The index is analysed in order to find the general average of the sample and five macroeconomic sectors that are considered, from a review of the literature, to be the winners and losers of the reforms of the 1990s. The results are then preliminarily put together in a scatter plot in order to be able to make a conjecture about the connection between structural change and financial fragility. Based on the creation of the financial fragility index, several econometric models suitable for a short unbalanced data panel are estimated. The best model used for the entire sample and for nine productive sectors was that of fixed effects adjusted for robust errors.
In these models, the financial fragility indicator is taken as a dependent variable in accordance with macroeconomic variables of structural change and economic activity, and other financial microeconomics such as the Minsky effect, which is inspired by the second theorem of the financial instability hypothesis of Minsky (1992), where he mentions that during periods of prosperity the economy moves from stable financial relationships to more unstable ones due to greater indebtedness.
Several interesting results stand out. Firstly, two phenomena are theoretically and empirically connected which are rarely explained together in both orthodox and heterodox approaches. Secondly, Thirlwall's Law is estimated by finding four phases of structural change in the Colombian economy since 1990, and a new Minskian financial fragility indicator is developed. Thirdly, it shows how macroeconomic phenomena affect microeconomic variables, such as the financial fragility of each company. And in general, it is found that long-term Colombian economic growth has speculative characteristics because it is based on sudden external booms that end up impacting the financial balances of the agents.
The document has four main sections. The first is the background, the second is the theoretical framework, the third is the descriptive analysis for financial fragility and structural change, and the last is the econometric analysis of the data panel.
BACKGROUND
The academic efforts made to link structural change (SC) and financial fragility (FF) in Colombia have been few and far between; on the contrary, the issues have been approached separately, which is partly explained by the dominant theoretical position, the neoclassical view, which considers currency, debt and financing neutral with respect to real variables. But from the heterodox views, such as post Keynesian, structuralist, or French Regulation School approaches, the SC and the FF are rarely linked.
In this document the previous academic works in Colombia are reviewed and grouped together under the categories SC and FF from heterodox and neoclassical (orthodox) approaches in Table 1, which organizes horizontally the specialization of the work consulted in SC and FF. On the contrary, if we advance to intermediate positions, an interest in mixing the two topics is evidenced, just as the present investigation intends. Likewise, the inclination of the analysed work is presented vertically to neoclassical or heterodox positions.
Table 1 Bibliographic review of structural change and financial fragility in Colombia
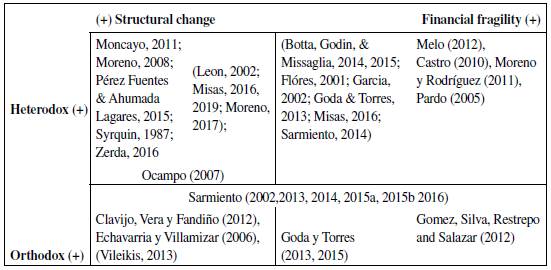
Source: Self-made.
Beginning with the selection of works studied by SC in Colombia, four different positions were found. The first is the orthodox explanation in which this process is approached as a natural force led by the free market, and explained from a micro-economic vision of static allocation of resources through factorial and sectoral substitution, also financed through loanable funds. This approach is represented by Echavarria and Villamizar (2006), Clavijo et al. (2012), Vileikis (2013), and Gómez and González (2017) who appear in Table 1 on the bottom left, given that they focus on explaning the SC from an exclusively orthodoxy point of view without linking monetary and financial factors.
The second derives from heterodox approaches to demand, such as (Kaldorian) Moncayo (2011); Moreno (2008), who mention the presence of a regressive SC in Colombia, that is, with negative consequences on factors such as the incentive to sectors with high productive sophistication, job creation, economic growth, and income distribution. This particular approach considers that it has worsened with the market reforms of the nineties in aspects such as currency and financial markets, the labour market, commercial and financial openness, social security systems, and in general reforms of the forms of the State (García , 2002; Misas, 2016). Some of the work in this field include Syrquin (1987); Moreno (2008); Moncayo (2011); Pérez and Ahumada (2015); Zerda (2016). These authors are located in the upper left corner of Table 1 given their specialization in sources and consequences of the SC.
The third position considers the SC as a political process in which the social class conflict and its interests are objectively manifested. Thus, the SC shows the history of exclusion from the Colombian accumulation model, led by productive and income extractivism, and managed by allied elites, while sometimes, taking into account foreign interests. This never allowed for the consolidation of an internal mass market, nor the possibility of resolving the conflict through democratic channels. From this point of view, there are investigations such as those from Leon (2002); Misas (2016, 2019); Moreno (2017). These authors are distributed differently from the previous ones in the Table 1 because, although, Leon (2002) only addresses SC explanations from multidisciplinary (heterodox) approaches and is located in the upper left corner of the table, the other authors indirectly address monetary factors in their SC explanations as income distribution.
The fourth position reflects the idea of the dominance of the balance of payments; in this vision we have Flóres (2001); García (2002); Goda and Torres (2013); Botta et al. (2014, 2015); Sarmiento (2014) and Misas (2016). They show that, after the 1990 reforms, the SC showed two periods of dependence on capital flows of the balance of payments, which impacted the exchange rate; in turn, inducing a regressive SC.
On the side of financial fragility (FF) we have two visions; one orthodox and the other alternative, and these, in turn, are divided into microeconomic and macro-economic analyses.
From the neoclassical approach, financial fragility arises from microeconomic imperfections that result in externalities on the financial sector. The work of Gómez et al. (2012) leans toward this direction given that it seeks to look at the relationship of capital flows and financial stability. It also studies the FF based on the probability of insolvency of firms based on some financial indicators. However, this work lacks a clear theoretical approach and obeys what Bejarano (1984) calls empirical without theory. But given that it is published in the Banco de la República, it is considered to be approved by orthodox standards; therefore, this work and the previous one are located in the upper right corner of Table 1.
The heterodox path of the study of financial fragility has been based on the post Keynesian Minskian approach that adapted the work of the Foley model (2003) to Colombia in three directions: one uses macroeconomic data to estimate the rate of profit, accumulation and financing, such as the works of Pardo (2005) and Rojas (2016). The second adaptation is done using data at a company level - Moreno and Rodriguez (2011). The third way was to theoretically improve the work of Foley (2003) by introducing changes in the Castro (2010) and Melo (2012) exchange rates. They appear in the lower right corner of Table 1 given their heterodox approach.
An additional dimension of Table 1 would show positions that have managed to reconcile the SC with the FF. For example, Sarmiento (2002, 2013, 2014, 2015a, 2015b, 2016) considers that opening the market to external trade caused a debacle in the industry as well as the agriculture sectors, together with a problem of persistent insufficient demand, which is remedied with credit to achieve full employment, but at the cost of greater financial fragility. This author appears in the centre of Table 1, slightly inclined toward heterodoxy, considering that he continues to use neoclassical tools such as the interest rate to balance the market of loanable funds and the IS-LM model.
Other works include those of Ocampo (2007) and Ocampo and Martínez (2011) which, from a neo-structuralist approach, address the relationship between SC and FF from the balance of payment movements that generate FF as a result of the external and internal credit cycle, which could be implicitly related to the SC.
Flóres (2001); García (2002); Goda and Torres (2013, 2015); Botta et al. (2014); Botta, Godin and Missaglia (2016); Botta (2017, 2018) argue that in Colombia the specialization in the exportation of commodities has caused a regressive SC produced by a real and nominal exchange rate appreciation due to a large flow of capital, which has, as a counterpart, a current account deficit due to the loss of competitiveness that destroys industry and national agriculture, added to the drainage of profits of multinationals abroad through the net factor resources account.
Therefore, this research aims to explain the connection between the SC and the FF from a Minskian microeconomic approach by creating a theoretical and empirically novel approach in order to study the case of the Colombian business sector.
RESTRICTED GROWTH DUE TO BALANCE OF PAYMENTS AND FINANCIAL INSTABILITY
A difficult problem in this section is to show the importance of studying the SC, the FF, and their interconnections, while, in turn, outlining the theoretical basis on which the explanation of the phenomenon in Colombia will be developed. The hypothesis is that the SC, understood as the change in the composition of employment, production, sectoral and global productivity, sophistication and diversification of the productive processes of an economy (Felipe, 2012), could explain the variations in the currency flows of the agents that participate in the economic activity, while modifying the accumulation of assets, liabilities, income generation, expenses, and finance, which are the basic forces of the FF. Therefore, if a society specializes in a certain sector, it will affect the job creation capacity, the source of the demand that drives the accumulation process that could come from abroad or from the internal market, the way in which wealth is distributed, the sources of growth, as well as the incentives for investment and innovation.
The SC is relevant because it can explain key variables such as changes in the demand for work, especially the reduction of informality, economic growth, sectoral and aggregate improvements in productivity, absorption and technological diffusion, increasing returns and division of labor into different levels of aggregation and income distribution (Cimoli & Porcile, 2015; Currie, 1989; Felipe, 2012; Hartmann, Guevara, Figueroa, Aristaran, & Hidalgo, 2017; Haussman, 2011; Hidalgo, Klinger, Barabasi, & Hausmann, 2007; Young, 1928). In addition to these works, this article seeks to relate the SC and the FF.
The SC is captured through the strong version of Thirlwal's Law1 ε = x ε x:y * / ε m:y = ε p / εc2, which is measured through the income elasticity ratio of exportation and importation; for example, an increase in the ratio would reflect a promotion of more complex sectors, allowing to penetrate more easily foreign markets, while on the other hand, it would reduce the demand for importations in favour of national production. In turn, Cimoli and Porcile (2014) relate the Thirlwall Law to the degree of diversification of the productive structure, which is observed in ε = hN, where N is the number of sectors and h is the slope that would show a positive relationship and a decrease between N and ε.
Thus, the introduction of the strong Thirlwall Law allows capturing (i.) the analysis of elasticities as a proxy of demand in the determination of the SC, (ii.) the change in the productive structure in the quotient variations, and (iii.) changes in the monetary income flows of the economy through demand elasticities. Therefore, the more diversified and homogeneous economies can take better advantage of the process of expanding economic activity and income, by capturing a greater volume of demand; in turn, bringing financial health to the balance sheets of entrepreneurs and other agents in the economy.
Precisely, the evolution of the financial balance of each company in the Colombian economy and the impact that the SC has on them is studied using the principle of financial instability3 of Minsky (1986, 1992, 2008), given that he recognizes the dynamics of capitalism, its inherently instability, and non-neutrality of internal and external financing4 on the volume of investment, production and employment.
Minsky (1986, 1992, 2008) considers that during the phases of the cycle the economic agents exhibit herd behaviour, so at take-off everyone is optimistic, the moneylenders begin to relax their credit standards and the borrowers begin to acquire new volumes of financing, whereas during a recession their behaviour changes to widespread pessimism, bringing about the liquidation of assets with a subsequent deflation of their price, causing a reduction in investment and consumption, in turn, dragging the economy into a recession. Later in the empirical section this cyclical movement is captured in the so-called Minsky effect, taken from the second theorem of financial instability (Minsky, 1992).
This author says that during upswing firms and lenders become more optimistic, so they take more riskier financial positions that compromise their expected income to debt services. For Minsky (1986, 1992, 2008), any economic agent, or firm in this paper, go through three different financial positions: First, a hedge position is when a firm has enough to make interest and principal payments. Second, firms go through a speculative finance phase in which the firm cover interest payments, but the principal must be rolled over. The last finance phase is called Ponzi finance and takes place when firms need to get other loans in order to pay interests, which is a very fragile scenario because it depends on lender willingness to grant loans.
In order to adapt the financial instability principle to the entrepreneurial context of Colombia, Foley's (2003) work was used, which mathematically formalizes the categories of hedge finance, speculative finance, and Ponzi finance. In order to understand the dynamics of financial fragility firms', three rates of growth are recognized: profit rate (r), asset growth rate (g) and the cost of funding measured by the interest rate (i). Therefore, in his chapter, the author presents the different paths that can occur when these rates differ.
Hedge finance is characterized by having higher income flows than the levels of accumulation and the payment of debt service, so r > i or r > g. Speculative finance happens when the accumulation rate is greater than the profit rate, but the profit rate is higher than debt payment. Inasmuch as g > r, the firm must finance its new capacity of production with debt, but condition r > i guarantees that it can cover its current debt services. This position constitutes an advance capitalist economy where the expectations of investment realization allow for the expansion of the representative firm. But it can also be a burdensome situation for both. The firm "speculates" when investing hoping that future returns increase and exceed the cost of finance and the level of accumulation (g > r > i) A Ponzi scenario happens when i > r, regardless of g, meaning that income is not enough to cover debt service, so the situation will hold if lenders maintain the trust in borrowers. Table 2 contains a synthesis of the positions derived from Foley's (2003) study.
Table 2 Foley's 2003 financial positions
| Hedge finance | Speculative finance | Ponzi finance |
| 1. r > i > g | 1. g > r > i | 1. g > i > r |
| 2. r > g > i | 2. i > g > r | |
| 3. i > r > g |
Source: Rojas (2016).
DESCRIPTIVE ANALYSIS OF STRUCTURAL CHANGE AND FINANCIAL FRAGILITY IN COLOMBIA, 1995-2015
In this section, the calculations and descriptive analyses of the SC measured by the strong version of Thirlwall's Law and the Minskian financial fragility for Colombian companies will be presented, and conclude by surmising the connection between the two issues.
Initially, the export and import demand income elasticities that make up the strong version of Thirlwall's Law were calculated, using Colombian data from 1980 to 2016 according to CEPAL (2012). The elasticity of exports with respect to foreign income (ex10) is included in the numerator, which is estimated as the first difference of the logarithm of exports at constant pesos in 2010, divided by the first difference of the logarithm of real GNP of the United States, also at constant prices in 20105. The income elasticity of imports (em10) is the ratio of the first difference of the natural log of imports and the Colombian real GDP at constant prices in 2010. Next, the moving average of ten periods for each of the elasticities mentioned was calculated in order to soften the cyclical changes, and the result was divided to obtain the strong version of Thirlwall's Law that appears in Figure 1 (Law 10 ).
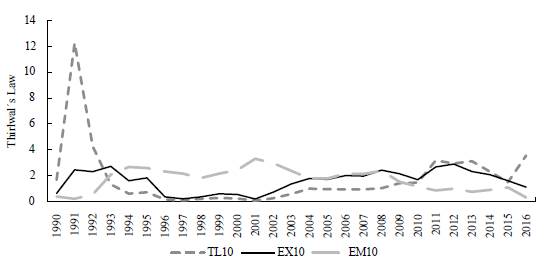
Source: Author's calculations using data from Banrep, Dane and Macrodatos.com
Figure 1 Ten-year moving average of the strong version of Thirwall's Law for the Colombian economy (1990-2016)
The strong Thirlwall Law (Law 10 in Figure 1) shows that Colombian growth restricted by the balance of payments is sustained by sporadic expansions, that can be explained by the implementation of a speculative bet on growth supported by the realization of commodity booms in the primary export sector, which alleviate the external restriction and determine the financial balances of the economic agents. The opposite example is Korea, showing a strong Thirlwall Law that steadily oscillates in a stable manner in a value greater than 2, evidencing the accumulation of an investment in productive capacities, which consolidated a diversified business fabric in the more complex network of sophisticated activities (CEPAL, 2012)6.
Likewise, two boom periods marked by the increase in export income elasticity, one at the beginning of the 1990s and the other after 2002, can be observed in Figure 1. The first barely lasted four years from 1990 to 1993 as a result of the oil boom at the time (Garay, 1994). The second began in 2002 and peaked in 2007, then slowed down during the financial crisis of 2008, and finally resumed the path of expansion, reaching its top in 2011.
On the other hand, the elasticity of imports at the beginning of the 1990s rose drastically, for reasons such as financial and commercial openness, the strong increase in GDP at the time, and the real appreciation of the exchange rate for financial reasons as mentioned by García (2002) and Misas (2016). After the debacle at the end of the century, the elasticity approaches that of exports, only to end up crashing due to the 2008 crisis.
Combining the above, the emergence of four periods in growth restricted by a balance of payments in Colombia becomes evident. The first is a very strong relief of the restriction by the oil boom from 1990 to 1993, after that comes a period of import boom that lasted until 2001, followed by a period where the two elasticities stabilized at very close levels until 2008, and the last episode shows a fall in both elasticities, but with greater deterioration in imports, in turn easing the external restriction.
Ultimately, this study expects that in the periods where the Thirlwall Law increases, it will result in an improvement in the income flow of companies by reducing their FF on average, and vice versa. Likewise, it would be expected that the Min-sky Effect would appear; in other words, during the boom periods the FF would increase, while during crises, the balances would be corrected.
After calculating the SC using Thirlwall's Law, the Minskian FF of Colombian companies is estimated by developing a continuous indicator during the period 1995-2015. To achieve this, the microeconomic data from the financial balances of the Colombian companies provided to the Superintendencia de Sociedades are taken annually from 1995 to 2015 through the SIREM platform. Two adjustments are made to the base to obtain more robust results; first, information was taken from companies that reported a period of 20 years or more. Second, atypical data pertaining to the g and r rate was eliminated, and the year-round information was removed for companies that reported values greater than 10. After performing the two procedures, information was obtained from 1846 companies in which 25% reported information for all periods, and the remaining 75% stopped reporting or the data for one year was deleted.
Next, we proceeded to estimate the rates r, g and i following Foley (2003). The accumulation rate g is the capital growth rate of each company; in other words, the growth rate of the financial balance account called plant and equipment property deflated by the base CPI for 1995. After that, we estimated r, which is the ratio between earnings and total assets of each company; the first data was taken from the income statement and the second from the balance sheet. Then, the calculation of the debt service is presented which, in the absence of an adequate value in the available accounts of the general balance and the income statement, we decided to take the annual active real interest rate of the financial system that was updated with the information from the Banco de la República and the Departamento Nacional de Planeación. This data was multiplied by the debt coefficient of each company, understood to be total liabilities over total assets, as a proxy way to measure the cost of indebtedness of each firm.
Once the calculation of r, g and i was adjusted, we proceed to catalogue the companies in the sample according to the Minskian financing positions in Table 1. From the information obtained, the predominant position among the companies during the 20 years analysed was the Ponzi which was 64%, followed by the hedged with 22.2%, and then the speculative with 13.8%; the latter being an indication of the low investor mood of the companies studied. From the sample it can be appreciated that in 13234 occasions the companies changed their financial position, which represents 35.6% of the positions found, and, at one point in time, 97.2% of the companies changed their Minskian category.
Likewise, 18.6% improved their financial position by changing from Ponzi to hedged, or speculative to hedged, while 16.7% presented a change that worsened their financing position. It was discovered that the transition probabilities between more representative financing positions were as follows: in first position was the probability of remaining in Ponzi with 76.2%, followed by the probability of remaining hedged with 42%, and in third position was the probability of moving from speculative to Ponzi with 40%.
After explaining the results of the financing positions, the way in which the financial fragility indicator (FFI) was constructed is explained. A value was given to the hedged, speculative and Ponzi positions of each company in 1995 as a starting point - the values are 1, 2 and 3 respectively.
Then, it is assumed that each time a company changed its category to a better one, the FFI should decrease; if it goes from Ponzi to hedged, it will decrease by two units, whereas moving from Ponzi to speculative or from speculative to hedged it will only decrease by one unit, and if it worsens its financial position, the opposite will happen.
What's more, the degree of depth of each financing position is taken into account; in other words, how Ponzi, speculative or hedged a company will become, as long as it remains in one of the Minskian categories of financing.
In order to do this, the work of Rojas (2016) is taken and the formula that measures the degree of depth of the Minskian financing category is applied to each case. The hedged structure is deepened in the period t+k with respect to t when min {r t - g t , r t - i t }< min{r t + k - g t + k , r t + k - i t + k }, the speculative structure deepens when r t - i t > r t+k - i t+k , and the ponzi structure deepens when i t+k - r t+k > i t - r t . Keep in mind that when the Ponzi and the speculative schemes are deepened, the FFI increases, and when the hedged scheme is deepened, the FFI decreases.
Once the FFI of each company is presented, an average of the aggregate indicator and an average by sectors are obtained by means of an Excel dynamic table. First of all, the year 1995 was eliminated from the analysis because the it did not include the accumulation rate and it distorted the results given that g takes a value of zero for this period.
Hence, Figure 2 summarizes the results of the total average FFI of the sample that is associated with Colombian businesses during the analysis period, and together with those businesses, the industry and agriculture FFI, which for Misas (2016, 2019), Ocampo (2007, 2013) and Sarmiento (2002, 2014) are the big losers in terms of SC, since they have seen their participation in national added value and employment reduced due to the implementation of the market reforms from the 1990s.
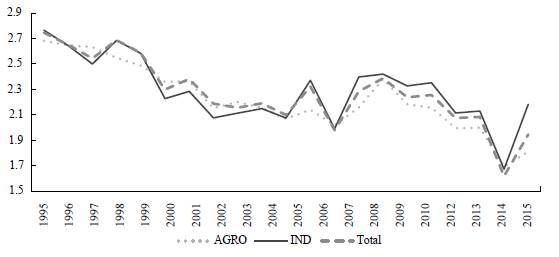
Source: Author's calculations based on SIREM.
Figure 2 Financial Fragility Indicator aggregate, industrial and agricultural in Colombia 1996-2015
The line denominated total in Figure 2 reflects the behaviour of the average financial fragility of the Colombian business sector during the analysis period. The FFI starts at very high levels close to the Ponzi situation (3) and remains there until 1998 when the worst crisis on national records hit the Colombian economy.
In fact, one result that should be highlighted is that the average FFI is high during economic crises, just like at the end of the century and the subprime. This turns out to be a breakthrough compared to other investigations that found little relationship between the FF and the economic crises. However, it cannot be assured that there is a causal link, but it is clear that the 1999 recession was preceded by a high business FF environment, while the 2008 crisis seems to have caused the deterioration of the balance sheets of the firms. This could indicate the presence of the Minsky Effect during the 1990s, but not during the rise of commodities at the beginning of the 21st century.
FFIs in the industrial and agricultural sectors show a behaviour similar to the national average, which could be due to the size of these sectors within the sample. But it is also an indication of the ability of these sectors to drag on the rest of the economy given their potential for job creation, productive links and their international tradability. Thus, these sectors would act as a kind of Kaldor's first Law, but not in the sense of the one that explains how the growth rate of the industry drags the global growth of the economy down, but instead, it illustrates hows the movements of agricultural and industrial FFI mark the health or deterioration of the balance sheets of the rest of the Colombian companies.
Likewise, Figure 3 shows the national average (total) together with three sectors that are considered winners in terms of added value and employment (Misas, 2016, 2019; Ocampo, 2007, 2013; Sarmiento, 2002, 2014). An observable feature is that the construction sector shows the greatest fragility throughout the period, and although it improved in unison with the rest of the economy, it was more sensitive to crises.

Source: Author's calculations based on SIREM.
Figure 3 Financial fragility Indicator aggregate, financial, construction and mining in
The other extreme is the financial sector whose FFI shows a lower level, a greater capacity for reduction during the expansion phases, and a slow deterioration in crises. It is a sector that shows excellent financial health, but in no way benefits the rest of the companies. The foregoing may be evidence of the financialization of the Colombian economy that consolidated an income extractor sector, but has little job creation and low productive links (Villabona, 2015).
On the other hand, the mining sector is very sensitive to changes in commodity prices because during the boom phases it improves its FFI, putting it below the national average, but given an adverse change in prices, like in 2008 or 2014, the FFI reacts sharply and is located above the construction FFI which is usually high. This also indicates that specialization in a sector such as mining introduces greater systemic fragility in financial terms for the Colombian economy; in other words, it translates into speculative growth based on income and sudden booms and external depressions.
Additionally, Figure 4 shows a connection conjecture between the FF and the SC measured using Thirlwall's Law and the FFI general average. A negative nonlinear relationship between the FF and the SC can be observed. It illustrates that in severe periods of external restriction, the FF grows exponentially, while when this restriction is relieved, the reduction of the FF becomes inelastic to the external improvement.
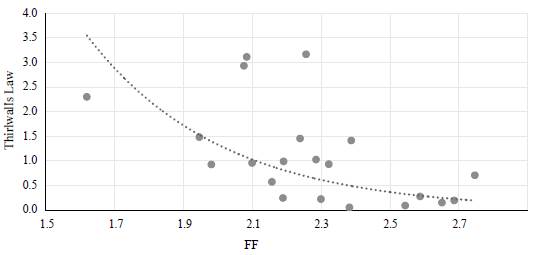
Source: Author's calculations - SIREM.
Figure 4 Moving average of the strong version of Thirlwall's Law and the average FFI for the Colombian economy 1996-2015
As seen previously, the fluctuation of Thirlwall's Law demonstrates a pattern of sporadic growth, led by speculative and rentier sectors. This is reflected in the poor reaction of the FFI in boom periods, given that the relief of the external restriction is not transmitted to the rest of the economy, but instead, when there is an increase in the restrictions in the balance of payments, the increase in the FFI is exponential, showing an asymmetric pattern of FFI reaction, where the costs are massive and the benefits are individualized.
ECONOMETRIC ANALYSIS OF THE RELATIONSHIP BETWEEN FINANCIAL FRAGILITY AND STRUCTURAL CHANGE IN THE COLOMBIAN BUSINESS SECTOR
This section aims to estimate an unbalanced short panel with 1846 companies for a 20 years period from 1996-2015. The dependent variable selected was the FFI for each of the companies, and as independent variables two data sets were taken: 1. macroeconomic data sets that represent the SC, the economic activity, and the cyclic Minsky Effect, and 2. microeconomic financial indicators7. Likewise, the companies in the database were categorized according to size - microenterprises, small, medium and large, in line with Decree 957 of June 5, 2019 of the Ministerio de Comercio, Industria y Turismo8.
It is proceeded to estimate the regression by ordinary least squares (OLS) with grouped data corrected by robust standard errors using Stata 15.0 software, where statistically significant macroeconomic and microeconomic variables were selected, economically relevant in the sense of the magnitude of the impact that they generate in regards to the FFI and the global econometric stability they offer.
The preliminary results showed that the only relevant macroeconomic variables that can explain the FFI are the Thirlwall Law (tlaw), the square root of the Thirl-wall Law (qtlaw) and the economic growth rate (GYM). Likewise, in the macro-economic variables an economic cycle dummy was estimated, taking the value of one (1) during the boom periods and zero for other periods. This exercise seeks to corroborate the second hypothesis of Minsky's financial instability (1986, 2008) called the Minsky Effect; therefore, it would be expected that during the boom phases the average FF of the different companies will increase9.
On the side of the microeconomic variables taken from the general balance sheets, it was observed that some were statistically significant and with appropriate signs. The selected variables were short-term (fsrl) and long-term (flrl) financial obligations over total liabilities, given that they showed a positive sign and a significant coefficient, in addition to the short-term financials having a slightly higher impact on the FF than the long-term ones, which is in line with Minsky's financial instability hypotheses (1992, 2008). Although the coefficients of the variables (fsrl) and (flrl) were very small, which takes away the power of economic explanation of the dependent variable; so in turn, it was decided to keep them in the estimate as control variables which improve the efficiency of the model in econometric terms.
A microeconomic variable that was economically relevant and statistically significant was the size of the company, which was tested by creating a multinomial dummy with the numbers 1, 2, 3 and 4 for microenterprises, and small, medium and large companies, respectively. Given that it is a dichotomous variable, the microenterprise is left out; therefore, the results of all the others are compared with respect to this type of company. These variables appear in the model with the numbers mentioned, identified in the estimate as (tama).
After selecting the variables for their statistical and economic significance, several panel techniques are estimated to observe the stability of the results and consolidate the best panel econometrics technique. Fixed and random, alone and adjusted effects models are estimated for robust standard errors, together with dummy and between model panel estimators, the generalized MCO regression is also made feasible. The adjustment for robust errors was made because the composite error of the model could be highly correlated over time for an individual in the sample. In fact, running the Wooldridge test to corroborate the presence of Stata 15 autocorrelation, with the xtserial command, the test rejected the null hypothesis; in other words, the model presents serial autocorrelation, so that treatment with robust errors is privileged for both fixed or random effects.
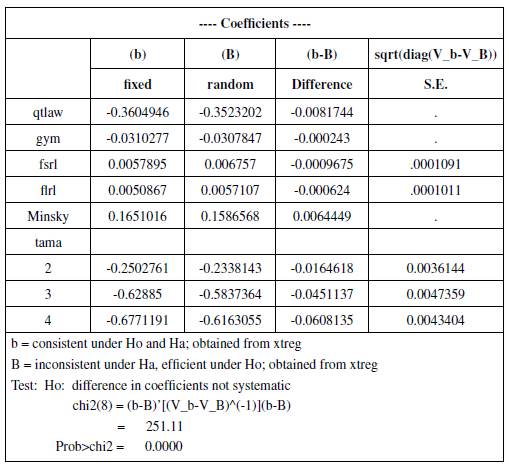
Something that stands out is the fact that the results remain stable in terms of statistical significance, coefficient value and expected sign, independent of the technique assessed except in the case of Between. After presenting different methodologies, the Haussman fixed and random effects test is estimated, which yielded a result of 0.000 in the chi statistic10, proof that the fixed effects model corrected for robust errors is the most appropriate to continue the analysis.
The use of instrumental variables was also ruled out for two reasons; the first given that an economically and statistically adequate instrument was not found; and secondly, the estimation of the definitive model of robust fixed effects shows that the correlation between the residuals and the explanatory variables is non-existent11. The use of dynamic panel methodologies was also ruled out because of the nature of the data due to a short panel, and because the models tested did not pass the overidentified restriction test.
In this way, the selected model is that of robust fixed effects (FE_rob); therefore, the statistical and economic results are analysed. In fact, all the coefficients of the model are statistically significant and maintain the theoretically expected sign; even though, the necessary magnitude of affectation on the FFI is not obtained in all cases. In turn, the highest observed square R is that which occurs within an individual over time, reaching a value of 19.2%, a result which indicates the reason why the fixed effects methodology was followed.
Regarding the coefficients, one can start with the relationship between Thirlwall's Law and the FFI. In the estimation, it was proposed to take Thirlwall's Law (tlaw) and its square root (qtlaw), observing that, if two separate models were made for each of these variables, the square root of R and the standard errors associated with the square root variable were better compared to the results of the other estimate, meaning that the variable analyzed is definitely qtlaw. The selection of this variable corroborates the conjecture that was raised based on Figure 4 where a negative nonlinear relationship between the SC and the FF is evidenced.
The obtained value in Table 3 for the coefficient of qtlaw is -0.3194, but in order to interpret it a partial derivative is taken on the variable that would give
 -= -0.5*0.3194*1/ qtlaw
0.5 . In addition, two extreme values taken from the Thirlwall Law data for the period 1996-2016 are taken to perform the analysis; 3.1675 and 0.05 consecutively.
-= -0.5*0.3194*1/ qtlaw
0.5 . In addition, two extreme values taken from the Thirlwall Law data for the period 1996-2016 are taken to perform the analysis; 3.1675 and 0.05 consecutively.
Table 3 Panel estimates under different techniques 1996-2015
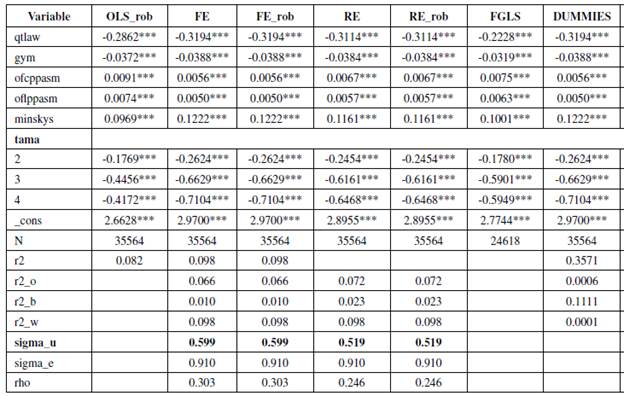
legend: p < 0.1; ** p < 0.05; *** p < 0.01
Source: Author’s calculations - SIREM.
By replacing these values in the derivative, it can be noted that when the economy is facing a severe restriction of growth due to the external sector (Thirlwall Law of 0.05), financial fragility increases by 0.6768; meanwhile, when the restriction is eased during a boom period (Law of Thirlwall of 3.1675), the FFI reduction is just 0.089. This confirms what was suggested in the previous section on the asymmetric adjustment of the FF during boom periods and the distorted long-term growth. This asymmetric response is an excellent result that illustratres Colombia's unstable growth and the sensitivity of the productive apparatus to external fluctuations. As previously mentioned, a possible explanation is that during boom periods the beneficiaries are sectors that are not able to transmit these income flows in their companies' balance sheets to the rest of the economy.
Next, we observe the coefficient associated with the growth rate of the economy (GYM) which is statistically significant and indicates an inverse relationship with the FFI. In this case, for each percentage point of growth, the FFI falls 0.038, thus a significant reduction from one period to another of the financial fragility would require a growth of at least two digits.
Another coefficient which is interpreted is that which studies the Minsky Effect. The coefficient observed is 0.1222, which, being positive, corroborates the idea that in the boom phases the FF increases by 0.1222 on average for all Colombian companies in the sample.
Observing the results in terms of company size, it is found that, on average, belonging to the large company group reduces the FF by 0.7104, and if the company is of medium size, the average value of the FF is reduced by 0.6629, while being a small company only reduces the FF by 0.2624; all compared to the microenterprise.
The other coefficients presented are those related to short and long term financial obligations. A congruent sign is observed illustrating that an increase in one percent of each of these shares with respect to the liability raises the FF by 0.0056 and 0.0050, resulting theoretically consistent given that it is assumed that short-term commitments should have a greater impact on the FF indicator. However, the value of the coefficient does not affect the FFI, making the impact of these variables insignificant, but as previously mentioned, in the model they serve as control variables that raise the overall efficiency of the econometric results.
Finally, the model of robust fixed effects is replicated in the different sectors of the economy in order to look at the impact of the productive structure of the econ omy on the FF (see Table 4)12. The first thing that is observed is that qtlaw has the expected sign for all sectors, its magnitude of reduction is economically important and statistically significant at 1%, except for the energy and mining sector. The financial sector is where the effects of the fluctuations of the economy's long-term growth are presented most acutely; for example, a reduction of the Thirlwall Law to its lowest level generates an increase in the FF to 1.24, and when this law increases to its highest point, the FF is reduced to 0.16. On the other hand, there is the industry which, during a boom period reduces its FF by very little, just 0.068, and during a crisis it increases to 0.51. The above result seems to corroborate how the Colombian long-term growth model benefits the balance sheets of companies in the financial sector followed by those in the service and transportation sector; in contrast, the expansion of the economy does not favour industry and generates intermediate impacts on trade and construction.
Table 4 Panel estimates for robust fixed effects for different productive sectors in Colombia1996-2015

legend: p < 0.1; ** p < 0.05; *** p < 0.01
AGRO: Agriculture, MIN: Mining, IND: Industry, ELEC: Electricity, CONS: Construction, COM: Commerce, SER: Services, TRANS: Transportation,
FIN: Finance.
Source: Author’s calculations based on SIREM.
On the contrary, the effective growth of the economy seems to favour industry, commerce and transportation; in other words, those which have coefficients with more important and statistically significant magnitudes at 1%. The service, construction and agriculture sectors are on the other side of the scale, benefitting the least from effective growth, while, in the middle, is the energy and mining sector.
The Minsky effect is strong in the energy sector given that the FF increases to 0.7 during boom periods, hence, being statistically significant at 10%, followed by the mining and transportation sectors which have values of 0.27 and 0.29, significant at 1% and 5%, respectively. The sector that creates the least fragility during the take-off phase of the economy is the industry with an additional value of 0.16 in the FF, showing its contribution to its own financial stability, as well as that of the system as a whole. The other sectors are not statistically significant.
Another very strong result is that which is obtained with respect to the size of the companies where it is corroborated, except in the energy sector, where, the bigger the company, the smaller the FF. Each sector shows different incidents regarding the FFI; the mining sector is where the effect of size is the most evident, whereas it is least evident in the construction sector.
Finally, the estimation constant shows that, on average, the sectors with the most FF are the construction, transportation and service sectors, corroborating the results of Figure 3, at least for construction.
CONCLUSIONS
One of the most important achievements of the document is the establishment of a causal connection between SC macroeconomic variables, growth and cycle on a microeconomic variable such as the FFI for each of the companies in the sample. This is relevant because, in modern literature, the macro-foundation of the agents' behaviours does not exist, and on the contrary, the microfundamented explanation of representative agents whose behaviour is generalized to the aggregate prevails, omitting the emergency forces that arise in the aggregates.
In the theoretical field, two theories are used that are normally not combined in order to explain the dynamics of economies. It is thought that the elasticities of Thirlwall's Law represent the ability to obtain external demand from the Colombian economy; therefore, as this capacity increases and can be sustained, due to the investment and deepening of highly diversified and technologically sophisticated sectors, the financial health of the productive sectors and their companies should be improved.
On an empirical level, several results were obtained. The FFI was established, which is novel in post Keynesian literature, and from the indicator several explanations were developed. For example, it was shown that company size did come into play in terms of their financial fragility, affecting the smaller ones much more. It was established that there is a negative non-linear relationship between growth restricted by the balance of payments and the FF, reinforcing the idea of speculative and asymmetric growth in the costs and benefits brought about by the crises and external booms of the Colombian economy. The Minsky Effect could also be verified by a cyclic dummy.
Finally, in addition to testing the effect of the SC on the FF with the introduction of Thirlwall's Law, a comparison of the data panel was made for different productive sectors, evidencing that sectors such as the financial, construction and mining sectors are very financially fragile during crises, while acting as profit hubs during boom periods. This is evidence of a speculative and exclusive growth that has been configured in the Colombian economy.
Of course, this work is ground-breaking in many regards and therefore the adjustment of the theories that are studied in the short and long term must be examined in more detail, as well as the selection of other measurement and quantification techniques that can contribute to the academic debate.