


 English (pdf)
 Article in xml format
 Article references
 Send this article by e-mail
 Cited by SciELO
  Cited by Google
  Similars in
SciELO
Similars in
SciELO  Similars in Google
 Permalink
INTRODUCTION
The Colombian labour market has gone through very significant compositional changes, and there are important differences between men and women. Between 1994 and 2010, the most relevant one was the change in workers' educational achievement, which is especially true for women.1 In 1994, the percentage of workers with tertiary education was just 11%; however, by 2010 this figure had quadrupled. This increase has been more pronounced for female workers: the proportion of tertiary-educated workers was 8 percentage points (pp) higher than that of their male counterparts by 2010. Furthermore, at the other end of the educational distribution, by 2010 there were barely any workers without primary education (the proportion was around 10% in 1994).
Moreover, female labour force participation has increased by 11 pp, while male labour force participation remained roughly constant during the same period. Despite the female workers' huge educational achievement and the increase in their labour force participation, on average the observed gender wage gap has decreased slightly by one pp.
Together with changes in the educational level, some job characteristics have also experienced an impressive change during this period. To cite the two most relevant ones, the number of employees with indefinite contracts fell by half, mainly in the private sector. And the proportion of public sector workers also dropped sharply from 13% in 1994 to 7% in 2010.
These changes have undoubtedly affected the distribution of wages. Given that these changes, as will be seen later, have not affected men and women equally, gender differences in wages are also likely to be affected, and in a different way for workers who earn lower, medium and higher wages.
The aim of this paper is to analyse the evolution of the raw and adjusted gender wage gap across the wage distribution and the impact that changes have had on education and some labour characteristics. First, we compute the relative impact of changes in education, type of employment (public/private) and type of contract (indefinite/other type of contract)2 in Colombia on the observed gender wage gaps (1994-2010), using a semi-parametric approach following DiNardo et al. (1996) (DFL hereafter). Secondly, we analyse the trend in wage differentials by gender through computing the adjusted gender wage gap once differences in observed characteristics and possible selection sample bias are controlled for using Arellano and Bonhomme's (2017) methodology.
This paper is organized as follows: the next section presents a brief summary of related empirical literature, and then we describe the data and present some descriptive statistics; the methodology and results of the counterfactual exercise are presented in section four; the following section presents results of the adjusted gender wage gap at the mean and in different quantiles; and, finally, conclusions and references are presented in the last two sections.
PREVIOUS LITERATURE ON GENDER WAGE GAP IN COLOMBIA
This section summarises the existing literature regarding empirical works on gender earnings gap in Colombia.
Labour force participation in Latin America increased on average by 6.5 pp from the early 1990s to late 2000s, with most of the increase coming from legally married women who have low education levels, are less educated than their partners, and have children living at home (Elias & Ñopo, 2010). In Colombia, this increment was huge: 18 pp from 1984 to 2006, explained mainly by changes in the population composition through educational attainment (Amador, Bernal, & Peña, 2013).
However, despite the increases in female labour force participation, as well as women's important educational achievement in comparison to men, there is still a gender wage gap for women in Colombia. Moreover, despite the importance of the topic, there are only a few researchers studying this phenomenon in the country, and the most updated period analysed was 2006. In general, the evidence is that, on average, hourly earnings and wages for men are higher than those for women. Most of the previous literature has focused its analysis on measuring and decomposing the gender earnings gap. Previous empirical works have concluded that most of the observable differences cannot be explained by differences in observed measures of human capital or other observable differences in job characteristics.
One of the first studies that sought to account for gender differences in Colombia was undertaken by Tenjo, Rivero, and Bernat (2002). These authors measure the gender wage gap in six Latin-American countries, including Colombia. Using the Oaxaca decomposition and correcting for sample selection, they find that the unexplained component of the average gender wage gap (the fraction of the average wage gap that cannot be explained by differences in human capital and observable job characteristics) is positive and significant. In addition, they find that the component associated to characteristics is negative, and it decreases during analysed period. This reflects women's tendencies to accumulate human capital more quickly than men. The authors relate these findings to the theory of statistic discrimination.
Similarly, Hoyos, Ñopo, and Peña (2010) measure the average gender earnings gaps from 1994 to 2006 using a non-parametric technique based on a matching-on-characteristics methodology developed by Ñopo (2008). These authors use information from employees, self-employed people and employers. They find that, in Colombia, the unexplained gender gap is between 13% and 23% of average female earnings after controlling for socio-demographic and job-related characteristics. Moreover, they find evidence that gender earnings gaps have a greater effect on more less productive workers and those who have to work under precarious conditions in the labour market.
Badel and Peña (2010) also decompose the gender wage gap but use the Machado Mata (MM) technique3 based on quantile regression for 2006. Therefore, they measure the gap not only at mean but also at other points of wage distribution. They find evidence of both a glass ceiling effect (a significant gender gap at the top of the distribution) and a quicksand floor effect (a significant gender gap at the bottom of the distribution) for Colombian women. Moreover, they control for self-selection in the labour force and state that it accounts for around 50% of the observed gender gap.
The effect of occupational segregation on the wage gap is studied by Isaza (2009). Using a version of the Blinder-Oaxaca (BO) (1973) decomposition of the gender wage gap that accounts for the explained and unexplained components of workers' allocation, he concludes that occupational segregation contributes to decreasing the gender wage gap.
The role of labour supply in the gender wage gap is studied by Angel-Urdinola and Wodon (2003). They use weighted OLS regression to estimate the gender wage gap, controlling for a set of observable worker characteristics and then regressing the gap against relative labour supply whilst controlling for other variables. They conclude that in the presence of gender discrimination and perfect substitution, the increase in the relative labour supply of women as compared to men has helped reduce the gender wage gap in Colombia over time (1979-2000) from 22% in 1982 to 12% in 2000.
On the other hand, Abadía (2005) finds evidence of statistical discrimination in the private sector: as firms have limited information about the abilities and productivity of applicants, they have an incentive to use easily observable characteristics such as gender, age, race, etc. to discriminate against workers if their characteristics are correlated with workers' performance. Thus, given that women quit the labour market more often than men for family reasons, employers may consider female employees as being uncertain factor when making the decision to hire them, which finally results in lower wages. This author finds that in 2003 13% of the gender wage gap in the private sector is explained by statistical discrimination.
Bernat (2007) computes discrimination curves for 2000, 2003 and 2006, studying the incidence, intensity and inequality of discrimination throughout the distribution of the gender wage gap. This study concludes that the number of women discriminated against and the intensity of discrimination have increased and there is evidence of a glass ceiling, i.e. women face barriers to promotion to jobs at the top of the wage distribution.
This paper seeks to provide an answer to the changes in the raw and adjusted gender wage gap in Colombia between 1994 and 2010. A semi-parametric technique is used to look at the extent to which changes in the educational attainment of workers as well as other job characteristics such as type of employment and type of contract contribute to explain changes in the observed gender wage gap throughout the wage distribution. Further, the adjusted gender wage gap is estimated using Arellano et al.'s (2017) approach in order to analyse changes in the gender wage gap-not only at the mean level but also at different quantiles of the wage distribution level-whilst controlling for sample selection.
The presence of gender wage inequalities in a society is not only a moral issue but also an economic problem. The fact that women with similar individual and labour characteristics receive lower wages than men contributes to increasing poverty and social inequality as well as reducing economic growth and generating important economic losses (Cuberes & Teigner, 2015; Galor & Weil, 1996; Milli, Huang, Hartmann, & Hayes, 2017). Therefore, to measure the wage gap between men and women, to identify the most affected population group, to determine its evolution in time, and to identify some variables that have contributed to reducing or increasing the gap, it is crucial to support with evidence and motivate the design of policies aimed at decreasing inequalities present in the labour market.
DATA AND DESCRIPTIVES
The data are taken from the Colombian Household Survey (second quarters of 1994 and 2010) that was carried out by the Colombian National Statistical Department (DANE). This survey contains individual information about the size and structure of the labour force, living conditions and composition of incomes of Colombian households. Second quarter information of household surveys is used because, before the year 2000, questions such as the size of firms (in terms of number of employees), tenure (number of working-years of the employee in the current firm) and other relevant firm variables were only asked in this quarter. It was decided to use 1994 as the initial year to avoid comparisons before and after Law 100, which introduced changes that had an important impact on the labour market.4
The sample is restricted to public and private sector employees, and domestic workers between 18 and 65 years old who work between 16 and 84 hours per week and live in the ten largest metropolitan areas: Barranquilla, Bucaramanga, Bogotá, Manizales, Medellín, Cali, Pasto, Villavicencio, Pereira and Cúcuta; they account for 68% of the population according to the 2005 census. Despite the fact that employers and self-employed individuals represent an important share of the labour market (43.48% in 2010), they are disregarded from this study in order to leave a more homogeneous sample of male and female workers in terms of hiring conditions and wage structure. Therefore, for public sector employees, we only include career public servants, excluding all people with government service contracts who are classified as self-employed.5 In addition, the analysed sample includes both formal and non-formal workers.
The top 1 percent of the wage distribution for each year and gender is discarded in order to avoid outliers. For each procedure, the corresponding expansion factors are used. Wages for 1994 are in constant 2010 prices.
During the two analysed years that cover this study, 1994 and 2010, Colombia's economy showed important changes related to employment and economic growth. In 1994, the rate of economic growth was around 5.8%, and the unemployment rate reached 10%. In 1998, Colombia entered into a deep economic crisis that reached its lowest point in 1999 (-5%) when the country had a high unemployment rate (20%). Since 2001, the unemployment rate has fallen and the economy has begun to recover: there was a growth rate of 8% in 2007 and unemployment was 11%. The effects of the global financial crisis were observed in Colombia in 2009 when growth fell to 0.8%. However, for 2010, the economic growth and unemployment rate reached rates similar to those in 1994: 4.3% and 11%, respectively.
Table 1 gives personal, job and demographic characteristics by gender during the two periods. With respect to gender differences in demographic characteristics, it can be observed that, in 2010, both male and female workers are older than in 1994 (by an average of 2-3 years). In addition, it can be seen that the share of workers (both male and female) between 18 and 24 years old has decreased whereas the share of older workers (between 45 and 54) has increased.
Table 1 Descriptive Statistics of Female and Male Workers
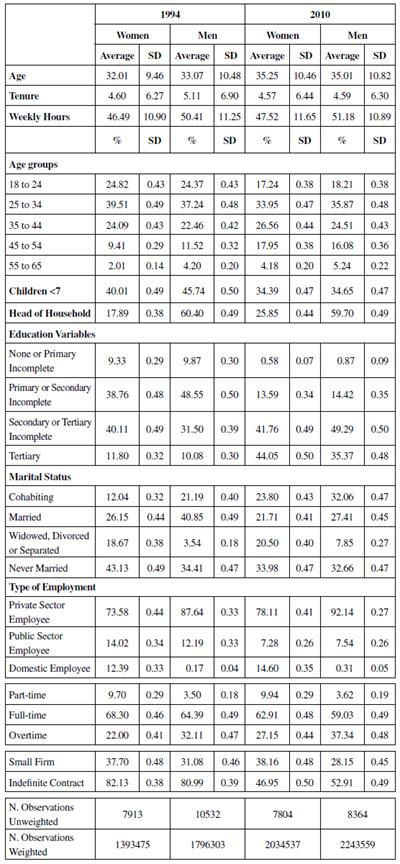
SD = standard deviation
Source: Author's own elaboration using data from Colombian Household surveys from 1994 and 2010.
The increase in Colombian employees' educational attainment has been very impressive, especially for women. The share of female workers who have a higher education quadrupled: it increased from 11% in 1994 to 44% in 2010, whereas the increment for male workers was lower, it went from 10% to 35%. Moreover, the proportion of workers with less than secondary education dropped dramatically from 48% and 58% in 1994 to around 14% and 15% for women and men respectively in 2010.
The family structure of Colombian workers has also undergone major changes. Over the 16 years studied, the percentage of married workers decreased, particularly for men (with a drop of around 14 pp). By contrast, the percentage of cohabiting couples has increased by almost 11 pp. The percentage of households with children under seven years old has decreased significantly by roughly 9 pp, and the difference by gender has disappeared. The proportion of female heads of household has increased, though the proportion of male heads of household is still much higher. In 2010, about 60% of men were head of households compared with only 26% of women.
Most workers are private sector employees: participation of workers in this sector has increased slightly, and, in 2010, the proportions of men and women in the private sector were approximately 92% and 78%, respectively. On the other hand, the proportions of women and men in the public sector decreased by almost 7 and 5 pp, respectively: as of 2010, 7.4% of workers were public employees. Domestic employees are still predominantly women: their participation has increased slightly, with this type of employment accounting for 7.1% of employees in 2010.
With regards to working hours, the percentage of women working part-time (less than 35 hours per week, which is the standard definition of part-time in Colombia) is about 6 pp higher than for men, while the proportion of woman working overtime (more than 48 hours per week) is 10 pp lower than for men. The proportion of women in small firms (with less than 11 employees) is higher than men in both periods, and the gender difference is around 10 pp in 2010.
Hiring conditions for Colombian employees have also undergone significant changes, particularly with regard to types of contract. In 1994, around 80% of workers had indefinite contracts, but by 2010 this percentage had almost halved. The fall was 35 pp for women and 28 pp for men.
Finally, Table 1A reports the distribution of workers across occupations and economic sectors in the two years under consideration. The most significant feature regarding occupation is the reduction in the proportion of workers in non-agricultural and operator occupations by 7 and 11 pp for women and men, respectively, and the increase in service occupations of around 5 and 4 pp for women and men, respectively. In terms of economic sectors, a reduction is observed in the number of women and men employed in manufacturing (about 7 and 6 percent, respectively), and an increase in employees in the trade, restaurants and hotels sectors, mainly among men (5 pp).
Table 1A Descriptive Statistics for Female and Male Workers
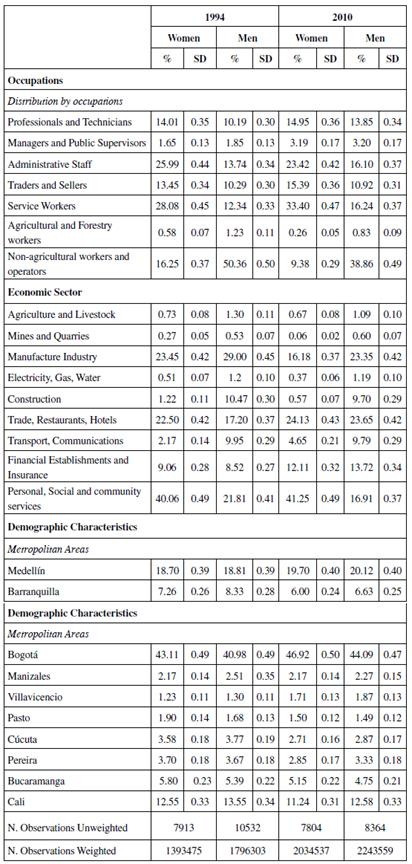
SD = standard deviation
Source: Author's own elaboration using data from Colombian Household surveys from 1994 and 2010.
Given that the aim of this paper is to analyse changes in the gender wage gap, it must be determined what changes occurred in the wage structure over this 16-year period. Table 2 presents average hourly wages broken down by different characteristics and the respective raw gender wage gap. The raw gender wage gap is computed as the difference between the average logarithms of hourly wages for male and female workers.
Table 2 Average Real Hourly Wages and Gender Wage Gap by Characteristics
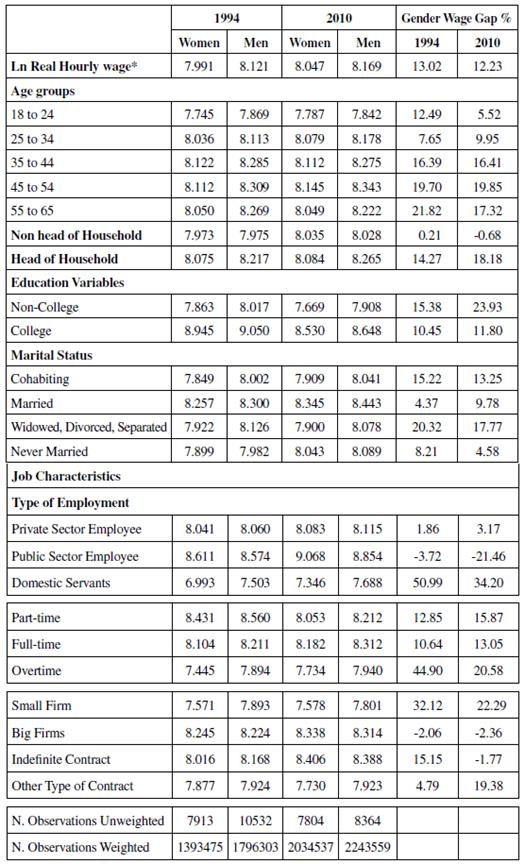
* Wages from 1994 are in 2010 prices. Ln of hourly wages at current 1994 prices are 6.529 and 6.559 for woman and men, respectively.
Source: Author's own elaboration using data from Colombian Household surveys from 1994 and 2010.
As is observed in Table 2, the average real hourly wages of men are higher than women in almost all cases, except among non-heads of household, public sector employees, big firms and indefinite contract holders for whom the gap is negative. On average, men earn more than women, and the increase in real wages is greater for men (women's wages increased by 5.4% while men's rose by 8.09%). Workers reach their peak hourly wage when they are between 45 and 54 years old.
The gender wage gap is huge for workers between 45 and 65 years old, but the gap at the ends of the age distribution has decreased.
Real hourly wages of younger workers and tertiary-educated workers have decreased, and the drop has been greater for men, but overall average hourly real wages for all workers have increased. On average, wages of non-tertiary-educated workers are around 35% of those of tertiary-educated workers, which reveals the existence of a significant wage premium for higher education. The gender wage gap is about 12% for tertiary-educated workers and has remained almost the same over time, while for non-tertiary workers it increased from 15% in 1994 to 24% in 2010.
On average, heads of households have higher wages than the rest of the household members. Married workers earn more than non-married ones. The biggest gap (around 18%) is found when comparing married with widowed, divorced and separated workers, and the second biggest is for cohabiting workers (13%).
As reported in Table 2, public employees are the group with the highest wages in 2010. They also show a bigger gain in purchasing power than private employees. Female hourly wages in the public sector are on average more than double those in the private sector. In addition, on average, women in the public sector earn more than men and the wage gap by gender in this sector in absolute value has increased greatly in their favour: from -3% to -23%. Abadía (2005) analyses the presence of statistical discrimination in the private and public sectors and concludes that there is no evidence of statistical discrimination against women in the public sector in 2003. She states that the Law of quotas could explain this finding.6 In addition, another feature that helps to explain this fact is that around 89% of women working in public sector have a higher level of education compared to men (of whom only 70% have this same level).
The gap between male and female domestic employees has decreased, but the greatest gap is still found among these workers (34% in 2010). Hourly real wages of part-time employees have decreased: on average, full-time and overtime workers have lower hourly wages than part time workers in both periods. Moreover, the wage gap observed between men and women working overtime hours more than halved from 45% in 1994 to 21% in 2010.
There is a significant wage premium for working in big firms and having indefinite contracts. In 2010, the wages of female and male employees in small firms are about 44% and 54%, respectively, of those of employees working in big firms. The gender gap for workers with other types of contracts, including verbal and fixed-term contracts, increased greatly from 5% to around 19%, while the gap between employees with indefinite contracts almost disappeared, shifting from about 15% to -2% in 2010.
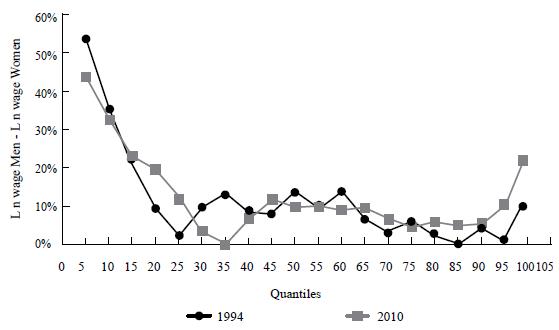
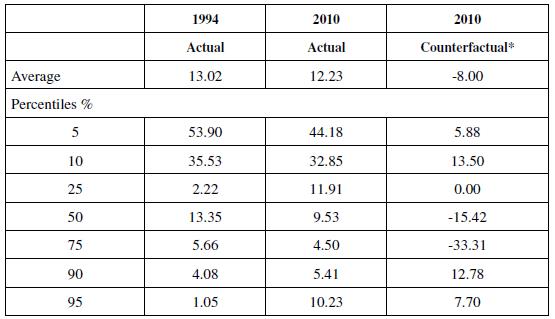
The raw gender wage gap is plotted in Figure 1. On average, the gap has slightly decreased over the last 16 years from 13.02% to 12.23% in 2010. However, important differences arise in different parts of the wage distribution. In particular, for both years, a non-monotonic trend is observed in the raw gender wage gap: it is very broad at the bottom of the distribution (54% and 44% at the 5th percentile in 1994 and 2010, respectively), decreases in the middle and then increases slightly at the 99th percentile (to 10% and 22%, respectively).
THE EFFECT OF EDUCATION, PUBLIC SECTOR EMPLOYMENT AND THE TYPE OF CONTRACT ON THE GENDER WAGE GAP
In this section, we quantify how the observed changes in workers' educational level, in terms of the type of employment (public/private) and the type of contract (indefinite/other type), have changed the observed gender wage gap. We focus on the analysis of these three characteristics because of their relevance for wage determination since they have experimented huge changes during the analysed period and they have affected men and women differently.
The aim of this section is to compute what the distribution of wages would have been in 2010 had the educational attainment, the proportion of public-sector workers and the proportion of indefinite contracts remained at 1994 levels. The counterfactual distribution is computed separately for each of the three characteristics and simultaneously when the three characteristics are fixed at 1994 levels. This reveals the extent to which the gender wage gap has been affected by changes observed in each of the three characteristics and by all three of them together.
More specifically, the questions to be addressed are the following:
(i) What would the distribution of the gender wage gap in 2010 have been if education had remained at its 1994 level?
(ii) What would the distribution of the gender wage gap in 2010 have been if the distribution of workers in the public sector had remained at its 1994 level?
(iii) What would the distribution of the gender wage gap in 2010 have been if the proportion of workers with indefinite contracts had remained at its 1994 level?
The methodology used to compute the counterfactual distributions is described first, and then the results are presented. Answering those questions is relevant because it may help to predict future trends in terms of gender wage gap in Colombia.
Methodology
The counterfactual density of the gender wage gap in 2010 is computed using the methodology developed by DiNardo, Fortin, and Lemieux (DFL) (1996). This enables the weighted kernel density that would have prevailed if any characteristic of interest-in our case education level, type of contract and type of employment-had been calculated at its 1994 level.
In this case, the DFL approach entails estimating the conditional probability of a worker at a point of time with given characteristics having tertiary education (or working in the public or private sector or having a particular type of contract). The probabilities estimated are used to compute a reweighting function, which up-weights workers in 2010 who are underrepresented and vice versa in order to represent the distribution of any characteristic of interest for the 1994 sample.
For each worker, there is a vector represented by (w, x, t), where w is the wage, x is a vector of personal and job characteristics, including a dummy y, the variable of interest, and t the date, which is the year 1994 or 2010.
So, for example, if the objective is to analyse the contribution of changes in workers' education levels in terms of the wage distribution, y is a dummy that has a value of one for tertiary-educated workers and zero otherwise.7
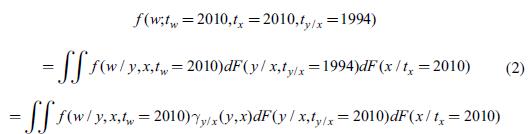
The density of wages in 2010 is: f (w; t w = 2010, t x = 2010, t ylx = 2010) =

Following the DFL approach, the counterfactual density of wages in 2010, if y had remained at its 1994 level, can be expressed as the distribution of wages in 2010 with the weights adjusted, i.e.:
Where the reweighting function is defined as:
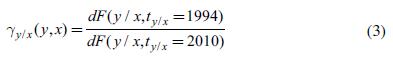
As y is a dummy variable that takes the values one and zero, the reweighting function is:
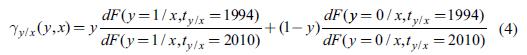
The conditional probability dF(y = 1/ x, t , x = t) is estimated using a probit model. x is a set of covariates that vary depending on the objective variable to be predicted. In general, it consists of dummies for gender, education, tenure, age, age squared, region, economic activity, occupations, size of the firm and full-time work; and an indicator for type of employment. Gender is usually interacted with education variables and tenure.
The weighted kernel density introduced by DFL is used:
where K is the kernel,8h the bandwidth and 6. the sample weight normalized to sum one.9
The counterfactual density is estimated using
 as weights, which is the reweighting function times the sample weights.
Up to now, the description has covered how to obtain the reweighting function when only one variable changes. This methodology can, however, also be used to analyse the effect of changes in more than one variable at the same time. In particular, it would be interesting to compute the counterfactual gender wage gap that would have prevailed if the level of education, the proportion of indefinite contracts and the proportion of public-sector workers had remained at 1994 levels but with the 2010 wages structure. In this case, the reweighting function is defined as the product of the three new weights (computed separately using the predicted probabilities in equation 1) times the sample weights normalized to add up to one.
DFL methodology has not been used in Colombia to analyse the gender wage gap. This technique has some advantages over other decomposition methods: 1) it is easy to compute, 2) it can be extended to other distributional statistics other than the mean (unlike BO, 1973); 3) it does not impose any parametric assumption to the distribution function (unlike MM, 2005), 4) it does not have the problem of dimensionality (unlike Ñopo, 2008). However, similar to the majority of decomposition methodologies, DFL has the limitation that it does not take into account general equilibrium effects.10
The Effect of Changes in Education on the Gender Wage Gap
The increase in Colombian workers' educational achievements of over the 16-year period studied is remarkable. The proportion of workers with tertiary education increased by around 32 pp for women and 25 for men. This section determines what the counterfactual gender wage gap would be in 2010 if the education levels of men and women had remained at their 1994 levels. Given that the change in men and women's educational attainment has not been of the same magnitude, this change can be expected to have an impact on the trend in the gender wage gap.
Table 3 presents mean hourly wages and by percentiles. Tertiary-educated workers earn more than those without tertiary-education. In real terms, hourly wages have decreased for both tertiary and non- tertiary-educated workers, but especially for the former. Average wages for women with tertiary educations are down by about 28%, with the biggest falls in the 50th and 75th percentiles (41% and 31%, respectively). The loss of purchasing power for women without a tertiary education is around 26%, with the biggest decrease taking place at the top end of the distribution. Moreover, the fall in wages for men with tertiary educations is, on average, 26%, and the biggest drop at the top of the wage distribution can also be found here. The hourly wages of non- tertiary-educated men are down on average by around 16%, and, once again, workers at the top of the distribution are the most affected.
Table 3 Average and Percentile Real Hourly Wage by Education and Gender
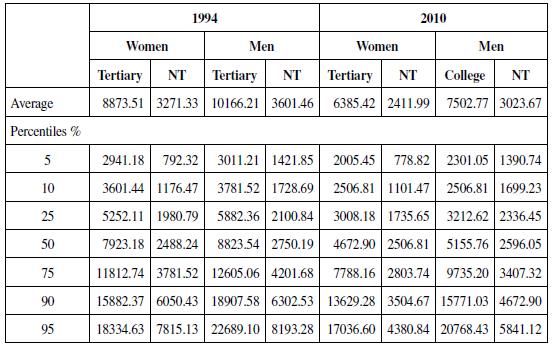
NT= non-tertiary education
Source: Author's own elaboration using data from Colombian Household surveys from 1994 and 2010.
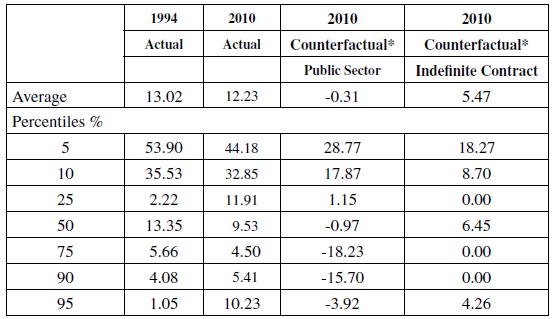
Table 4 shows the raw and counterfactual gender wage gaps at the mean and at different percentiles for 1994 and 2010. The first and second columns show the observed wage gap by gender, and the third column presents the counterfactual wage gap, i.e. the wage gap that would have existed in 2010 if education had remained at its 1994 level and workers had been paid according to the wage schedule observed in 2010. It is computed using the DFL reweighting technique that was explained in the previous section.
Table 4 Average and Percentile Raw Gender Wage Gap Contribution of Education
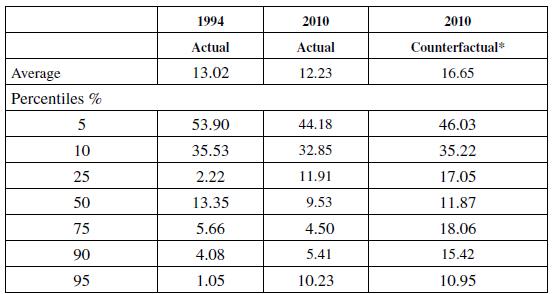
* DiNardo, Fortin, Lemieux approach (1996)
Source: Author's own elaboration using data from Colombian Household surveys from1994 and 2010.
It is interesting to observe that the increase in educational attainment has helped reduce the average gender wage gap, i.e. if the wage structure and the observable characteristics was that of 2010 but the distribution of tertiary-educated workers was that of 1994, the average raw wage gap would be 4 pp higher.
In addition, a look at the percentiles reveals that the increase in education has changed the distribution of workers' wages, especially in the middle and at the top of the distribution. It has contributed to a drop-in wages in the middle of the distribution and increased the number of workers with higher wages. This latter impact is lower for men than for women. The greatest impact is observed at the 75th and 90th percentiles, with reductions of about 14 and 10 pp. This is consistent with the fact that the increase in women with a tertiary education is much greater than that of men in 2010. An interesting finding is that no effect is observed at the 95th per-centile of the wage distribution.
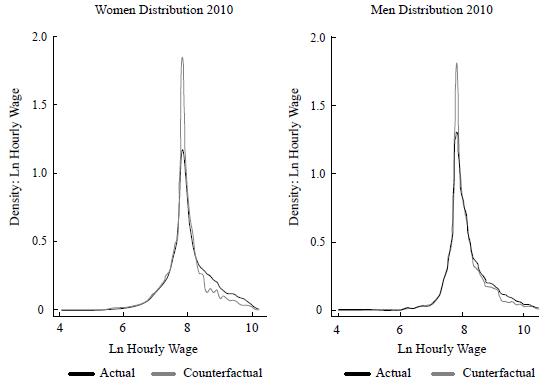
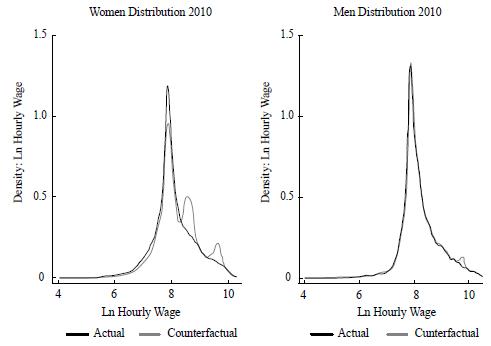
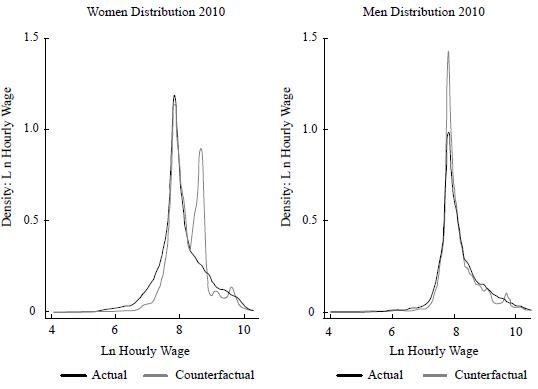
A clear illustration of these changes is represented in Figure 2, which shows the Kernel estimation of the actual and counterfactual densities of wages by gender. In this figure, the impact of education is clearly observed, and it shows the exact points of the wage distribution where the main effects of the changes in education have taken place.
The Effect of Changes in Job Characteristics on the Gender Wage Gap
This section isolates, first, the effect of observed changes on the proportion of workers employed in the public sector. And, second, it shows changes that the composition of workers with indefinite contracts has had on the gender wage gap. Both characteristics have undergone remarkable changes over the years considered.
Changes in Public Sector Employment
The number of public-sector employees almost halved between 1994 and 2010; there was a decrease from 14% (women) and 12% (men) to 7% (both).11
Table 5 contains a breakdown by gender of the average hourly wages for the mean and at different percentiles of public- and private-sector employees. On average, female and male public-sector employees earn more than private-sector workers. Hourly wages of employees in both sectors have increased although the increase is greater for public-sector workers, especially for women. In 1994, the average hourly wages of male public-sector employees were slightly higher than those of women; however, in 2010 this situation was reversed: female public-sector employees earned more than men for the mean and at all percentiles, except 95%.
Table 5 Average and Percentile Real Hourly Wage by Type of Employment and Gender
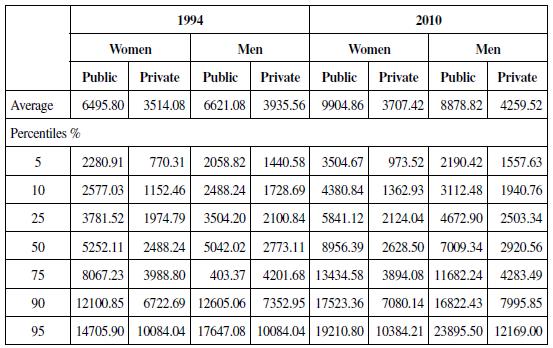
Source: Author's own elaboration using data from Colombian Household surveys from 1994 and 2010.
In 1994, women working in the public sector earned 84% more than women in the private sector. This gap increased to 167% in 2010. At the mean, the increase in wages of female public-sector employees is around 52%, and the largest gains in purchasing power are observed from the 50th percentile onwards. For men, the increase in purchasing power for public sector workers is about 34% at the mean and is accounted for mainly by the top end of the wage distribution.
Table 6 shows the actual and counterfactual gender wage gaps at the mean and at some percentiles. The first and second columns show the observed gender wage gap. The third column presents the counterfactual distribution, i.e. the gender wage gap that would have existed if the distribution of workers in the public sector had remained at its 1994 level.
Table 6 Average and Percentile Raw Gender Wage Gap Contribution of Job Characteristics
* DiNardo, Fortin, and Lemieux approach (1996)
Source: Author's own elaboration using data from Colombian Household surveys from 1994 and 2010.
It can be clearly observed in Figure 3 that the reduction in the number of workers in the public sector has changed the wage distribution of women more than that of men, mainly at the top end of the distribution. Comparing the actual and counterfactual distributions for women, it can be seen that the former contains more women at the low end of the wage distribution, whereas the proportion of women earning higher wages is lower. Therefore, the reduction of workers in the public sector has contributed to the increase in the gender wage gap and the biggest effect is observed from the 25th percentile onwards.
Source: Author's own elaboration using data from Colombian Household surveys from 1994 and 2010.
Figure 3 The effect of Changes in Public Employment on Wage Distributions by Gender
It is also interesting to highlight that at the 70th and 90th percentiles the gender wage gap would have been negative.
Given that by 2010 women in the public sector earned more than their male counterparts at the mean and at almost all percentiles of the wage distribution, the reduction in the share of public sector workers has helped to increase the gap, especially for workers at the top of the wage distribution.
Changes in the Type of Contract
The next characteristic examined is the change in the proportion of workers with indefinite and other types of contracts, including verbal and fixed-term contracts. As mentioned above, the proportion of workers with permanent contracts has decreased remarkably in this 16-year period. In 1994, 82% of women and 81% of men had indefinite contracts, whereas, in 2010, the proportion was just 47% and 53%, respectively. The relaxation of the laws allowing companies to hire temporally (Law 50 of 1990) as well as the possibility of indefinitely renewed fixed-term contracts could have contributed to a significant decrease of indefinite contracts (Abadía, 2014).12
Table 7 presents hourly wages at the mean and at different percentiles for women and men by types of contract. On average, workers with indefinite contracts earn more, and the difference seems to be quite stable in both years.
Table 7 Average and Percentile Real Hourly Wage by Type of Contract and Gender
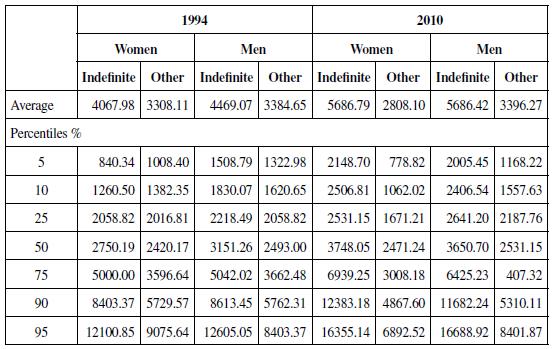
Source: Author's own elaboration using data from Colombian Household surveys from1994 and 2010.
The hourly wages of women and men with indefinite contracts have increased over time by an on average of 40% and 27%, respectively. The biggest increases are observed at the low end of the wage distribution. This contrasts with male workers, whose wages have increased over this period by a very similar amount throughout the wage distribution. However, the wages of female workers without indefinite contracts have, on average, decreased.
The last column in Table 6 shows the counterfactual gender gap, i.e. it includes the distribution of workers with indefinite contracts at its 1994 level and the wage structure as of 2010: on average, the observed gender wage gap would have been around 7 pp lower. Important changes are observed at the bottom of the distribution, i.e. for the 5th, 10th and 25th percentiles. A smaller contribution is observed in the 75th, 90th and 95th percentiles.
Figure 4 shows that the reduction in the number of workers with indefinite contracts contributes to an increase in the number of workers earning lower wages, the effect being greater for women. Moreover, it helps increase the number of women at the mean of the distribution.
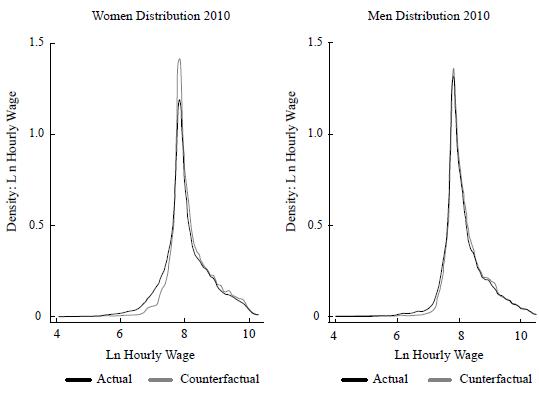
Source: Author's own elaboration using data from Colombian Household surveys from 1994 and 2010.
Figure 4 The Effect of Changes in Type of Contract in Wage Distribution by Gender
Therefore, the reduction in indefinite contracts observed between 1994 and 2010 increases the gender wage gap, especially for those at the low end of the wage distribution.
So far, this analysis has covered the separate effects of education, type of employment and type of contract have had on the gender wage gap. However, given that these three changes have occurred simultaneously during the period of reference, it would be interesting to learn to what extent the three together have changed the female and male wage distributions, and, hence, the gender wage gap. It is noted in the previous section that the increase in educational attainment helps to reduce the gender wage gap while the change in the proportion of public sector jobs and the reduction in indefinite contracts produces the opposite effect. Furthermore, the main contribution of changes in education and in public-sector jobs is observed at the top end of the wage distribution whereas the change in type of contracts mainly affects the bottom end. Depending on which of them dominates, the counterfactual gender wage gap may be higher or lower than the actual gap.
The first two columns of Table 8 show the actual wage gaps in 1994 and 2010. The third column presents the counterfactual wage gap that would exist if the figures for educational attainment, type of employment and type of contract remained at their 1994 levels.
Table 8 Average and Percentile Raw Gender Wage Gap Contribution of Education, Type of Employment and Type of Contract
* DiNardo, Fortin, and Lemieux approach (1996)
Source: Author's own elaboration using data from Colombian Household surveys from 1994 and 2010.
The results indicate that, on average, the counterfactual gender wage gap would have been negative. This is because the reduction in public-sector jobs and the reduction in indefinite contracts reduce average female wages more than those of their male counterparts as they affect women more than men. Figure 5 shows the actual distribution of female wages. It can be seen that there is a higher proportion of women at the bottom than in the counterfactual distribution. For men, the effects are clearly smaller and are mainly observed in the middle of the wage distribution.
Source: Author's own elaboration using data from Colombian Household surveys from 1994 and 2010.
Figure 5 The Effect of Changes in Education, Type of Employment and Type of Contract in Wage Distribution by Gender
In sum, taken together, the three changes have increased the gender wage gap-the positive effect education has had with regards to reducing the gap is exceeded by the negative effect of other changes in job characteristics, such as the proportion of public-sector employment and the proportion of indefinite contracts.
THE ADJUSTED GENDER WAGE GAP
The gender wage gaps described in the previous section are raw and counterfactual gaps-they were computed without taking into account the whole set of differences in observable personal and job characteristics of workers. In this section, we estimate the adjusted gender gap by comparing hourly wages of male and female workers whose observed characteristics are similar. This allows us to learn to what extent the previous observed raw gender gaps arise as a result of heterogeneity in observed characteristics such as age, education or other job characteristics.
The adjusted gender wage gap is estimated using parametric techniques to regress the logarithm of hourly wages at the mean (using the OLS model) and at different quantiles (using Koenker & Bassett, 1978) while controlling for observable characteristics. In addition, we use the Heckman two-step and Arellano et al. (2016) methodologies to estimate the gender wage gap at the mean and at different points of distribution, respectively. We take into account the potential selection of the sample of female and male employees. The Heckman approach involves two steps: in the first, the decision to work is regressed (using a probit model) on the standard determinants for working, and then the main equation is estimated including the selection variable as the regressor (inverse mills ratio) as well as the rest of controls. Furthermore, the Arellano et al. (2016) methodology consists in estimating through rotated quantile regression first the propensity score, second the degree of selection (copula parameter), and, third, the quantile estimates.13
Evidence of the Adjusted Wage Gap
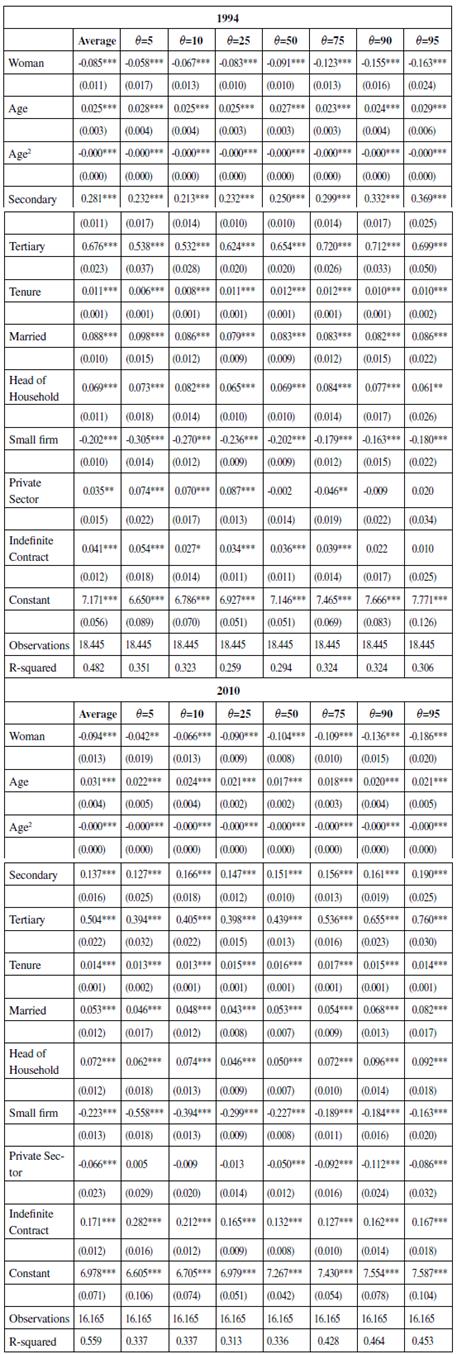
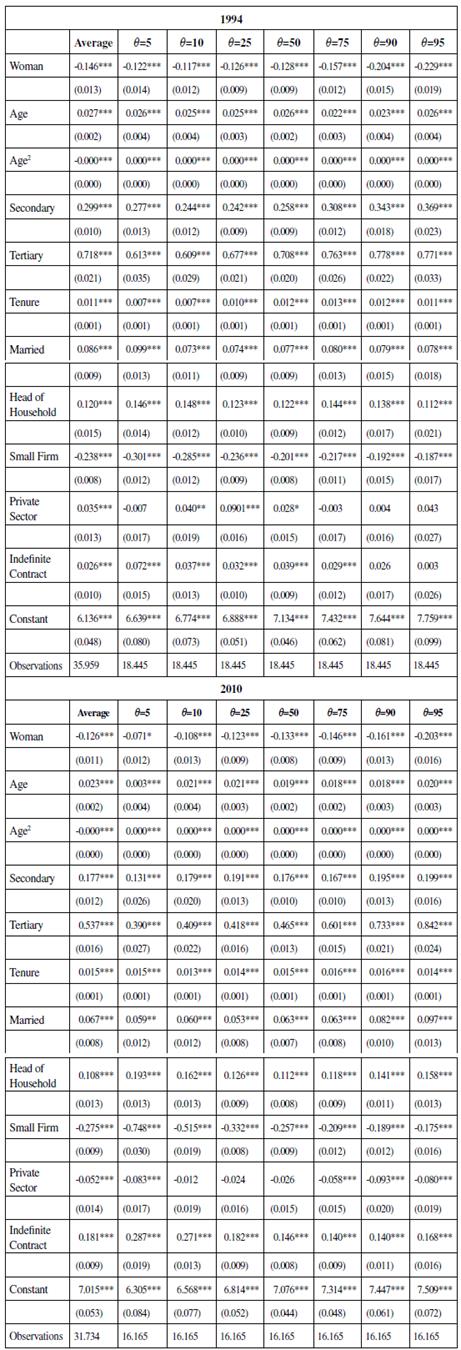
Table 9 presents OLS and quantile wage regressions for 1994 and 2010, respectively. Column 1 shows the results of the OLS regression and columns 2-8 show those of the 5th, 10th, 25th, 50th, 75th, 90th, and 95th quantiles.
Table 9 OLS and Quantile Regression 1994 and 2010
Dependent variable: Ln. real hourly wage. Robust standard errors in parentheses. ***, ** and * represent significance at 99, 95 and 90%, respectively. Nine dummies for region, seven for economic sector and twelve dummies for occupations are included. Control group: workers with less than secondary education who are domestic employees or work in the public sector in firms with more than 11 employees, widowed, divorced, separated or never married, non-heads of household and with contracts other than indefinite contracts.
Source: Author's own elaboration using data from Colombian Household surveys from 1994 and 2010.
The logarithms of real hourly wages are regressed against a set of covariates, which include a gender dummy to capture the adjusted gender wage gap-the gender gap after controlling for a set of observed characteristics. The controls included are age, age squared, two dummies for education (secondary and tertiary), tenure in current job, a dummy for marital status, head of household status, firm size, type of employment (private sector) and type of contract (indefinite contract). Controls for region, economic sector and occupation are also applied.
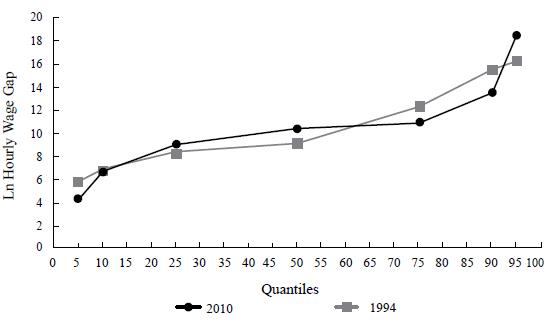
Consider first the results from the wage estimation for 1994. An issue to highlight is that, in all estimations, the gender indicator-the adjusted wage gap-is negative and statistically significant. Figure 6 shows the trend in the adjusted gender wage gap. For 1994, the adjusted gender wage gap is, on average, 8.5% and mono-tonically increases throughout the wage distributions: it is 5.8% at 5th quantile and 16.3% at the 95th quantile. This result shows the so-called ceiling pattern, which was first introduced by Albrecht, Bjorklund, and Vroman (2003) to refer to the fact that, in Sweden, women's wages fall further behind men's wages at the top of the distribution than in the middle or at the bottom. Our result is similar, although of a smaller magnitude, to their findings.
Source: Author's own elaboration using data from Colombian Household surveys from 1994 and 2010.
Figure 6 Adjusted Gender Wage Gap 1994 and 2010
The second panel of Table 9 shows the results of estimations for 2010. The adjusted gender wage gap is, on average, 9.4% at the mean and around 4.2% and 18.6% at 5th and 95th percentiles, respectively. There is also evidence of a glass ceiling effect for this year: comparing similar men and women, the gender wage gap is greater at the top of the distribution than at the middle or at the bottom.
At the mean, the adjusted gender wage gap slightly increased from 8.5% in 1994 to 9.4% in 2010, which represents 65.13% and 76.70% of the observed gender wage gaps, respectively. An important difference with respect to the raw gender wage gap computed in the previous section now emerges: the trend in the adjusted gap across the wage distribution monotonically increased in both years, there is a glass ceiling pattern and the raw gap which previously observed lower wages disappeared (see Figure 1). Therefore, the adjusted wage gap between men and women at the lower end of the distribution is small, but the gap monotonically increases.
Controlling for Sample Selection
Female labour force participation in Colombia increased by around 11 pp between 1994 and 2010 while male labour force participation remained roughly constant during the same period. This significant increase in female labour force participation may result in a change in the determinants of female selection into the labour market between the two periods under consideration. Given that this study compares female wages in the two periods to look at the gender wage gap, it is necessary to take into account the potential differences in the selection processes for women and men when they enter the labour market. Failure to account for this might bias the adjusted wage gap: as we found in the previous section.
Table 10 reports the results of estimations. The first column presents the wage gap regression at the mean, and the following columns present the 5th, 10th, 25th, 50th, 75th, 90th and 95th quantile regressions of wages, once non-random selection of workers has been controlled for in the samples.
Table 10 Quantile Regression Controlling for Selectivity in 1994 and 2010
Dependent variable: Ln. real hourly wage. Standard errors in parentheses. ***, ** and * represent significance at 99, 95 and 90%, respectively. Nine dummies for region, seven for economic sector and twelve for occupations are included in the main equation. Control group: employees with less than secondary education who are domestic employees or work in the public sector in firms with more than 11 employees, widowed, divorced, separated or never married, non-heads of household and with non-indefinite contracts. The selection variable is the predicted probability of working for all workers using probit estimation.
Source: Author's own elaboration using data from Colombian Household surveys from 1994 and 2010.
The first step is estimated using a probit model. The dependent variable of the participation equation takes a value of one if the individual is working and zero otherwise.14 Dummies for gender, age, region, education, marital status and head of household status are included. The presence of children under one year old in households, the number of children between two and six years old in households, non-labour income (NLI) and total family income (TFI) are also included as identification variables. Non-labour income is income from interest, pensions, rentals, remittances, etc. Total family income is defined as the total income of the household (labour and non-labour) minus the total individual income. Excluded covariates are statistically significant in the participation equation. Once all relevant variables are incorporated, identification variables included in the participation equation affect the participation decision but not wages. The main equation includes the same independent variables explained in Table 9.
Gender dummies are, once again, negative and statistically significant in all cases. For both years, the copula parameter is negative and statistically significant (-0.26 and -0.4 for 1994 and 2010, respectively), which implies that there is positive selection of women. That means that those women that are participating in the labor market have higher wages than those that are not into the labor market, if they participated. These results confirm that sample selection is an important issue to be taken into account when estimating wages in Colombia, and, if sample selection is not controlled for, the adjusted gender wage gap found is smaller than the actual gap.
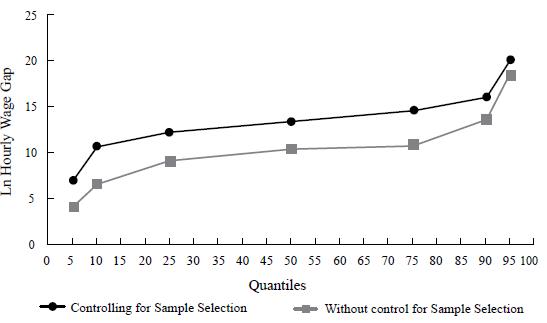
At the mean, sample selection explains around 72% and 34% of the raw wage gaps in 1994 and 2010, respectively. Figures 7 and 8 show the trend in the adjusted gender wage gap with and without controlling for sample selection in 1994 and 2010, respectively. As expected, the gap with control for sample selection is higher than the gap without it throughout the wage distribution. These figures reveal that the gap increases monotonically throughout the wage distribution, and the glass ceiling effect observed without control for non-randomness in the sample is stronger after controlling for selectivity. In year 1994, among the workers with the 5% of lowest wages, women receive 12.2% less than men with similar characteristics, and this gap increases to 22.9% among workers who gain 5% of the highest wages. Unlike the estimated gender wage gap found in 1994, in 2010 it was reduced in all quantiles except in the middle of the distribution. The biggest reduction is observed in quantiles 5 and 90.
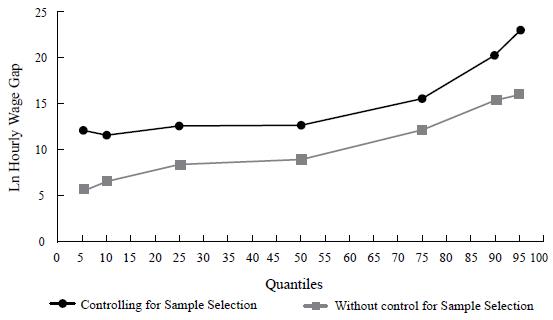
Source: Author's own elaboration using data from Colombian Household surveys from 1994 and 2010.
Figure 7 Adjusted Gender Wage Gap 1994 while Controlling for Sample Selection
CONCLUSIONS
This paper studies the evolution of the gender wage gap in Colombia in 1994 and 2010. In particular, it is focused on the study of changes in the raw gender wage gap and the adjusted gender wage gap throughout the wage distribution in Colombia. Also, it analyses how changes observed in education and other labour characteristics have contributed to explain its evolution.
With respect to changes in the raw gender wage gap, we focus on the remarkable changes in education, type of employment and type of contract that the Colombian labour market has gone through between 1994 and 2010. Our counterfactual wage distribution reveals that changes in the education level, type of contract and type of employment are found to be crucial in explaining the observed changes in the wage distribution of female and male workers and, therefore, in the gender wage gap. In particular, the increase in the proportion of women with tertiary education, compared to men, has helped to reduce the gender wage gap, especially at the top of the wage distribution. On average, educational attainment has contributed to decrease the gap by around 4 pp, and the impact has been higher at the high end of the wage distribution.
The reduction in public-sector jobs has helped to increase the gender wage gap as relatively more women have been affected by the reduction from public sector jobs, with a significant wage reduction. This effect is higher at the high end of the wage distribution. Finally, the reduction in the proportion of indefinite contracts has also helped to increase the gender wage gap as more women than men have been affected by the reduction in hiring by indefinite contract. This impact has been particularly high at the bottom end of the wage distribution.
Taken together, the effects of all three changes prove to have increased the gender wage gap. The increasing effects of the reduction in public-sector jobs and the proportion of indefinite contracts more than offset the decreasing effects of the increase in educational attainment.
Furthermore, we studied the trend in the raw and adjusted gender wage gap throughout the wage distribution. The raw gender wage gap shows a U shape, with remarkable gaps at the two ends of the wage distribution. However, when observable characteristics are controlled for, the U shape disappears. For both years under study, the adjusted wage gap increases monotonically throughout the wage distribution, evidencing a glass ceiling pattern. At the 95th percentile, the gap is around 23% in 1994 and it slightly reduces to 20% in 2010. In addition, given that female labour force participation increased by around 11% between 1994 and 2010, we found a positive selection of women participating in the labour market. This allows us to conclude that failure to take into account the selection bias would result in the gender gap being underestimated. The gender wage differential has reduced in almost all quantiles between years 1994 and 2010, except in the middle of the distribution. The main reduction of the gap is observed among those workers who gain 5% of the lowest wages, which goes from 12.2% to 7.1% in 2010.

