English (pdf)
 Article in xml format
 Article references
 Send this article by e-mail
 Cited by SciELO
  Cited by Google
  Similars in
SciELO
Similars in
SciELO  Similars in Google
 Permalink
INTRODUCTION
The purpose of this paper is to investigate the underrepresentation of women in academic economics in Brazil. First, we analyse the evolution of their academic careers, using a novel dataset collected by our research group, the Brazilian Women in Economics Group - BWE1 ("EconomistAs", in Portuguese). Second, we investigate the research career by examining data on participation in two leading national economics conferences, the meeting of the Brazilian Association of Postgraduate Programmes in Economics (ANPEC meeting)2 and the meeting of the Brazilian Econometric Society (SBE).3 The concern with the lack of women in academic economics evolved into an increasingly robust research, aiming to understand why women are under-represented in economics departments, why their share of academic positions does not increase and what can be done to address these problems. However, most of the research has been undertaken for the United States,4 and we contribute to the literature by gathering and discussing evidence for a developing country.
To study female participation across the various stages of an academic career, BWE conducts an annual national survey of 52 departments which have graduate programmes in economics.5 The survey aims to assuage the scantness of systematic data on female representation in more advanced training and career stages in the country's main economics departments. It has already collected two datas-ets, 2018 and 2019, with information from 69.2 % and 63.5 % of the programmes, respectively.6 For international comparisons, we use the same questionnaire as the American Economic Association's Committee on the Status of Women in the Economics Profession (CSWEP), which has been collecting data and analysing female representation in the academic career of economics since the 1970s.7 The survey collects annual data on the gender composition of faculty and students in Brazilian economics departments. The questions refer to: (i) the number of faculty members at each academic career stage (assistant, associate and full professors) by gender, (ii) the number of faculty members in administrative positions (as heads or coordinators) by gender, and (iii) the number of students who completed their education at undergraduate, master and doctoral levels. The data allow the discussion of the "leaky pipeline" of women in academic careers.
We observe that the share of female students enrolled in undergraduate programmes in Brazil is consistently smaller than the male share, and it instead further diminishes when women advance through the different career stages. We believe that the first and one of the most important bottlenecks for women in the academic career of economics in Brazil is the the unified graduate admission exam in economics, the ANPEC exam. Therefore, besides the data from our questionnaires, we also present descriptive statistics using data from the ANPEC exam and we find that, from 2009 to 2019, the share of women accepted in the most competitive graduate programmes8 in economics was 19% versus 32% in programmes evaluated with lower scores.
To study gender differences in research careers, we analyse the unique data kindly provided by ANPEC and SBE, the main academic economics associations in Brazil, on the submissions to their annual meetings. We are able to construct a panel for the ANPEC meeting from 2007 to 2017 and for the SBE meeting from 2012 to 2017. This panel contains information regarding submitted articles, those approved and rejected and their authors. It also provides information regarding the composition of the scientific committee, the meeting organizers and the discussants (only ANPEC meeting). From these data we find that acceptance rates for women are smaller, but the difference is not statistically significant. In addition to that, we also find differences in the representation of women among sub-areas of economics, suggesting a field bias towards applied areas.
Our paper is related to the growing body of the literature that discusses the barriers at various stages in the training and promotional pipeline of academic economics. Ginther and Kahn (2014) found evidence that the probability of achieving tenure is 20% higher for men than for women in economics, while it is only 12% higher in other social sciences. The gender gap in the probability of promotion is even higher: 50% for economists and 25% for the other social sciences.9
Ceci et al. (2015) found that the gender gap in the probability of tenure disappears for all disciplines, except economics, when controlling for productivity. Sarsons (2017) revealed that co-authorship does not impact the likelihood of receiving tenure for male economists. The same is not true for women, that are less likely to receive tenure, the more they co-author, indicating that credit is gender-biased. Hengel (2017) argued that female papers in top journals go through a longer and more rigourous (higher quality in writing) process of peer review. As improving writing takes time, women end up having less time to write new papers. They also go through a longer revision process. Chari and Goldsmith-Pinkham (2017) found no significant differences in the representation of women economists in the NBER Summer Institute Programmes.10 On the other hand, Hospido and Sanz (2019) found that female-authored papers were less likely to be accepted than male-authored papers in European conferences (the Annual Congress of the European Economic Association, the Annual Meeting of the Spanish Economic Association, the Spring Meeting of Young Economists). Male referees are more favourable to male-authored papers, while female referees evaluate papers uniformly, despite the gender of the authors. Therefore, the gap is entirely routed by male referees. Card et al. (2020) also concluded that male and female referees set higher standards for female-authored papers using data on referee recommendations and editorial decisions.
This article is organized in four sections, besides this introduction. Section 2 briefly discusses the gender composition of undergraduate and graduate students in economics. It also describes what we suspect to be the first bottleneck in academic careers in Brazil, the national admission exam for graduate programmes. Section 3 evaluates the submissions to the two main economics meetings by gender over time and across areas. Finally, section 4 summarises the main conclusions.
THE GENDER MIX OF STUDENTS
Undergraduate and Graduate
Previous research has documented a gender gap in the propensity to study economics at the undergraduate level. Emerson, McGoldrick, and Mumford (2012) found evidence that in the U.S. women are less likely to major in economics, even after controlling for several factors, including mathematics aptitude. Avilova and Goldin (2018) demonstrated that women are more sensitive to grades than men when choosing to major in economics. In this sense, women are dissuaded by a poor performance in introductory courses, while males major in economics no matter what their grades might be.11
It is not easy to characterise the path of women in economics in Brazil because there are no economics courses in high school and students must choose their field of specialisation at the same time they apply for admission to college or university (students are not admitted with an undeclared major).
There are two admissions systems to universities in Brazil. The first, is a centralised system called "Unified System of Selection" (Sistema Unificado de Seleção - SISU) through which students can apply mainly to public universities all over the country using their scores from the national admissions test ENEM (Exame Nacional do Ensino Médio). This system functions twice a year (January and July). Each candidate can choose two career options (a combination of university and field of study) and must rank them at the moment of filing the application. The system calculates the cutoff score (the minimum exam score required in order to be accepted in each university/field) every day so the candidates are aware of their chances regarding their two most preferred choices. Based on this information, the candidates decide whether or not they want to maintain their choices or change to degree programmes that increase their probability of admission.12 This process continues for a few days and then the system closes. The second, is a decentralised system called "vestibular". It is also an admissions test, used mainly by private universities. Each university administers its own exam, once or twice a year, for each field. Therefore, when a student decides to take to the exam ("vestibular") he/she is choosing a university and a degree programme at the same time.
In order to have a reference point we also queried the universities regarding their undergraduate students. Table 1 shows that women accounted for 37% of the undergraduate students in 2017 and 38% in 2018. These numbers are not much different than the ones identified for the United States where men outnumber women as undergraduate economics majors by three to one (Avilova & Goldin, 2018). The reasons for the underrepresentation of women are not yet clear. According to Bayer and Rouse (2016), there are supply and demand justifications. On the supply side, the evidence indicates that the lack of role models plays an important part in the underrepresentation of women and minorities with respect to the career. On the demand side, the authors suggest that implicit bias13 can affect interactions at all career stages, in formal decisions or even in routine interactions, such as advising students on courses or responding to questions and ideas from colleagues. However, the literature still seeks more evidence on this matter.14
Table 1 Number of graduates, by programme, 2017-2018
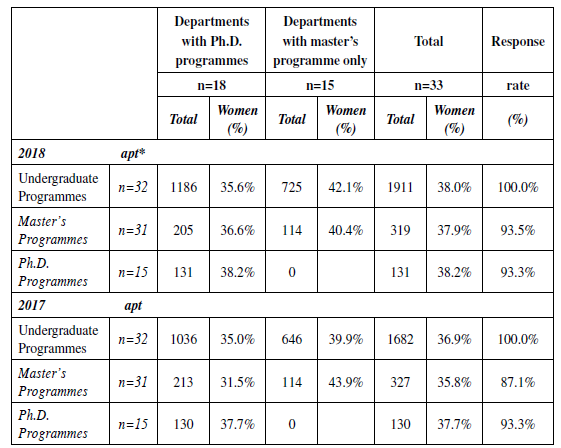
Notes: *We consider "apt" as follows: (i) for undergraduate programmes, it refers to the number of institutions that responded to the survey and have a degree programme in economics; (ii) for master's and Ph.D. programmes, it refers to the number of institutions that already have graduated classes. The response rate refers to the ratio between the number of departments that responded to the survey and the total number of departments in the same category.
Source: Author's own elaboration.
Besides the lower share of women enrolled in undergraduate economics courses, there seems to be another struggle when women choose to pursue graduate programmes in economics. To enroll in a master's programme in Brazil, students must take a unified admission exam organised by the National Association of Postgraduate Programmes in Economics (hereafter, ANPEC). The ANPEC exam can certainly be considered the first step to an academic career in economics in Brazil. Although a master's degree is not a prerequisite to apply to a Ph.D. programme, the practical rule is to first finish a master's programme and then pursue a Ph.D. (within the country or abroad). This issue will be further discussed in Section 2.2.15.
Table 1 displays the number of diplomas awarded in the academic years 2017 and 2018 by gender. The percentage of women graduating at all levels (undergraduate, masters and Ph.D.) is quite uniform. With regard to all the programmes the percentage varies between 36% and 38%. The percentage of women increased marginally at all levels from 2017 to 2018, but the differences between the two years are not statistically significant (see Appendix Table A2).
Table 2 shows the percentage of graduating women according to the type of university, private or public (state or federal). The participation of women is comparatively higher in undergraduate programmes at federal universities and this difference is statistically significant at 1% (Appendix Table A3). For the master's and Ph.D. programmes, the difference is not statistically significant. Despite that, the results for the master's programmes are noteworthy, although not surprising. Since some private institutions are very prestigious and are well evaluated by CAPES, the low percentage of women reflects the results observed by the quality of institutions. For private institutions, we note that the proportion of women decreased in 2018 in comparison to 2017 at the undergraduate and master's levels - with significance levels of 5% and 10%, respectively. For the doctoral programmes, in 2018 the proportion of graduating women increased compared to 2017, but this difference is not statistically significant (Appendix Table A4).
Table 2 Number of graduates by programme (undergraduate, master's and Ph.D.) and type of institution (private/public), 2017-2018
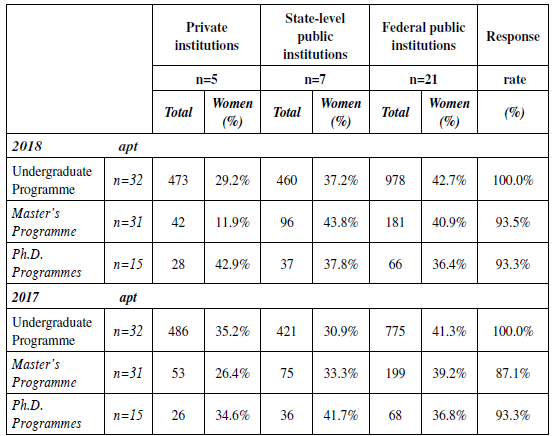
Notes: We consider "apt" as follows: (i) for undergraduate programmes, it refers to the number of institutions that responded to the survey and have a degree programme in economics; (ii) for masters and Ph.D. programmes, it refers to the number of institutions that already have graduated classes. The response rate refers to the ratio between the number of departments that responded to the survey and the total number of departments in the same category.
Source: Author's own elaboration.
The picture changes significantly when we look at female representation by quality of the graduate programme, measured by CAPES scores.16 CAPES evaluates graduate courses (master's and Ph.D.) in Brazil based on several criteria, among which the most important is the quantity and quality of faculty publications. The scale of CAPES scores ranges from 1 to 7 (7 being the highest score). Scores 1 and 2 imply disqualification of the programme, hence we only analyse educational institutions with scores from 3 to 7.
Table 3 shows that the percentage of women among students who completed their education is higher in programmes with lower scores. For example, women rep resent 50% of the students that receiving a Ph.D. degree from universities with a score of 3, and only 38.8% from universities with a score of 6 or 7 in 2017. In 2018, the difference is not that great (40% and 36%). What captured our attention is the small percentage of women in the higher quality master's programmes. In 2017, approximately 22% and 40% of the students were women in the more qualified and less qualified master's programmes, respectively. In 2018, the numbers were quite similar (23% and 42%).
Table 3 Number of graduates, by programme and CAPES score, 2017-2018
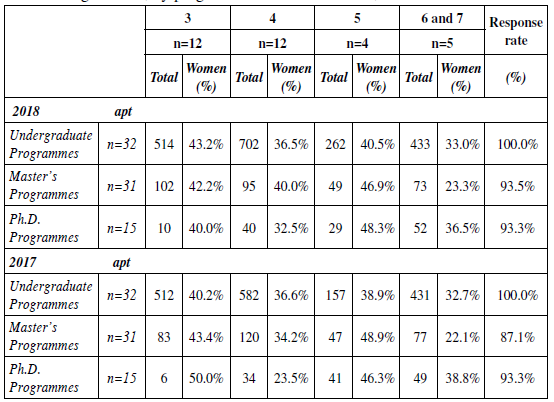
Notes: We consider "apt" the following: (i) for undergraduate programmes, it refers to the number of institutions that responded to the survey and have a degree programme in economics; (ii) for master's and Ph.D. programmes, it refers to the number of institutions that already have graduated classes. The response rate refers to the ratio between the number of departments that responded to the survey and the total number of departments in the same category.
Source: Author's own elaboration.
Where the "leakage in the pipeline" seems to begin: the ANPEC exam
As mentioned, ANPEC is the association that convenes institutions that develop research and training activities at the graduate level in economics in Brazil. Since its foundation in 1973 it has been exerting a leading role in guiding the development of the economics profession in the country (Fernández & Suprinyak, 2018). ANPEC is responsible for promoting institutional interaction among research centers, for conducting the unified national admission exam for graduate programmes (the ANPEC exam) and for organising the national economic meeting, an influential economics conference where recent original works are presented and discussed.17 In order to enroll in a master's programme, most students take the ANPEC exam. According to Petterini (2020), only one out of 52 universities does not use the ANPEC exam to select students for its graduate programme - highlighting the relevance of the exam as the first step to an academic career in economics.
The ANPEC exam takes place once a year, usually in September, and it is a compound of tests on microeconomics, macroeconomics, mathematics, statistics, the Brazilian economy and English. Each candidate scores a total number of points on each test and these scores are standardised. Then ANPEC releases a ranking of candidates based on these standardised scores.18 However, each university has autonomy in choosing its own weights and hence in developing its own ranking to select students.19 An advantage of this national exam format is the possibility of settling disputes on the part of students from any region and reducing endogeneity and the power of supervisors.
Two aspects of the exam deserve special attention. The first is the selection procedure: when registering for the exam, candidates submit a list containing a maximum of six desired universities without any order of priority. After the release of the ranking, universities have one week to contact the candidates and make them an offer. Every applicant who has received an offer must complete a form to give "definite" or "conditional" acceptance. If the candidate opts for final acceptance, the process ends and he/she will no longer receive offers from other schools. If the candidate chooses conditional acceptance, he/she will temporarily select the university inviting him/her, but at the same time will also reveal whether he/she would rather attend another university and is still hoping to be accepted. After this first round, a second round starts and the candidates can still choose between "definite" or "conditional" acceptance. In the third, and final round, it is only possible to accept definitively.
Most of the best candidates want to enroll in the best graduate programmes (CAPES score 7) and the best programmes want to be chosen by the best students. During the three rounds, the universities advertise themselves, emphasising the qualities of their programmes and the future perspectives their programmes can provide. To illustrate how extremely competitive the process is, to be accepted by one of the "top 4" institutions the candidate must be among the 80 best ranked candidates out of approximately 1,200. Aside from that, students believe that the university they choose will make a huge difference in their future, so they put a lot of pressure on themselves to perform really well on the exam. The rewards come not only in the form of greater job opportunities and better paid jobs, but also in more prestigious Ph.D. placements, especially abroad. Generally speaking, professors at the best universities have better networks. These universities also have a better reputation abroad since they have a history of sending excellent students to the best Ph.D. programmes and many of them become professors at American and European universities. Therefore, there is a general belief20 that the best way to start an academic career is to obtain a master's degree from one of the "top 4" universities.
The second important aspect is the exam itself. The questions are mainly true or false, where wrong answers are penalised in the sense that they can yield negative points. More precisely, an incorrect answer cancels a correct one. Omissions are not penalised and yield zero points. There are a few open questions for which there is no penalty. This scoring rule implies that the number of omitted questions will affect the probability of entry, that is to say, there is a strategic component involved in the exam.
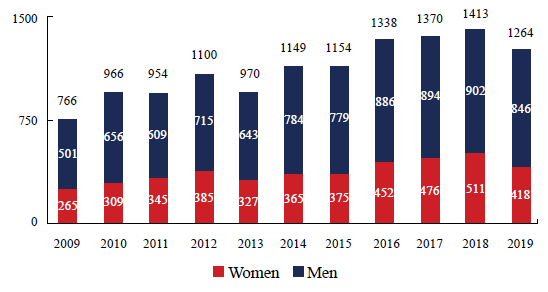
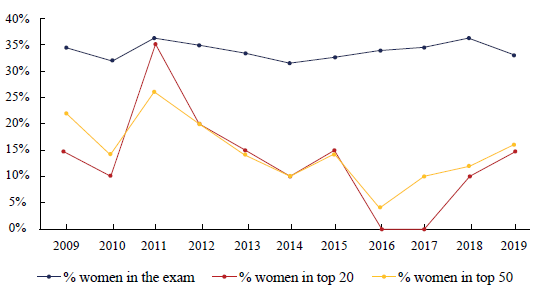
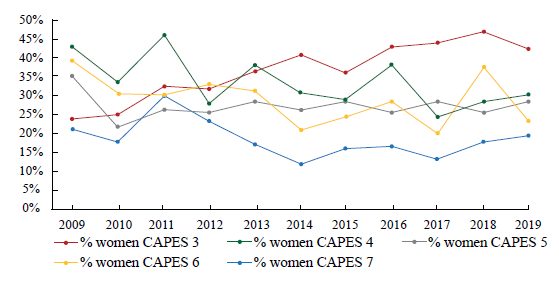
To explore the possible differences in performance among men and women, we look at the exam microdata kindly provided by ANPEC. The data provide information on the candidates' characteristics, their performance on each test and their university choices. We use data from 2009 to 2019. On average, 1,131 candidates take the exam each year. Figure 1 illustrates that there are slight variations over the years, but the percentage of women was stable throughout the whole period, varying between 31.8% in 2014 to 36.2% in 2018. These percentages are similar to the average percentage of women with an undergraduate diploma in economics, as discussed before. However, when we take into account only the candidates in top positions according to the ANPEC official ranking, there is a drop in women's participation. Figure 2 shows that on average 14.7% and 13.2% of the students in the top 50 and 20 positions, respectively, are women. As a reflection of these results, there is a much smaller proportion of women that are accepted by the most competitive institutions, especially those evaluated with a score of 7 by CAPES. From 2009 to 2019, the participation of women in score 3 programmes was on average 37%, versus 19% in score 7 programmes. Figure 3 shows the percentage of women per programme score per year. The proportion of women in score 7 programmes is consistently lower than in programmes with lower scores.
Source: Author's own elaboration based on ANPEC microdata.
Figure 1 Total ANPEC Exam Candidates by Gender, 2009 to 2019.
Source: Author's own elaboration based on ANPEC exam microdata.
Figure 2 Percentage of Women Among "ANPEC Exam" Candidates by Classification in the Exam, 2009 to 2019
Source: Author's own elaboration based on ANPEC microdata.
Figure 3 Percentage of Women Among Accepted Students by CAPES Scores, 2009 to 2019
Pursuing a master's or Ph.D. degree in programmes with higher CAPES scores is not a synonym of success. However, as we mentioned before, these programmes present some advantages for students who want to pursue an academic career in Brazil - especially regarding networks and connections with top research centers and renowned economics departments abroad. Hence, this might be the first bottleneck that women face in a career as economists.
A growing specialised literature on economics shows there are consistent gender differences in performance under competition, attitudes towards competition, attitudes towards risk and overconfidence. This evidence helps to explain our results. For example, Gneezy et al. (2003) found evidence that women perform worse than men in competitive environments, although they perform similarly in non-competitive ones. Nierdele and Vesterlund (2007) underscored that women seek to avoid competitive situations while men seek to embrace them.. They also pointed out that this difference in behaviour is due to lower female expectations regarding performance. Dohmen and Falk (2011), on the other hand, attributed this difference to gender differences in the attitudes towards risk.
These are all examples of experimental evidence and we expect that attitudes concerning competition should matter even more in educational contexts where evaluation is mostly based on relative performance. An important example of a high stakes competitive setting in education is university entrance examinations. Ors et al. (2013) and Jurajda and Munich (2011) established that women perform worse than men in academic examinations with high future payoffs. For Brazil, Borges et al. (2021) investigated the examination behaviour of women versus men using data from one of the most competitive exams in Brazil, the UNICAMP exam, which selects undergraduate students for UNICAMP, a prestigious and selective Brazilian university. Their research found that women more than men, fail to prioritise subjects that count more towards the final score and, consequently, men outperform women in parts of the admission exam with relatively higher stakes. The authors also provided some evidence of gender differences in perfectionism and self-confidence as potential channels to explain their results.
Particularly important evidence, given the similarity with the ANPEC exam, is provided by Pekkarinen (2015). He studied gender differences in performance on entrance exams for economics and business programmes at Finnish universities. The exams in Finland involve multiple choice tests, and are similar to the Brazilian exam in the sense that wrong answers are penalised with negative points while omissions yield zero points. He obtained evidence that women perform worse than men on the admission exam and are less likely to be accepted at the universities. Women also omit more items than men, and as a consequence they deviate more from the number of items that would maximise the probability of being accepted.
These are all speculative explanations, since we have not performed any formal tests so far. However, understanding gender differences in performance on the ANPEC exam seems an interesting avenue of research and certainly one that we intend to explore in future studies.
THE CAREER GENDER MIX
Women in Economics Departments
In this section, we investigate female participation in the academic career of economics in Brazil. The procedures to become a university professor in economics in Brazil differ between private and public universities. Private universities select their professors based mainly on their publication history and their academic background. Public universities also take these aspects into account, but they also require participation in a public competition ("concurso"). The candidates are required to teach a class on a topic randomly selected from a list of topics provided in advance. Often, a written test is also required, also with a topic randomly selected from the same list. The entry costs for public universities are higher in the sense that candidates have to make an extra effort to prepare the class (certainly it is much easier to present their own research) and are subject to luck since the topic drawn in the lottery may not be their most preferred.
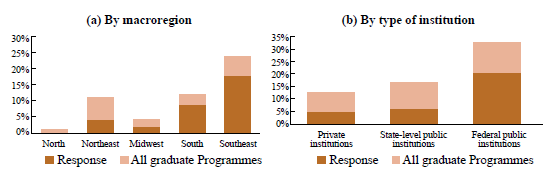
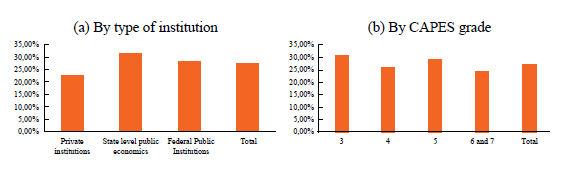
There are differences between private and public institutions in the earlier stage of the academic career. While we find that 27.5% of overall faculty members are women (295 out of 1,074), Figure 4 shows that women represent 22.7%, 31.6% and 28.3% of all faculty members in private, state public, and federal public institutions, respectively. Besides this, female participation is higher in departments with the lowest CAPES scores, but not significantly higher than in institutions with a score of 5. Since the universities with higher CAPES scores are mainly private, there is a lower percentage of women in the most prestigious institutions.
Source: Author's own elaboration based on public data.
Figure 4 Distribution of Women in Economics at Educational Institutions, by Region, Public/Private, and CAPES Score, 20190
It is important to call attention to the fact that the pool of candidates for private universities is composed mainly of those who received a Ph.D. abroad and a master's degree in Brazil at an excellent university (Capes 7). The low participation of women in private institutions should not come as a surprise, since we set forth before that only around 20% of masters' students are female and only a few attend the most prestigious programmes.
Another relevant aspect to analyse is the difference between men and women in career evolution. Table 4 shows the total number of faculty at each stage of the academic career, and separately between institutions with Ph.D. programmes and those with master's programmes only. We split the sample to capture the heterogeneity between institutions. The data show that the number of women tends to be lower in more advanced stages of the academic career. Women represent 20.8% of full professors, 24.6% of associate professors, and 30.5% of assistant professors. Therefore, the higher the career position, the lower the percentage of women tends to be.
Table 4 Gender Distribution of Faculty by Career Stage and Programme, 2019
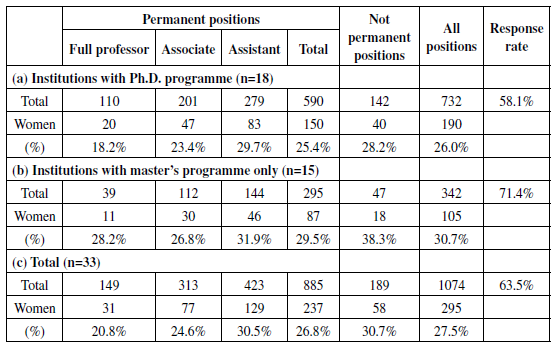
Note: Non-permanent positions include temporary, visiting postdoc, senior faculty, postgraduate collaborators without formal ties, emeritus professors and other non-categorised classifications. The response rate refers to the ratio between the number of departments that responded to the questionnaire and the total number of departments in the same category. This data was reported by the participating departments.
Source: Author's own elaboration.
The numbers for Brazil are similar to those for the United States. According to the 2019 CSWEP report (Levenstein, 2020), 14.5% of full professors are women, 25.8% are associate professors (with and without tenure), and 30.3% are assistant professors (with and without tenure).21 On the other hand, women compose 34.7% of non-permanent researchers, a number higher than that observed for Brazil. The United Kingdom and Canada do not present a very different scenario. Besides, women generally have a higher representation at institutions which do not have a Ph.D. programme. The 2017 report by the Royal Economic Society indicates that women represented 16.6% of full professors, 26.5% of associate professors, 35.0% of assistant professors and 39.9% of researchers in non-permanent positions (Tenreyro, 2017). For Canada, based on the 2017 CWEN / RFE report, the percentages were 13.6%, 29.4%, 21.6% and 46.1%, respectively (CWEN, 2017).22 This phenomenon is known in the literature as the "leaky pipeline" as women move less from assistant to full professorship.
Here it is important to call attention to the fact that academic promotion in Brazilian public universities also occurs by means of a contest. On this point, Bosquet et al. (2019) provided a possible explanation for the observed "leakage". In France, academic career progress also involves a contest (concours). The list of applicants is publicly available at the time of the competition and also the information on the pool of potential applicants (those holding junior positions), because academicians are civil servants. Therefore, two questions are addressed: whether gender impacts the decision to become a candidate and whether gender affects the probabilities of promotion. In fact, women are less likely than men to enter promotion competitions. However, the probability of promotion conditional on applying is not significantly lower for women.
In Table 5, we also present the participation of women at each stage of the academic career according to the graduate programme score in the CAPES evaluation (2013-2017). Programmes with the highest scores (6 and 7) were grouped such that we maintain confidentiality of the very few outstanding programmes. Again, we observe the "leaky" nature of the pipeline, especially for the higher quality graduate programmes (scores 6 and 7). While women represent 25.9% of the assistant professors, they make up only 16.3% of the full professors. For good programmes (score 5), it is difficult to become an associate professor, but there is not much difference between the percentage of associate professors and full professors. Finally, for score 3 programmes, women manage to move through the pipeline, and 37.9% become full professors.
Table 5 Gender Distribution of Faculty by Career Stage and CAPES Score, 2019
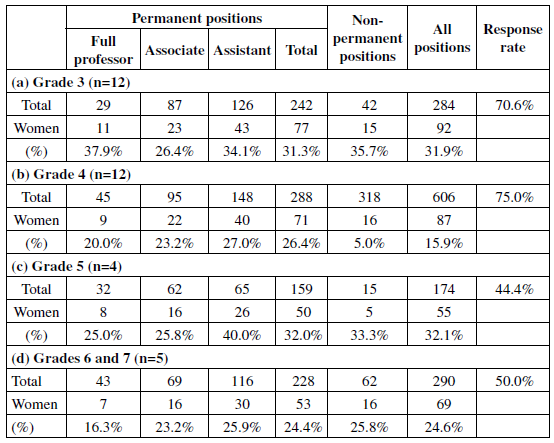
Note: Non-permanent positions include temporary, visiting postdoc, senior faculty, postgraduate collaborators without formal ties, emeritus professors and other non-categorised classifications. The response rate refers to the ratio between the number of departments that responded to the questionnaire and the total number of departments in the same category. This data was reported by the participating departments.
Source: Author's own elaboration.
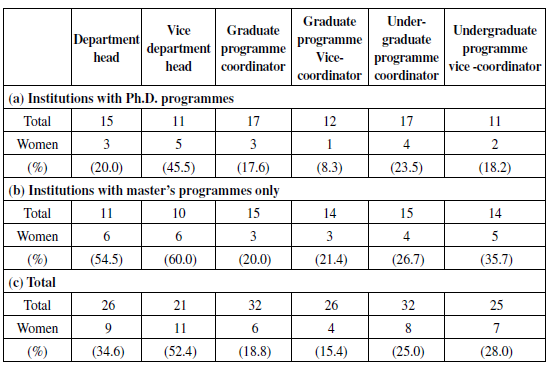
One possible explanation for women progressing less in their careers would be the fact that they assume more administrative positions. Table 6 reports the gender composition of faculty members in terms of administrative positions. Not all departments have all the positions listed, so the number of observations varies with each position. Of the 33 programmes that responded to the survey, 26 have a department head, of which 34.6% are women. Among graduate programme coordinators, 18.8% are women, and among undergraduate programme coordinators, this percentage is 25.0%.
Table 6 Faculty in Administrative Positions, by Programme Type, 2019
Source: Author's own elaboration.
The literature provides some explanations for the leaky pipeline that seem suitable for Brazilian reality, although more extensive research is necessary to support them. One is the difference in time spent on research and teaching. Siegfried and Stock (2004) found statistically significant differences in the time allocations to teaching and research between males and females. The average female (male) academic reported spending 31% (22%) of her (his) time on teaching and 40% (47%) on research. If research activities have greater impact on promotion than teaching activities, as is the case in Brazil, this difference in the allocation of time appears to be a good explanation. There is also evidence showing unequal treatment of women in other aspects related to publishing, the main criterion of academic success, as we discussed in the introduction (Sarsons, 2017 for credit for authorship, Hengel, 2017 and Card et al., 2020 for the process of peer review). Finally, we cannot overlook the classic argument that reproductive age and career progression occur at the same time.
Female Participation in Economics Meetings
Evaluation of Submissions
Given the evidence that women progress less in an academic career, we now ask why this occurs. We can explore several possible reasons, but one that comes immediately to mind is productivity. As observed by Hamermesh (2020) "most academic economists judge their own and their peers' achievements by number of publications, with special emphasis given to publications in journals that are considered to be more prestigious. The reason is simple: these signals of achievement require very little effort in gathering information and necessitate almost no thought" (p. 11).
Participation in academic conferences can be viewed as a leading indicator of future publication. Conferences increase the visibility of new articles, facilitate the construction of networks for institutional exchange and co-authorship, and are an efficient way to take advantage of peers' comments and suggestions (Casadevall & Handelsman, 2014; Casadevall, 2015; Kalejta & Palmenberg, 2017). Participation at conferences also directly influences career progression at public Brazilian universities. Therefore, at this point we want to take a step back and look at the gender differences in the evaluation of submissions to economics conferences.
In Brazil, the two main national economics conferences are the ANPEC and SBE annual meetings. ANPEC and SBE are parallel meetings that have taken place in December since 1979.23 Paper submissions and selection procedures are quite standard as in major conferences in the US or in Europe.
The evaluation of the articles submitted to the ANPEC meeting is single blinded. The members of the scientific committee do not know the identity of the authors, but the authors know who evaluates their submissions. Submissions can be made in one of 13 different areas: Area 1 - History of Economic Thought; Area 2 - Political Economy; Area 3 - Economic History; Area 4 - Macroeconomics, Monetary Economics and Finance; Area 5 - Public Sector Economics; Area 6 - Growth, Economic Development and Institutions; Area 7 - International Economics; Area 8 -Microeconomics, Quantitative Methods and Finance; Area 9 - Industrial Economy and Technology; Area 10 - Regional and Urban Economics; Area 11 - Agricultural and Environmental Economics; Area 12 - Social Economics and Economic Demography; and Area 13 - Labour Economics.24 The articles submitted to the SBE meetings, on the other hand, are evaluated through a non-blinded system, so the scientific committee knows the authorship of the papers and the authors know who judges their papers. The papers can be submitted in a small number of areas: Area 1 - Applied Microeconomics; Area 2 - Applied Macroeconomics; Area 3 -Econometrics; Area 4 - Finance; and Area 5 - Economic Theory.
There are some important differences between the two meetings.
First, the SBE meeting clearly has greater interest in more theoretical studies and empirical works that apply advanced econometric methods to economic problems. In this sense, we have many reasons to believe that the focus of the ANPEC and SBE meetings is different.
Second, there are important differences regarding the composition of the organising committees of both meetings. Most importantly, the profile of the professors/ researchers that compose the scientific committees of the ANPEC and SBE meetings is quite distinct.25
The average score for the SBE organising committee, measured by CAPES scores of the graduate programmes where their members teach and/or research, is higher than the average score for the ANPEC organising commmittee, and the difference is statistically significant at 10%.The average score for the ANPEC committe was 5.70, while the average score for the SBE committee was 6.23.26
Using the same metric, we also investigate the scores of each conference's scientific committee. Panel A of Table 7 shows that ANPEC's scientific committees were mainly composed of professors/researchers from Brazilian universities classified with grades 3,4 and 5 by CAPES (62% of the members on average), and that there have never been any members from international universities. On the other hand, panel B of Table 7 shows that the members of SBE's scientific committee were associated to renowned international universities, international organisms and regional federal reserves in the United States27 (46% on average) and from Brazilian universities classified as grades 6 and 7 by CAPES (35% on average). Although these are not precise measures of "academic performance", we use them as proxies to show the distinct characteristics of each conference.
Table 7 Scientific Committee Composition by Conference, 2013-2017
Source: Author's own elaboration.
As we will show, this does not imply that it is more difficult to present a paper at the SBE meeting. On the contrary, we find that the average acceptance rates are higher in SBE meetings, that can be explained by the degree of segmentation of the meetings, and by the fact that SBE covers a much narrower range of topics compared to ANPEC.
In order to obtain data from all the submissions made, we directly contacted the organisers of the last two meetings who kindly provided the data that allowed us to construct a panel for ANPEC from 2007 to 2017 and for SBE from 2012 to 2017. This panel contains information about the submitted articles, those approved and rejected, their authors and the programme organisers. In addition, for sessions with discussants, the data includes their names. We then identify the gender of the authors, discussants, and organisers. Because the data do not include gender, we had to build a gender variable from a two-stage procedure using the individuals' first names. First, we used data from the Brazilian Superior Electoral Court (TSE),28 which provides electoral information for several years, containing the candidate's first name29 and their respective gender, to construct a measure of probability for the name being identified as masculine or feminine. Second, we matched this database with the submissions database. For names with a probability greater than 90% of being feminine (masculine), the author's gender was identified as woman (man).30 From these data we calculated basic statistics on the evolution of women's participation over time.
Regarding ANPEC, out of 7,990 articles submitted by 18,218 authors in 11 years, 33.1% were accepted. Table 8 shows that the number of articles submitted varied year by year, without a clear pattern, with acceptance rates indicating the degree of competitiveness of the meeting. In 2007, the lowest acceptance rates were observed (21%) and in 2011 and 2016 the highest (38%). The Table also draws attention to the stability of the average number of authors per article, which for all years was slightly higher than 2.
Table 8 Evolution of the Number of Articles (Submitted and Accepted) and Average Number of Authors per Article - ANPEC
| Articles | Number of authors per article | ||||
|---|---|---|---|---|---|
| Year | Submitted | Accepted | % accepted | Submitted | Accepted |
| 2007 | 829 | 177 | 21% | 2.12 | 2.18 |
| 2008 | 672 | 210 | 31% | 2.11 | 2.17 |
| 2009 | 624 | 233 | 37% | 2.20 | 2.24 |
| 2010 | 618 | 165 | 27% | 2.20 | 2.38 |
| 2011 | 626 | 237 | 38% | 2.20 | 2.36 |
| 2012 | 794 | 243 | 31% | 2.26 | 2.23 |
| 2013 | 703 | 241 | 34% | 2.24 | 2.27 |
| 2014 | 780 | 240 | 31% | 2.33 | 2.30 |
| 2015 | 958 | 239 | 25% | 2.38 | 2.37 |
| 2016 | 638 | 240 | 38% | 2.44 | 2.50 |
| 2017 | 748 | 240 | 32% | 2.41 | 2.38 |
Source: Author's own elaboration.
Table 9 shows that the SBE meeting is much smaller than the ANPEC meeting, as revealed by the number of submitted articles. While over 600 papers are typically submitted to the ANPEC meeting (see Table 8), fewer than 200 papers are submitted to SBE every year. Still, the acceptance rate of the SBE is quite high, over 50%, and reached 62% in 2014. This reflects the degree of segmentation of the two meetings, with fewer but more renowned researchers submitting papers to the SBE event. Also, unlike the ANPEC meetings, there are no discussants at SBE meetings, making it possible to include 4 articles instead of 3 articles in each session. As in the ANPEC submissions, there are two authors on average per article.
Table 9 Evolution of the Number of Articles (Submitted and Accepted) and Average Number of Authors per Article - SBE
| SBE Articles | Number of authors per article | ||||
|---|---|---|---|---|---|
| Year | Submitted | Accepted | % accepted | Submitted | Accepted |
| 2013 | 1701 | 91 | 54% | 2.21 | 2.31 |
| 2014 | 1651 | 103 | 62% | 2.04 | 2.02 |
| 2015 | 1331 | 95 | 52% | 1.92 | 1.91 |
| 2016 | 195 | 96 | 49% | 2.16 | 2.20 |
| 2017 | - | 104 | - | - | 2.39 |
Data may be underestimated for these years. "-" indicates that data are unavailable.
Source: Author's own elaboration.
According to Table 10, women's participation in terms of submissions to ANPEC varies between 24% and 30%. The percentage of women with accepted articles roughly follows the percentage of submissions by women, ranging from 21% to 31%. The differences between the rates of submission and the rates of acceptance are not statistically significant, except for 2014.
Table 10 Proportion of Women Among Submitted and Accepted Articles - ANPEC
| Year | %women's submissions | %women's acceptance | Difference test |
|---|---|---|---|
| 2007 | 23.8% | 21.3% | 0.2896 |
| 2008 | 24.3% | 23.5% | 0.7242 |
| 2009 | 24.7% | 23.2% | 0.4776 |
| 2010 | 27.6% | 24.0% | 0.1558 |
| 2011 | 27.1% | 24.9% | 0.3096 |
| 2012 | 28.0% | 24.5% | 0.1109 |
| 2013 | 26.5% | 24.5% | 03488 |
| 2014 | 27.7% | 23.0% | 0.0273** |
| 2015 | 26.6% | 24.7% | 0.3610 |
| 2016 | 29.5% | 29.6% | 0.9526 |
| 2017 | 27.2% | 24.1% | 0.1415 |
Note: Column 'Difference test' reports the p-values of t-test of mean differences between submission and acceptance rates.
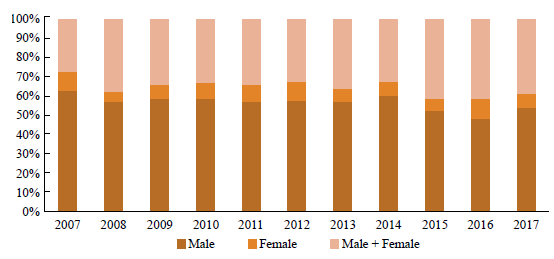
As Figure 5 shows, more than half of the articles accepted at the ANPEC meetings are male-authored only. Articles in which the authors are only women correspond to less than 10% and this pattern is stable over time. The share of accepted articles in which men and women are coauthors far exceeds the fraction of accepted articles whose authorship is solely by women.
Source: Author's own elaboration based on ANPEC data.
Figure 5 Female and Male Authorship Among Accepted Articles - ANPEC
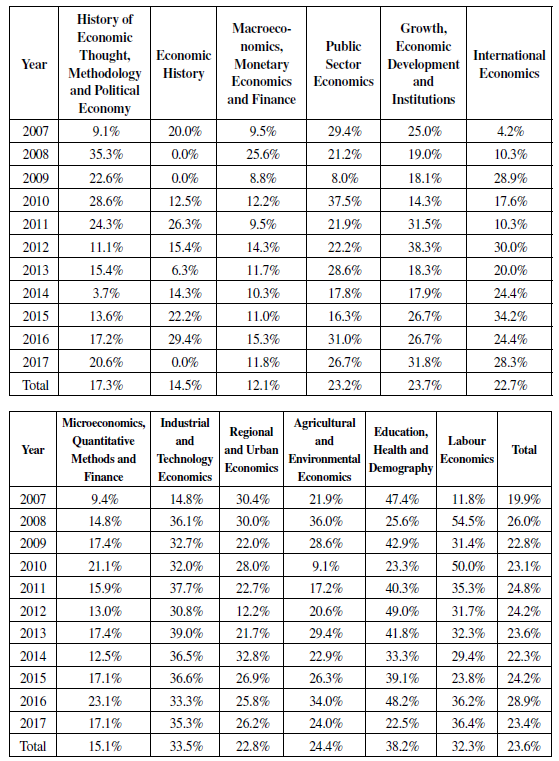
Finally, Table 11 identifies the share of women on the scientific committees of the different subfields of the ANPEC meetings. Throughout the subfields, the fraction of women on scientific committees follows the share of women as authors. This result is somewhat expected, since the selection of the scientific committee reflects the set of active researchers in that area.31 This is also in line with the findings of Abrevaya and Hamermesh (2012) and Card et al. (2020) that there are no differences in how referees of different genders assess papers by female and male authors.
Table 11 Female Participation in the Scientific Committee by Area and Year - ANPEC
Source: Author's own elaboration.
Subsequently, we repeat the analysis for the SBE meetings. Table 12 shows that the percentage of women who submit articles varies between 15% and 19%, very similar to the percentage of women with accepted papers (between 12% and 18%). In either case, these fractions are below those of the ANPEC meetings, reflecting the fact that there are fewer applied microeconomics fields of research and sessions at the SBE meetings. Moreover, such fractions are lower because there are fewer women in top departments in the country where submissions to the SBE event usually come from.
Table 12 Participation of Women Among SBE Authors
| Year | Number of authors who have submitted | Number of women who have submitted | % women's Submissions | Number of authors who have been accepted | Number of women who have been accepted | % women's Acceptance | % accepted women vs. submitted women |
|---|---|---|---|---|---|---|---|
| 2013 | 376 | 55 | 15% | 210 | 26 | 12% | 47% |
| 2014 | 336 | 50 | 15% | 208 | 35 | 17% | 70% |
| 2015 | 352 | 66 | 19% | 181 | 28 | 15% | 42% |
| 2016 | 423 | 72 | 17% | 211 | 37 | 18% | 51% |
| 2017 | -- | -- | -- | 249 | 43 | 17% | -- |
Source: Author's own elaboration.
Figure 6 shows the gender composition of the accepted articles. It is noteworthy that in the meeting that took place in 2013, none of the articles were written solely by a woman. In other years, there are articles solely by women, but the vast majority of the accepted papers are authored exclusively by men.
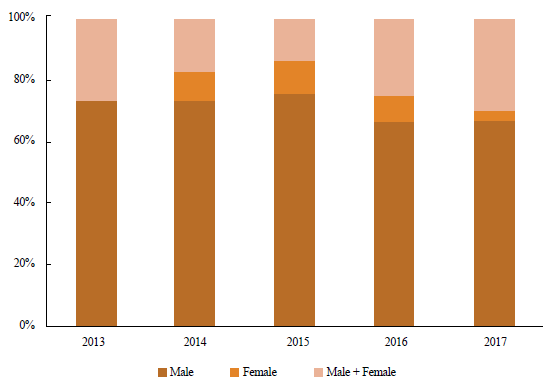
Source: Author's own elaboration based on SBE data.
Figure 6 Female and Male Authorship Among Accepted Articles - SBE
Finally, Table 13 shows that the participation of women in the scientific committee also follows their choice of fields. The SBE scientific committee is typically formed by three or four people. For example, participation of 33% indicates there was one woman on a committee of three people and a participation of 25% indicates there was one woman on a committee of four people. It is notable that the scientific committee of finance has never had a woman as a member.
Table 13 Female Participation on the Scientific Committee by Area and Year - SBE
| Year | Applied Macroeconomics | Applied Microeconomics | Econometrics | Finance | Economic Theory | Average |
|---|---|---|---|---|---|---|
| 2013 | 0% | 0% | 0% | 0% | 0% | 0% |
| 2014 | 0% | 50% | 0% | 0% | 0% | 10% |
| 2015 | 25% | 25% | 0% | 0% | 0% | 10% |
| 2016 | 0% | 25% | 33% | 0% | 0% | 12% |
| 2017 | 20% | 17% | 0% | 0% | 33% | 14% |
| Average | 9% | 23% | 7% | 0% | 7% |
Source: Author's own elaboration.
Women's Field Choice in Economics
In addition to the temporal evaluation, we also examined whether there are differences in the representation of women among sub-areas of economics, exploring the fact that the submissions include a wide range of topics, especially for the ANPEC meetings.
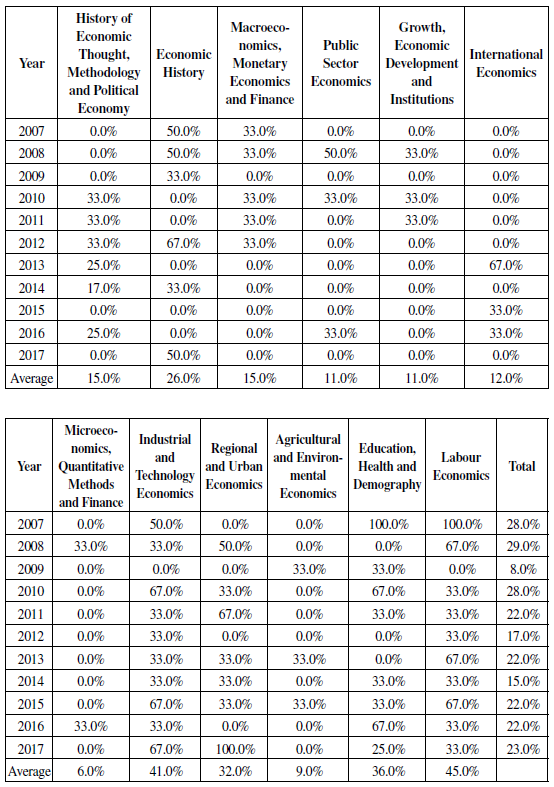
Table 14 shows the female participation by field. The same pattern observed in the NBER Summer Meetings and the Annual Meeting of the AEA is observed for the ANPEC meetings. Throughout the period, social economics and economic demography retain the largest share of articles accepted authored by women. In addition, negative bias towards macroeconomics and finance is also observed. This is certainly the subfield in which the women's share of accepted articles is the lowest, not more than 15% (all years, except in 2008). On the other hand, the share of female authors in social economics and economic demography, does not fall below 22.5% (2017), and reaches almost 50% in 2012.
Table 14 Female Participation in the ANPEC Meetings by Area and Year
Source: Author's own elaboration.
Table 15 again reveals a field bias but now looking at the SBE data. While women submit more articles to the subfield of applied microeconomics, they also have more papers accepted in this area. On the other hand, since their research is less focused on Finance, Econometrics and Economic Theory, there are fewer submissions to these sub-fields, and we observe also low acceptance or participation rates (indeed, female participation is zero in the economic theory sessions of 2014).
Table 15 Female Participation in the SBE Meetings by Area and Year
| Year | Applied Macroeconomics | Applied Microeconomics | Econometrics | Finance | Economic Theory | Total |
|---|---|---|---|---|---|---|
| 2013 | 11% | 19% | 7% | 8% | 10% | 12% |
| 2014 | 14% | 30% | 15% | 9% | 0% | 17% |
| 2015 | 5% | 27% | 5% | 13% | 8% | 15% |
| 2016 | 8% | 29% | 19% | 8% | 17% | 18% |
| 2017 | 15% | 27% | 17% | 5% | 11% | 18% |
Source: Author's own elaboration.
As Lundberg and Stearns (2019) pointed out, "field choice may affect entry into tenure-track positions in economics, publication rates, and the probability of publishing in top journals, all of which may also affect the probability of earning tenure." (p. 7)32 Therefore, the distribution across fields of study is another dimension of women's representation, although only until recently has it started to receive more attention.
The evidence available so far strongly supports a preference bias. Chari and Gold-smith-Pinkham (2017) found gender differences in the distribution across specific fields of research in the NBER Summer Institute Programmes. The share of female authors in finance is only 14.6%, in macro and international economics it is 16.1% and in applied micro it is 26.5%. The acceptance rates of submissions made by men and women to the applied micro and macro international areas are, however, statistically equal. Women who submit papers involving finance, on the other hand, are less likely than men to have an article accepted. Beneito et al. (2018) evaluated the programmes of the annual meetings of the American Economic Association (AEA) and revealed that the share of women's participation practically did not change over time and that there were clearly two "research groups", the first one involving macro, finance and tools, with low female participation, and the second one involving micro and other areas, with a higher presence of women.33 Finally, Lundberg and Stearns (2019) collected information on new Ph.D.s since the early 1990s, including names and the JEL code of their theses, in order to offer a broader perspective of women across fields. They did not find evidence that the distribution of Ph.D.s across fields has evolved in a different way among genders. Women are more likely to write theses on labour and public economics than men. Women are aiso less likely to write theses on macro and finance. However, there are almost no differential trends throughout the entire period. They concluded by calling attention to the fact that bias in the choice of field may persist over time due to role model effects.
This bias of preference also manifests itself in other ways. One is in research, published or not, of which the papers presented at meetings are only a part. Dolado et al. (2012) evaluated the research conducted by 1,900 researchers at the 50 most important departments of economics in 2005 according to Econphd.net. They concluded that women prefer research topics such as wages, gender inequality, education, health and demographics. On the other hand, among their least preferred topics are mathematical economics, fluctuations and economic cycle.34
Much less is known about the reasons for gender distribution across the areas of economic research. Dolado et al. (2012) debated whether the theoretical arguments used to explain wage gaps in competitive occupations, of which academic positions form part, could provide some insight. They soon discarded two of the five possible alternatives. The first is self-selection (Polachek, 1981), according to which the problem would be of supply, given an equal distribution of skills between men and women. Since women know they will have more interruptions in their careers, because they will have children and/or because they will have to take care of their parents and relatives, they end up choosing less competitive jobs. They self-select into these jobs because the penalty for inevitable interruptions is lower. However, it is difficult to believe that this theory can explain differences between areas within the same discipline, although it may be useful to explain choices between different areas (Borden & Brown, 2007). The second possible alternative is demand, but this does not seem promising either, since the choice of an area of research is made following the much more difficult decision to work in research activities in renowned economics departments.
They then presented three more alternatives: i) women are genuinely interested in certain topics (persistence preferences); ii) women avoid subfields that are dominated by men and vice versa (social exclusion); and iii) women are not interested in male-dominated areas to avoid competition (gender differences in competition). They found evidence that the probability of a woman choosing a particular area of research is positively correlated with the share of women already working in that area. This implies path dependence, which they did not attribute to differences in preferences for sub-areas between men and women, but rather to issues of segregation. Specifically, it seems that women tend to avoid male-dominated areas, whereas the opposite does not seem to occur. The share of women in a given area is also explained by the degree of competitiveness in that area, measured by an index defined by the proportion of articles in that area that are published in high-profile academic journals.35 The good news brought to light by their results is that the gender gap is shrinking in some areas, as shown by weaker path dependence among young researchers. At this point, it is clear that in the near future we have two tasks. First, follow the papers submitted to the ANPEC and SBE meetings in order to verify whether or not they are published, where they are published and if there are gender differences in terms of quantity and quality of publications. Second, evaluate the published papers, trying to establish the differences between men and women regarding the network of co-authors and fields of preference.
FINAL REMARKS
In this paper, we present several statistics on female representation in economics in Brazil, based on their career evolution. To do that, we use a novel dataset from the survey collected by the research group Brazilian Women in Economics and also unique data on paper submissions obtained from the main Brazilian economics associations. We complement our analysis using data from the national examination that selects students for graduate programmes (ANPEC exam).
When studying female participation in the career, we observe a "leaky pipeline" in Brazil. There are few female graduate students, they usually do not pursue a career at universities, and if they do, they rarely become full professors. Female participation is even lower at higher quality institutions.
Aggregate Brazilian data show some similarities to developed countries, but our analysis reveals important disparities throughout the departments. First, there are important differences between public and private institutions, as there are more female professors and students in public institutions. Job stability at public institutions can attract more female professors, and having more women teaching can be an important factor in attracting students (either because of role models, or because the environment becomes more amenable to women). Second, our data show that the entrance exam for master's programmes in Brazil (the ANPEC exam) is extremely competitive and the test format does not favour women either, who are generally more averse to risk. This gateway to academic careers can also be an important reason for women's leaky career pipeline.
Looking at the data on the main Brazilian economics conferences, we also find a field bias, where the subfields of education, health and demography stand out as preferred by women and the subfields of macroeconomics, finance and economic theory stand out as not preferred by them. The same bias is observed in other countries.
It remains an open question which characteristics of the applied microeconomics field make it more attractive to women economists. Potential explanations suggested by the literature could be statistical discrimination against women in fields with low female participation (Altonji & Blank, 1999) or differences in preferences due to the fact that women are on average less competitive and more averse to risk (Bertrand, 2011; Croson & Gneezy, 2009). Goldin (2013) also speculated that the way economics is taught may encourage or discourage women to become economics majors in the U.S. In the future, it would be interesting to model the likelihood of an individual choosing a certain area, following Dolado et al. (2012)'s work, by evaluating in particular the roles played by the share of women in each field and the degree of competition against men.
This is the first study on this subject in Brazil, and it aims to provide an understanding of the persistent gender gap in promotion and other aspects of the academic career in economics. Moreover, it argues that it is particularly important to conduct research to understand the earlier stages in the pipeline, including gender differences in undergraduate courses or before.36