English (pdf)
 Article in xml format
 Article references
 Send this article by e-mail
 Cited by SciELO
  Cited by Google
  Similars in
SciELO
Similars in
SciELO  Similars in Google
 Permalink
INTRODUCTION
In order to prevent the spread of COVID-19, the Colombian government has been adopting a number of sanitary measures. After declaring the pandemic a national sanitary emergency on March 12,1 the Ministry of Health and Social Protection ordered mandatory preventive isolation for people over 70 years old.2 Subsequently, on March 22, the President announced the compulsory confinement of the entire population from March 25 to April 13.3 This excluded essential economic sectors such a health, production of basic necessities, financial and banking services, assistance and care of children and older adults, pharmaceutical production, cleaning, disinfection and personal care products and public services and telecommunications.
At the end of April, the confinement was extended to May 11, including exemptions for specific sectors as long as they met certain sanitary protocols.4 For example, construction and several basic manufacturing activities were reactivated. Then, on May 6, the national government again extended the confinement period until May 25,5 at the same time authorizing the reopening of COVID-19 free municipalities as long as they met proper biosecurity protocols.
An increasing number of studies have estimated the economic costs of confinement measures all over the world. The World Bank (2020) foresees a drop in the growth of the Colombian GDP of around 2%, while the OCDE (2020) estimates an initial impact of the paralysis of 23% of the GDP. CEDE (2020) attests that about nine million people's income depends on activities which are vulnerable to isolation measures and estimates that their closure will cost at least 10% of the GDP per month. Moreover, Mejia (2020) finds that in a scenario were isolation measures lead to a reduction of between 37% and 49% of sectoral operations, the economic cost would range between COP $48 and COP $65 Trillion (4.5% to 6.1% of GDP) per month.
Bonet et al. (2020) provide a closer look at the regional impact of lockdown measures, finding that the confinement of 60% of total workers is equivalent to approximately 13.3 million workers in isolation, of which approximately 70% are informal. Following the latter scenario of confinement, the authors also find that economic losses amount to COP $59 Trillion or 6.1% of the national GDP. As expected, these effects are not homogeneous throughout different regions and depend, among other factors, on the degree of exposition of the local economies to the isolation measures. For instance, the authors find that the most vulnerable regions are Antioquia, Boyacá, San Andrés, Santander and Valle, which are highly dependent on service activities affected by the confinement.
Since the understanding of these regional differences is essential for the adoption of public policies, the objective of this paper is to compute and analyse the main regional heterogeneities observed in the economic impact of lockdown measures. To do so, we use a multisectoral and multiregional input-output model that allows us to partially extract workers from the different sectors of the economy and compute economic losses at the regional level.
Our results evidence differences in three dimensions: the labour market, the local economies and sectoral impacts. Regarding the first, we find that the peripheral regions (Amazonia, Caribbean, Pacific, and Eastern plains and Orinoquia) concentrate a higher number of informal workers in isolation than the interior regions (Coffee area and Antioquia, and Central). These economic losses range between 5.4% of the GDP in the Amazonian region to 6.3% in the Coffee area and Antioquia. Moreover, we find that while the largest losses in the Coffee area and Antioquia, Central, Caribbean, and Pacific regions are concentrated in service activities, in Amazonia, and the Eastern plains and Orinoquia, the most affected sectors belong to agriculture and mining.
Another relevant issue, recently analysed in the literature, is related to the tradeoff between health and the economy as the result of the lockdowns to prevent the contagion of COVID-19. In general, the literature has found a compensatory effect between the economic costs and losses due to the lockdowns and the reduction in the mortality rate during the pandemic. In a multi-country analysis, Kochaiiczyk and Lipniacki (2021) found that delays in initiating quarantine periods increase the number of infections and deaths. Another example is for the particular case of Ohio in the United States, where Mallow (2020) estimated the potential years of life lost and the economic value of that loss, from which it is possible to evaluate the risk-compensation resulting from lockdown measures taken in that particular state. Another related research was carried out by Aum, et al. (2021), who compared the intensive testing strategy in South Korea and the quarantine approach in the United Kingdom. The results indicate that the former strategy would have worked equally well in the United Kingdom as in South Korea, reducing contagion and deaths and even preventing a decrease in the GDP.
This paper is organized as follows. The second section presents the input-output methodology used to compute the regional economic impact of the lockdown measures. The third section briefly characterises the regional economies and their labour markets. The fourth section presents the results of the sectoral and regional economic impact resulting from the lockdown measures. The final section presents our conclusions.
METHODOLOGY6
Following Haddad et al. (2019) and Bonet et al. (2020), we use an input-output flow table considering fifty-four sectors, where we split up the workers into q age groups, and identify payments to wage earners for each group (Table 1).
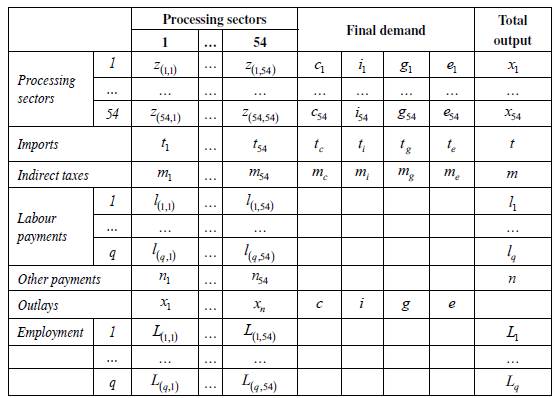
Where:
z ij , with i, j = 1,..., « the interindustry sales of sector i to sector j.
t i and m; (z = 1,..., w, c, i, g, e), are the indirect tax payments, and imports, respectively.
l ij and L ij (i=1,…,q and j=1,…,n) are the payments by sector for labour services, and total number of workers, respectively.
n j (j = 1,…, n) are the payments by sector for all other value-added items.
c i , i i , g i , and e i (i=1,…,n) are the components of final demand, f for household purchases, investment purchases, government purchases, and exports, respectively.
x i (i=1,…,n) is the total sectoral output.
We assume that lockdown measures restrict part of the labour force which, in the case of the COVID-19 pandemic, are both age and sector-specific.7 We define qxn factors, F q,n , 0 < F q,n < 1, defining the share of non-restricted workers in each group and each sector. Therefore, we set the factor to unity in sectors without restrictions, and to zero for those where there are reasons to believe their economic activities are fully restricted.
The next step is to apply each factor F
q,n
to its corresponding element in both matrices, employment and labour payments. In the former, we define the number of workers facing lockdowns while in the latter we compute, for each sector, the contribution of those workers to the total labour income. With the aggregate income associated with both restricted and non-restricted workers, we use its share in total labour payments by sector together with the sectorial labour payment coefficients,
 . Then, we define a new set of penalty factors specific for each sector, F
n
, 0 < F
n
<1, which identify the share of the output in each sector connected with non-restricted workers.
. Then, we define a new set of penalty factors specific for each sector, F
n
, 0 < F
n
<1, which identify the share of the output in each sector connected with non-restricted workers.
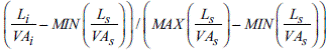
This strategy permits carrying out different scenarios based on goals for compliance to the measures. For example, if we would like to investigate a case that is both consistent with the set of pre-defined factors, F q,n , and a desirable level of compliance, α,8 we can find an adjustment weight (ω) to be applied across all F q,n :
After computing the factors, F n , we use all the information to partially extract particular sectorial flows in the input-output flow, taking into account both demand and supply reductions.
For the interindustry demand_ we consider that ∀z ij ,i, j=1,…,n we calculate a corresponding restricted flow, z ij :

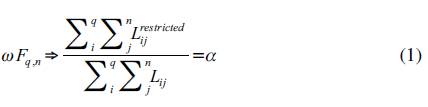
One of the advantages of this approach is that, apart from the supply-side restrictions (those associated to F i ), it is also possible to include demand-side restrictions. For each final demand user, a demand-side factor, F u , u = c,i,g,e, can also be defined. Each F u is specified as follows: F c is computed according to changes in prede termined earnings by isolated workers. On the other hand, we are assuming that informal workers affected by the isolation face a complete loss of income, while formal workers face only a partial loss, according to a parameter δ, 0 <δ <1.Accordingly, we also assume that changes in labour income are transferred to household demand changes.9
Considering that investment decisions taking place and government expenditures are unaffected (on the demand-side) in the short run, F i and F g are set to unity. This allows us to use government reactions for simulating policy scenarios and computing alternative values for F g . On the other hand, F e is set to 0.75.10 Also, in the median economy, exports would decline by 25%.
Then, we apply a rule with each component of the final demand (fiu), where ∀f iu , u = i, g, e we compute the restricted flow f iu :
When considering household demand, we can apply the supply and demand constraints: ∀f
iu
= c the restricted flow,
 , is computed as
 . Based on the original and modified sectoral flows, we now have two matrices and two vectors: interindustry flows matrices Z and
 , and the final demand vectors, f and
 , from which we can also derive the corresponding matrices of technical coefficients, A and
 , for a given vector of sectoral output x.
The next step is to apply the extraction method (the extraction of particular sectors from the input-output matrix), with the purpose of identifying the changes in the amount of output when several sectors are removed from the economy, and hence the relative importance of a sector in this economy.11
Haddad et al. (2020) developed a variant of the extraction method in the sense that they do not fully extract sectors, but only a part of them according to the combined information given by
 and
and
 .
.
With the complete sector flows the output is given by x = (I - A)
-1
f. If
 corresponds to the restricted intersectoral trade flows and
 to the corresponding final demand, the lockdown-related output of the economy is given by
 . Consequently, the result of the partial extraction is given by
 , with T being the measure of annual loss in the economy. Also, as always, pre-multiply-ing the vector of gross output (x or
 ) by the matrix (
 ), whose main diagonal is the variables' coefficient we are able to translate sectoral gross output outcomes into the outcomes of other variables. Daily predetermined losses can be computed dividing T or VT by the weekdays.
AN INITIAL VIEW OF THE PRE-LOCKDOWN REGIONAL ECONOMIES
In order to understand the potential effects of lockdown measures, it is essential to identify the main economic activities and the composition of the labour force in each region.12 To do so, we use the sectoral composition of economic activities and the labour market information as reported by the National Statistics Department (DANE for its acronym in Spanish) in 2015. Despite variations in the aggregated data, sectoral composition of employment and production of regional economies have remained relatively stable over the last few years.
Regarding economic structure, services stand out as the activity with highest participation in value added in all regions. In the majority of cases, the participation of the service sector is close to 70%, only for the Eastern plains and Orinoquia these activities represent a lower proportion, 45% of the total added value.
The distribution of the remaining sectors follows a similar pattern in the Coffee area and Antioquia, Central, Pacific, and Caribbean regions. In these territories, manufacturing represents between 8.4% and 13.4% of total production, and agriculture between 7.2% and 12.7%. Mining is the only sector with any significant variation throughout these regions with contributions that range from 1.1% in the Coffee area and Antioquia, to 10.6% in the Caribbean. The case of Amazonia is particular, since it has a manufacturing sector with low participation (1.7%). Regarding the Eastern plains and Orinoquia, the lower participation of services (45%) is compensated with a higher mining and agriculture contribution that accounts for 36% and 17% of total value added, respectively.
Regarding the sectoral distribution of workers for the six regions and the national aggregate, at first glance, and making a comparison with the distribution of economic activity, the Coffee area and Antioquia, Central, Caribbean, and Pacific regions, have a services sector with lower employment participation than value added. Conversely, the remaining regions have a higher participation of labour services than in economic production. This is particularly evident for the Eastern plains and Orinoquia region, where services contribute up to 45% of the total added value and workers in this sector represent 83% of the total in the region.
A second pattern, common to all regions, is related to mining and agriculture activities. While the former has a participation high in value added and low in employment, agriculture contributes more to workers than to economic production. These results support the hypothesis of significant regional disparities, both inter and intra-regional, which has been previously documented in the literature (Bonet & Meisel, 2001; Galvis & Meisel, 2010). The next step is to analyse intra-regional differences, specifically the share of each sector on the total value added and workers.
Starting with the Caribbean region, San Andrés stands out as a department where nearly all the value added (97.2%) and workforce (93%) is related to the services sector. This island is highly dependent on tourism related activities such as accommodation and food services. Although less so than San Andrés, the other departments in the region also have a high contribution of services to value added and employment. Also, agriculture and livestock comprise an important proportion of labour in this region.
Regarding the Pacific, we can identify two departments that are far removed from the general pattern observed in this region. This is the case of Chocó, where services have a low participation in value added compared to its neighbouring departments (56.1% compared with the regional average of 72.1%). In this department, mining has the second highest participation in value added, 26.3%, compared with a regional average of 2.5%. In terms of employment, mining provides the highest contribution, 12.9% in contrast with 2.5% for its neighbours. Furthermore, the department of Valle del Cauca, the richest department in the region and one of the richest in the country, has a services sector with a high participation of workers relative to the participation observed in its neighbours (75.8% compared with a regional average of 44.7%).
In the Central region, the case of Bogotá, the capital city, is particular due to its high participation of services in the total value added (89.2%). A similar pattern is observed for employment in this sector that has a participation of 83.9%, well above the regional average of 58.3%. It is worth mentioning that the capital city does not have the highest participation of manufacturing activities (10.6%); the first place is occupied by Cundinamarca (24.8%). Nevertheless, Bogotá occupies the first place in employment contribution of the manufacturing sector (15.4%).
For the Coffee area and Antioquia region, we do not observe significant differences in the sectoral composition of value added. Services activities have a similar participation in the four departments making up this area and most of them coincide in that the second most important sector is manufacturing. The only difference is observed in Quindío, where the second most important sector is agriculture and livestock activities, with a participation in the total added value of 15.5%.
In the Amazonia region there are two departments that differ from the observed regional pattern: Putumayo due to its economic structure and Caquetá because of its occupational composition. In the former case, services participate with 52.9% of the total added value, while for the other five departments this sector contributes an average of 82%. In Putumayo, the second most important economic activity is mining (40.6%), driven by oil extraction, while for the other departments in the region agriculture and livestock are the main activities. Regarding Caqueta, this department stands out in the region for having the lowest workforce participation in services activities (51.9%) in comparison to its neighbours (88.1%).
Finally, in the Eastern plains and Orinoquia region, Vichada stands out with a services sector which has a relatively high participation in the total value added (65.3%). A second characteristic of this department is that, while the second most important economic activity in Arauca, Casanare and Meta is mining (38,5%, 49,4% and 55,5%, respectively), in Vichada agriculture is the most important sector. In terms of employment, Meta stands out for having the services sector with the lowest participation (67.9%) and a higher participation of agriculture (25.2%). The other departments have employment concentrated in the services sector.
This intra and inter-regional economic and labour market view, reveals important patterns that will allow us to have a better understanding of the regional and sectoral circumstances for a period before the COVID-19 pandemic and, thus a better understanding of the consequences derived from the preventive isolation measures presented in the following section.
RESULTS
Following the approach described in Section 2, we now present the results of the regional economic impact of isolation measures adopted to prevent the spread of the COVID-19 pandemic. In particular, we build from the aggregated economic effects found in Bonet et al. (2020) following a scenario where 60% of the total workers are in isolation. We present the disaggregation of economic losses by regions, departments and economic sectors. The First sub-section shows the adjustment factors defined by Bonet et al. (2020) to capture the degree of exposition of each sector to isolation measures. The second subsection presents the regional dis-aggregation of workers in isolation, and the Final sub-section notes the regional and sectoral economic impacts.
Adjustment Factor F
Primarily, in order for the input-output approach to be applied, we need to define a set of adjustment factors which reveal the extent to which the confinement measures are restraining each economic sector's operation. Following Bonet et al. (2020), and based on the list of economic activities excluded from preventive isolation, Table 2 shows the F factor defined for each sector. Consistent with Mejia (2020) and CEDE (2020), we observe that the sectors with the highest restrictions are those related to non-essential activities, such as the arts, entertainment and recreation, with an F factor of 0.1, while essential activities such as health and public administration face no such restrictions and consequently have an F factor equal to 1.0. In particular, an F factor between 0 and 1 is defined for each sector depending on the exposition of each sector to isolation measures adopted by the government.

Workers in Isolation
Following the ordering deined by the F factor, we extract a group of workers uniformly across all regions until reaching 60% of them in isolation. Table 3 shows, by department, the percentage of workers in isolation under this particular scenario. It is worth mentioning that among the group in isolation we include all workers over 70 years old regardless of the sector they belong to. The percentage of workers in isolation ranges from 57.8% in the Amazonia to 61% in the Caribbean Region. In the latter, San Andres Island stands out with 64.6% of total employees in isolation.
Table 3 Workers in Isolation by Region. Percentage of Total Workers

Source: Authors' own calculations.
It is also important to highlight the differences in the distribution of formal and informal workers. Even though at the national level 70.1% of confined workers are informal,13 peripheral regions (Caribbean, Pacific and Amazonia) show a higher participation of informal workers than in the interior regions. Amazonia, although having the lowest percentage of workers in isolation, shows the highest participation of informal workers (87.7%), followed by the Caribbean and Pacific regions with 81.7% and 76.3%, respectively. This proportion is lower than the one observed in the Central and Coffee area and Antioquia regions, where informal workers represent 65.2% and 60.1%, respectively. This is consistent with a predominantly informal economy in peripheral regions and reveals the greater socioeconomic vulnerability of the isolated population in these territories.
Economic Impact
Following the scenario with an isolation of 60% of total workers, Bonet et al. (2020) identify monthly economic losses that amount to COP $59 trillion, which represent 6.1% of the national GDP. As expected, the regional distribution of this loss is not homogeneous across the territory and depends on each region's share in the total national production. Similarly, sectors with the highest losses in each region are those contributing the most to local economic production. Nevertheless, when considering each sector's loss relative to its contribution to the local GDP, the most vulnerable activities appear to be those with the strongest restrictions to isolation measures or those that are highly dependent on restricted sectors. This section presents a detailed regional and sectoral description of the economic impact of lockdown measures in Colombia, assuming a scenario where 60% of total workers are in isolation.
First of all, the regional distribution of the aggregated economic impact reveals a high concentration of losses in the Central region with a share of 45.7% of total economic losses. This is followed by the Coffee area and Antioquia region (18.9%), Caribbean (14.6%), Pacific (13.9%), Eastern plains and Orinoquia (5.8%) and, Amazonia (1%). As mentioned before, this result is closely related to each region's share in the national value added.
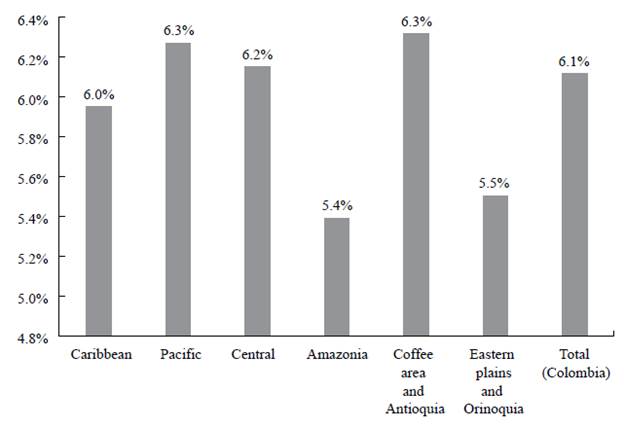
Incorporating the regional differences in economic production in the analysis, Figure 1 shows regional losses as a proportion of the local GDP. The Coffee area and Antioquia region ranks first with a total loss of 6.32% of its GDP, higher than the national aggregate loss of 6.1%. At the other end is Amazonia with a total loss of 5.4% of its GDP.
The relative economic impact on each region is determined by the percentage of its workers in isolation and the labour income they represent. Following the model's assumption that the workers' remuneration is proportional to their participation in total value added, this is indicative of the contribution of workers to the sectoral economic production. While in the Coffee area and Antioquia the percentage of workers in isolation is 60.3% and their labour income represents 53.1% of the total, in Amazonia these figures are 57.8% and 40.3%, respectively. Results follow the same pattern when we consider individual departments and their corresponding sectors. To support this argument, we present the disaggregated results for two regions: The Coffee area and Antioquia (ranking first) and Amazonia (ranking last).
Coffee Area and Antioquia Region
In this region, the department with the highest loss (as a percentage of the local GDP) is Antioquia with 6.4%, while on the other side is Caldas with a 6.1% loss. Consistent with these results, the percentage of labour income restricted in Antioquia is 54%, the highest in the whole region, while in Caldas the income of workers in isolation represents 49% of the total income (Appendix Table A1).
The case of Antioquia and its role as an input supplier to all the country's regions is worth mentioning. Despite low regional interdependence in Colombia (Bonet, 2006), Antioquia ranks third in terms of forward linkages after Bogotá and Santander (Hahn, 2016). This means that its production plays a considerable role in the operation of multiple economic sectors across the country, and as a consequence, it can be affected by a lower demand in other territories. In particular, the most affected sectors in Antioquia are: administrative and professional services that represent 12.2% of total losses, followed by real estate activities (11.4%), wholesale and retail trade (9.9%), construction (9.5%) and accommodation and food services (4.4%). These activities, apart from being highly affected by confinement measures, have an important participation in the total economic production of this department, 39.8% as a whole. Regarding the other departments in the region, Caldas and Risaralda follow a similar sectoral distribution of economic losses, while Quindío shows an important contribution of agriculture to the total losses, consistent with its participation in the value added of this territory.
In line with these results, a vulnerability index is computed to compare each sector's participation in the total loss and each sector's participation in the department's total value added.14 In particular, this index is constructed as the quotient of these two indicators, which is then rescaled between 0 and 1 which indicate low and high vulnerability respectively. These results show that the most vulnerable sectors in the region are: other mining and quarrying, manufacturing of other non-metallic mineral products, mining of metal ores, the arts, entertainment and recreation, activities of households as employers, and accommodation and food services. These activities are the ones that face the highest isolation restrictions in the region. For instance, the first three mentioned sectors have a percentage of workers in isolation of approximately 71%, while for the last two, this reaches 94%. Despite showing fewer isolation restrictions, economic losses of the first three sectors are aggravated by their productive linkages with other restricted activities. In particular, due to their role as input suppliers to other sectors such as construction.
Amazonia Region
The second case study is the region ranking last in economic losses. Results show that losses range between 5.5% (Putumayo) and 5.0% of the GDP (Guainia). Consistent with these low relative losses, the percentage of workers in isolation in this region is between 46.8% (Vaupés) and 58.6% (Caqueta). Regarding sectoral losses, the extraction of crude oil and natural gas stands out in Putumayo, where it represents 41.8% of the total economic impact, almost double than any other loss observed in the region. Other sectors showing a high relative importance in regional losses are accommodation and food services, construction, and wholesale and retail trade.
In terms of vulnerability, the extraction of other mining and quarrying activities appears as highly vulnerable throughout all the departments in the region. The only exception is Guainia where manufacturing of other non-metallic mineral products ranks first as the most vulnerable sector. Other vulnerable activities, consistent with previous results, are accommodation and food services and the arts, entertainment and recreation. In the Amazonia region, although the highest vulnerability is related to primary sector activities such as mining, there is also an important impact on more labour-intensive activities. The results show that approximately 94% of the total workers in activities related to accommodation and food services, the arts, entertainment and recreation, and activities of household as employers, were in isolation. Moreover, the sectors of construction, real estate and professional, scientific and technical activities had approximately 85% of their total workers in isolation.
CONCLUSIONS
Results in this paper are consistent with previous literature that documents regional economic disparities in Colombia (Bonet & Meisel, 2001; Galvis & Meisel, 2010; Galvis et al., 2017) and highlights the importance of adopting public policies that include a spatial component. This is of particular interest in the current circumstances where regions will face different social and economic consequences depending mainly on their economic structure, the degree of informality of their labour force, and the productive linkages of their sectors. For example, peripheral regions such as the Caribbean, Pacific and Amazonia have a higher percentage of workers in informality relative to the interior regions, which implies a higher vulnerability of workers in isolation that may increase regional disparities.
In this paper we find intra and inter-regional disparities on the economic impact of lockdown measures. Regarding the labour market, we find that while the peripheral regions of the Amazonia, Caribbean, Pacific, Eastern plains and Orinoquia have a participation of informal workers in the group of employees in isolation of between 76.3% and 81.7%, in the interior regions of the Coffee area and Antioquia and the Central regions, this percentage is 60.1% and 65.2%, respectively. This makes clear the higher vulnerability of isolated workers from peripheral regions that could stop receiving revenues as a consequence of the lockdown measures.
A second source of regional disparities is the distribution of economic losses. Although economic losses are concentrated in the wealthiest economies (Bogotá, Antioquia, Valle and Santander), relative to their GDP, losses fluctuate between 5.4% in Amazonia and 6.3% in the Coffee area and Antioquia. Moreover, the departments of San Andrés, Antioquia, Valle and Santander stand out with losses of around 6.4% of their GDP, while Meta and Putumayo receive the lowest impacts of 5.6% and 5.5%, respectively.
Regarding sectoral economic impacts, in the Coffee area and Antioquia, Central, Caribbean, and Pacific, the highest losses are in services, where administrative, professional and technical activities, construction, real estate, wholesale and retail trade, and food and accommodation services are the most affected. On the other hand, primary activities such as mining and agriculture suffer the highest losses in the Amazonia and Eastern plains and Orinoquia regions.
The case of several departments that follow particular patterns is worth mentioning: (1) Choco, a department where the mining of metal ores represents 35.1% of the loss; (2) Cesar and La Guajira, two departments of the Caribbean region with a high participation of coal and lignite extraction in the total loss, 33.7% and 43%, respectively; (3) San Andrés, where 37.2% of its total loss is in the accommodation and food services sectors; (4) Arauca and Casanare and Putumayo with significant impacts in the extraction of crude oil and natural gas, with a participation between 31% and 41.8% of the total loss; and (5) Guaviare and Vichada where losses in agriculture represent 20.9% and 21.5% of the total loss, respectively.
Furthermore, the economic sectors showing the highest vulnerability to lockdown measures are the same throughout all regions. These are accommodation and food services, activities of households as employers, the arts, entertainment and recreation, manufacturing of other non-metallic mineral products, and the extraction of mining and quarrying. All these sectors have in common a high percentage of workers in isolation.
In terms of policy implications, this study highlights the importance of the coverage of social protection programs as an effective measure to mitigate the lock-downs during the pandemic. The already existent initiatives such as "Familias en Acción", "Jóvenes en Acción" and "Colombia Mayor" were the main channels from which the government was able to deliver money to focused population. Also, with a quick data collection the government was also able to identify the poorest and the most affected population, and implemented the program called "Ingreso Solidario". The second policy implication has to do with the importance of the government being able to strengthen the fiscal capacity to cover most of the increasing social expenditure. Developing and implementing long-term savings strategies is essential as countercyclical policies in order to reduce the impact of a crisis such as COVID-19. Indeed, the emergency mitigation fund (FOME for its Spanish abbreviation) was created from the savings of the subnational governments: (1) pension funds (Fonpet for its Spanish abbreviation); and (2) the savings and stabilization fund from royalties (FAE for its Spanish abbreviation).
Finally, it is important to mention that these calculations do not account for the increases in public spending or direct subsidies that the national government has implemented to reduce the effects of the crisis. According to the Ministry of Finance and Public Credit in Colombia, additional health expenses comprise 0,8% of the national GDP, transfers to vulnerable populations represent 0,9%, and other measures to protect employment rise to 0,8% of the GDP (MHCP, 2020). Altogether, government expenditures in the year 2020 accounted for 2,5% of the total national GDP, which is small compared to the monthly impact of 6,1% of the GDP noted in our estimations.