


 Inglés (pdf)
 Articulo en XML
 Referencias del artículo
 Enviar articulo por email
 Citado por SciELO
  Citado por Google
  Similares en
SciELO
Similares en
SciELO  Similares en Google
 Permalink
INTRODUCTION
This article seeks to measure the degree of agglomeration of educational quality in the city of Cali, Colombia, in order to determine its correlation with the phenomenon of academic segregation: the non-socialization (or non-mixture) between populations with low levels of educational achievement and their higher-performing peers. In this study, the educational quality of schools is measured using student scores achieved in SABER11 tests, the most important tests for secondary school students, administered by the Colombian Institute for Educational Assessment and Evaluation (ICFES, for its initials in Spanish).
Academic segregation is the term used by the Organisation for Economic Cooperation and Development (OECD) to designate the segregation of students by their level of school competencies. There are four different types of academic segregation. The first involves separating students into different groups by academic ability at an early age, with the result that they follow different academic tracks (early tracking). The second form of academic segregation results from the distinction between educational centres, based on the average skill levels of their students. The third modality derives from the ways educational centres group their students and the existence of options or sections reserved for the best students within a given centre. The final form of academic segregation occurs between state and private centres, as a result of the so-called right to freedom to choose educational centres (Rubia, 2013).
For its part, agglomeration of educational quality refers to the concentration of high quality educational institutions in a given space, a factor that creates a niche effect.
To analyse the relation between the agglomeration of educational quality and academic performance we use the most important ICFES tests, administered by each school in the city of Cali. The research focuses on Year 11 students. We examine their mathematics and critical reading skills using the results of the SABERll tests for 2018, employing to the methodology proposed by ICFES (2016) for the purpose.
The quality of the education system is measured to determine the extent to which the goals and objectives defined for the teaching and learning processes have been achieved. Measurement using standardised tests or evaluations is a fundamental tool for obtaining the reliable information required to improve the education system. Based on these evaluations, it is possible to identify both the strengths and weaknesses of the system and to provide feedback for educational institutions and local authorities (Ministerio de Educación Nacional, Colombia, 2006).
Since 1968 Colombia has been applying what is currently known as the SABER tests to evaluate its education system, and participates in different international evaluations of school performance, which are applied at different educational levels and evaluate different competencies. The results of the tests have been used in various studies that have utilised multiple methodologies to identify factors associated with academic performance (Ayala et al., 2011; Castro et al., 2018; Sánchez, 2011), education gap estimates (Cárcamo & Mola, 2012; Castro et al., 2017), and efficiency studies (OECD, 2016).
The main objective of this research is to explain how the process of agglomeration of educational quality has generated academic segregation, by georeferencing educational quality in schools in Cali in 2018. First, we use classical and Bayesian methods to evaluate the different methodologies available for aggregating SABER11 test averages at school level. Next, we determine the degree of concentration of educational quality in Cali, using Kernel density estimation maps that illustrate the spatial distribution and patterns of the scores. Finally, the principal factors associated with the phenomenon of academic segregation are identified using econometric models to interpret point patterns.
Given the above, this article seeks to answer the following principal research question: What degree of agglomeration of educational quality existed in Cali in 2018? More specifically, how concentrated is educational quality in Cali? In particular, the authors seek to answer the following questions: What is the relationship between educational agglomeration and academic segregation in Cali?; what socioeconomic aspects are significant in explaining academic segregation? and, how is educational quality distributed in Cali?
The research problem is of interest because the results obtained in previous studies focus on the effectiveness or determinants of school performance, while ignoring a feature that has barely been addressed by studies of educational quality in Cali, namely the spatial location of schools. This aspect is associated with educational quality and might contribute to the creation of educational clusters (see Vélez, 2009). Likewise, there is a scarcity of research that explores whether educational agglomeration is a cause of academic segregation.
THE STATE OF THE ART
Research into education has increased since the second half of the 20th Century, and different links have been found between the personal characteristics of students, family and school factors, socioeconomic context and academic performance. Accordingly, this section provides a review of academic articles that have examined the issue at national (Colombian) and international level.
The literature review focuses on the economics of education and spatial relationships, with an emphasis on the concepts of educational agglomeration and segregation.
From an economic point of view, the notion of agglomeration is linked to three concepts: 1) economies of scale, 2) the size of the local market, and 3) transportation costs (Fujita et al., 1999). It is important to mention that in the case of services such as education positive externalities have a fundamental effect on the quality of life of the population. Thus, economic approaches must take spatiality into account in order to avoid educational segregation; this is a topic that is addressed later on in the article.
Sabatini (2006) highlights three degrees of concentration: 1) the spatial concentration of social groups, 2) the social homogeneity found within different areas found in the cities including their ghetto areas, and 3) the social prestige (discredit) of neighbourhoods, associated with stigma. A study prepared by the Bogotá Dirección de Estratificación de Bogotá y Departamento de Estadística Universidad Nacional (2016), analyses three relevant aspects: socioeconomic and spatial dimensions and the characteristics of the agglomeration.
Kaztman (2011) states that children usually study close to their places of residence, and that the geographical location of their households is associated with situations that affect school performance. Accordingly, Vivas (2007) and Duarte et al. (2012) argue that students with lower socioeconomic status tend to be dis-advantaged because of educational segregation, as they attend schools of lower educational quality. Seen from another angle, in a comparative analysis of Rio de Janeiro and Bogotá, Rubiano (2017) suggests that more egalitarian educational centres would contribute to creating societies where it would be easier for individuals to recognise the other and, therefore, to develop more peaceful and harmonious social scenarios.
Kaztman (2010), considers it important to distinguish between the concepts of segmentation and segregation, the former referring to differences in opportunities and reduced chances to interact with others, while the latter also includes a willingness to establish barriers that tend to exclude other groups or social categories. Kaztman argues that in Latin America it is more appropriate to speak of school segmentation than segregation. This article expands on this view.
Iregui et al. (2007) analyse the academic performance of students using a production function of the education system alongside stochastic frontier techniques. They conclude that the variables associated with school infrastructure and with the socio-economic environment of students have a positive and significant impact on academic performance. The results also suggest that private schools benefit from more favourable surroundings, given that, on average, they serve students with higher incomes. However, when equivalent contexts are assumed, they find no major differences in efficiency between state and private schools.
For their part, Jola (2011) seeks evidence of the determinants of education quality in Colombia by analysing the results of the OECD's 2006 PISA test. Employing an econometric analysis, they find that the physical resources of the campus, the curriculum or academic content and the competence of the teachers are positive determinants of test results. Similarly, the analysis reveals that a greater abundance of educational resources at home and the dedication and interest of individual students in science and mathematics are associated with higher performance.
In 1999 Aguerre (2002) conducted a study in Argentina and Uruguay, on the structure of social and institutional determinants of the performance of students in the sixth year of primary education. The results suggest that the strongest determinants of educational inequality are related to the theory of cultural reproduction, according to which education is a means by which existing unequal social relations are reproduced. He concludes, moreover, that the socio-cultural composition of schools has a greater marginal effect on academic performance than individual capital variables.
Murillo and Martínez (2017) find, for Colombia, that socio-economic, ethnic-cultural and immigrant/native school segregation is high in comparison with the rest of Latin America. They calculated the dissimilarity index, finding that segregation in Colombia is at 0.59 (high segregation is defined as between 0.5 and 0.6 in the study). Furthermore, using the 2015 PISA tests, Vazquez (2018) shows that Colombia is among the countries with the highest levels of school segregation in the world, alongside five other countries in the Latin American region (Argentina, Chile, Costa Rica, Mexico and Peru). The authors conclude that more studies should be carried out on the subject in the Latin American region.
At the municipal level, Correa (2011) uses econometric methods to analyse the educational achievement of Year 11 students in Cali. He finds that the gap in academic performance between students is due to factors that are specific both to schools and students.
It should be noted that studies have tried to demonstrate the relation between agglomeration and segregation and school performance and engagement with educational services and their effect on the quality of life. However, the spatial relation of agglomeration and segregation by area has not been examined, let alone at the level of microeconomic units such as schools in Cali. For this reason, this study is novel in using such information and in the spatial treatment applied to it. The objectives, data, and methods used to redress this situation are described below.
METHODOLOGY
This study uses cross-sectional data for the year 2018. It focuses on the city of Cali in Colombia. It is exploratory, descriptive, explanatory and correlational. The main hypothesis is that the educational quality of schools in the city is affected by spatial agglomeration. It is suggested that contextual socioeconomic factors associated with educational quality - such as the presence of homicides and thefts in the neighbourhood in which schools are located, the spatial location of the school, and the characteristics of students and their families - should be used as influencing variables.
We began by calculating the average scores in mathematics and critical reading of Year 11 students who attended schools in Cali in 2018, using the methodology proposed by ICFES (ICFES, 2016).
Subsequently, we aggregated students' scores for each school in Cali using Lajaunie's (1991) empirical Bayesian estimation. Inputs included information on individual student and family characteristics and school traits, extracted from the two ICFES databases for the year. We also included contextual variables for the schools, such as the number of homicides and thefts occurring within a 500 metre buffer zone around the institution.
This made it possible, on the one hand, to identify whether the agglomeration of educational quality generates academic segregation and, on the other, to establish the main determinants of the phenomenon. Once the school level information had been added, it was included in the cartography for each school using Geographic Information Systems (GIS) and R statistical software and the raster, rgdal, and sp packages.
Finally, we used methods such as K-replay functions to interpret point patterns and assess the degree of spatial agglomeration, followed by Kernel density estimation to generate heat maps enabling niches of schools containing high and low educational quality to be identified. Following the evaluation of agglomerations, different models for the quality of education were estimated and assessed according to the covariates context, school, household, and student. Among the models evaluated were classical regressions, models with spatial dependencies (SAR-Spatial Autoregressive Model) and models with spatial dependence on errors (SAE- Spatial Autoregressive Error Model). The metrics used to compare the models are: likelihood ratio tests and information criteria such as the Akaike and the Bayesian.
Data
We used information provided by ICFES, drawn from the two SABER11 tests it administered in 2018. We used the statistical software R and the packages raster, rgdal, and sp. First, we performed a match using the two 2018 databases. Since the information obtained comes from all over Colombia, the next step was to select the study area, using the municipality code to filter the data for Cali.
Next, using the cartography of the city's schools, the students who took the SABER11 tests were added to their respective schools using the establishment code, and cycles were created to contrast each variable of interest within the cartography.
The student variables added in this process were: scores achieved, hours in paid work, type of remuneration received, household stratum and gender. The variables for family characteristics were: household size, education achievement of parents and possession or not of internet, and television services and computer. School variables were: whether the school is state or private and whether or not it is bilingual. Finally, we used the National Police database to record the number of homicides occurring within a 500 metre buffer zone around each educational institution.
Once the different variables of interest had been added to the cartography of the schools, an intersection was made between the schools and the database of Cali's constituent communes, providing the information that was subsequently inserted into the model ready for the different descriptive and spatial analyses that are presented in the following sections.
Descriptive Analysis
We used spatial statistics methods to develop the distribution maps of the schools. Specifically, we relied on the point pattern technique given the nature of the data involved.
Figure 1 is a map of Cali, showing its constituent communes. The points indicate the schools that participated in the SABER11 tests in 2018.
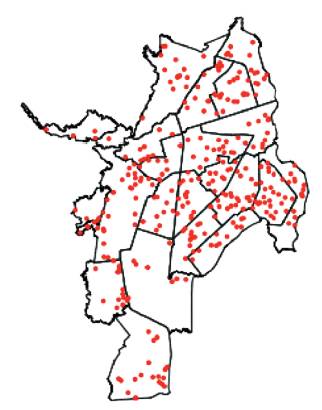
Source: Data from the Colombian Institute for Educational Assessment and Evaluation (ICFES) for the SABER11 tests for 2018.
Figure 1 Map of Cali with the Distribution of Schools
Table 1 presents descriptive indicators of the characteristics of the students, families and schools. On average, the scores achieved by students of schools in Cali in the different subjects during 2018 were above 50. Critical reading scores and English scores were highest, with an average of 55.57 points and 54.89 points respectively. The average aggregate score obtained by students was 264.41 points.
Table 1 Descriptive Indicators
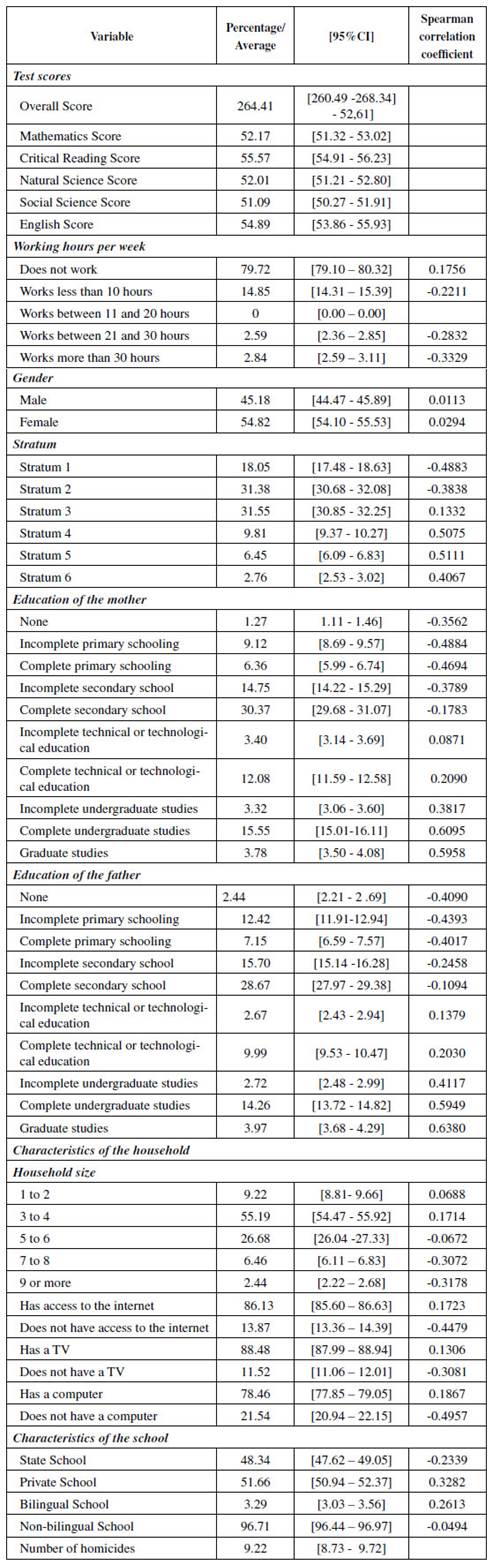
Note: As this article does not aim to measure educational gaps and/or characterizations and differences between state and private schools, Table 1 shows aggregate statistics for educational facilities in Cali.
Source: Data from the Colombian Institute for Educational Assessment and Evaluation (ICFES) for the SABER11 tests for 2018.
79.2% of students were not in employment. 54.82% of those who presented the test were female. The commonest social strata - with 31.55% and 31.38% respectively - were 3 and 2 (in Colombia the population is divided into six social strata, 6 being the most affluent and 1 the poorest). The commonest level of parental educational achievement was completion of secondary school (30.37% of mothers and 28.67% of fathers).
Analysis of household size found that 55.19% of households were made up of 3 to 4 people. Most students (86.13%) had internet services, 51.66% of the schools were private and 96.71% were monolingual. Finally, in 2018 the average number of homicides per school within the 500 metre buffer zone was 9.22.
Existence of Agglomeration
The K Function is a Complete Spatial Randomness (CSR) Test evaluated using distances. It is employed to analyse the spatial pattern of data and to summarise spatial dependence over a range of distances. Figures 2 and 3 present the results of the K function, both for the worst-performing schools and for those with better results.
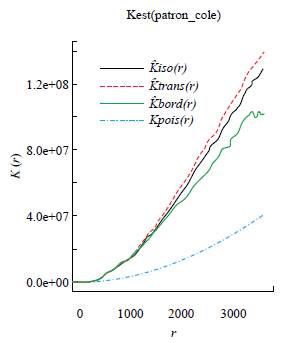
Sourse: Data from the Colombian Institute for Educational Assessment and Evaluation (ICFES) for the SABER11 tests for 2018.
Figure 2 K Function, worst-performing schools (Low scores)
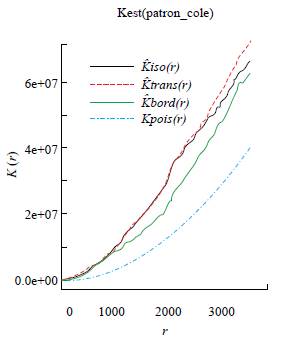
Sourse: Data from the Colombian Institute for Educational Assessment and Evaluation (ICFES) for the SABER11 tests for 2018.
Figure 3 K Function, Better-Performing Schools (High scores)
Some patterns were discernible at the spatial level. The poisson pattern was random and, as may be seen in Figures 2 and 3, the curves observed are above the random pattern, indicating that the data confirms a spatial agglomeration. These results suggest the presence of an agglomeration of educational quality in Cali's schools, a finding that is corroborated by Figure 4.
Figure 4 shows the 20 schools that achieved the lowest scores in the test and the 20 that scored best. The former are located in the east of the city, specifically in communes 13, 14 and 15 while the latter are all located in the south, specifically, in commune 22.
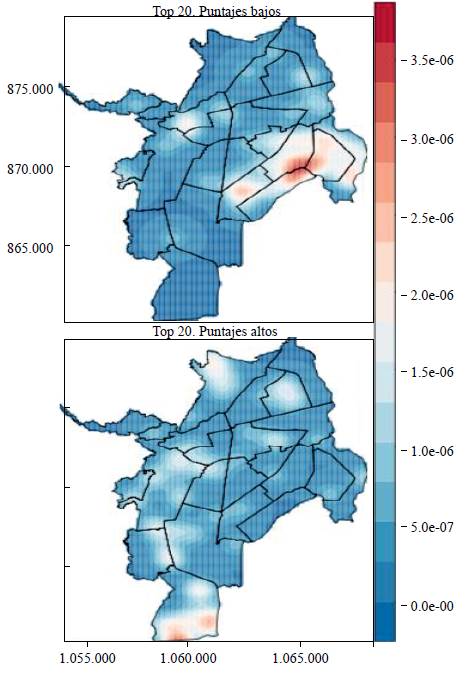
Source: Data from the Colombian Institute for Educational Assessment and Evaluation (ICFES) for the SABER11 tests for 2018.
Figure 4 Kernel Density Estimation
This finding supports the initial hypothesis that educational quality in Cali's schools presents a structure of agglomeration at the spatial level, meaning that high-quality educational institutions are spatially concentrated, creating a niche effect.
To corroborate these findings, we calculated Moran's Index, which analyses spatial autocorrelation. This index can take values between -1 and 1. A value greater than zero indicates positive spatial autocorrelation (a cluster pattern) while a value below zero indicates a dispersion pattern.
We obtained a value of 0.311 for Moran's Index with a significance of 1%, indicating positive spatial autocorrelation confirming the existence of an agglomeration of educational quality in Cali. The educational quality of the schools is more related to the nearby schools than to those further away. Both low-quality and high-quality schools tend to be concentrated (lower left quadrant and upper right quadrant).
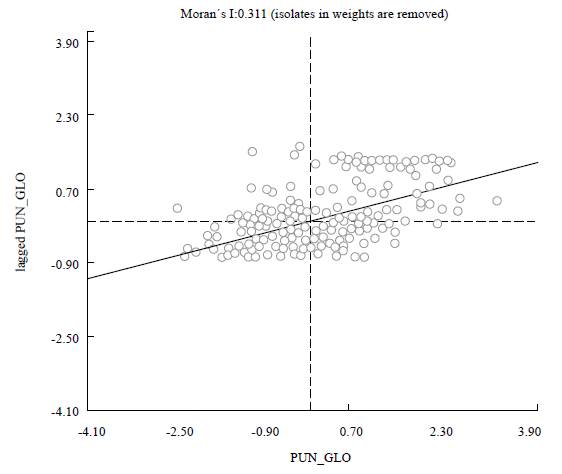
Source: Data from the Colombian Institute for Educational Assessment and Evaluation (ICFES) for the SABER11 tests for 2018.
Figure 5 Moran's Index, Cali 2018
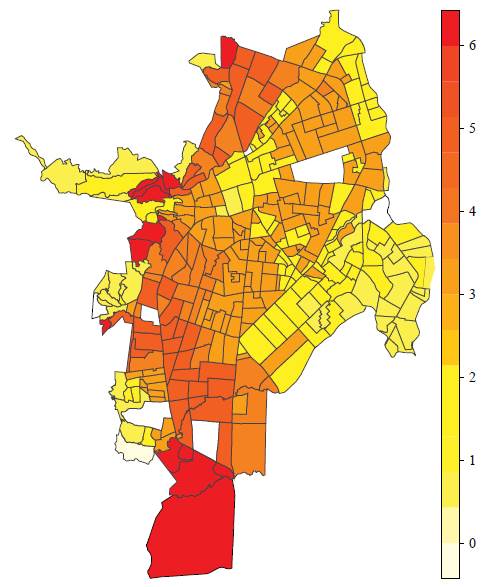
Moreover, Figure 6 illustrates a clear trend at the spatial level. The schools with the highest test scores are located in the south of the city, specifically in neighbourhoods of high socioeconomic strata, while the schools with the lowest scores are located in the eastern part of the city where most of the neighbourhoods belong to lower socioeconomic strata.
PROPOSED MODEL
The dependent variable in the model is the educational quality of Cali's schools. To determine the best combination of covariates that might affect educational quality, different personal and socio-economic variables were considered in the construction of the model.
We used the Spatial Lag Model, represented by:
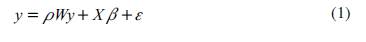
Where y is the dependent variable. This is a vector that contains the scores obtained for each of the subjects evaluated by the SABER11 test. Its size is (Nx1). p is the spatial lag parameter to be estimated. W is the matrix of spatial weights; it is squared and its size is NxN and represents the intensity of interdependence that can exist between schools. For the construction of the W matrix, schools within a distance of 3,000 square metres of each other were considered to be neighbours. X represents the matrix of covariates and s is a vector with uncorrelated errors.
The estimation of the model was carried out using GeoDa software. This modelling process enables the possible relationship between educational quality and explanatory variables in neighbouring schools to be analysed.
Including the possible covariates that might explain the quality of education in Cali, the statistical model is:
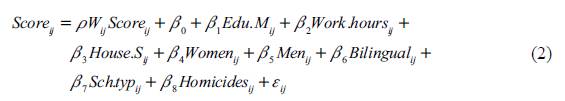
Where Score is the average score obtained by students in the subjects of Mathematics and Critical Reading, and the overall score achieved in the SABER11 test. Student scores were aggregated at school level.
Edu.M represents the level of educational achievement of the mother. For this variable, the most representative educational level was assigned to each school. Work.hours indicates the number of hours each student worked weekly. House.S defines the number of people with whom each student lived in their home.
Female and Male indicate the proportion of girls and boys who took SABER11 tests per school. Bilingual indicates whether the school is bilingual or not. We expected bilingual schools to increase student scores in the SABER11 tests.
Sch.Typ indicates whether the school is state [Sch.Typ=1] or private [Sch.Typ=0]. We expect private schools to perform better in the tests. Finally, Homicides determines the number of homicides that occurred within a 500-meter buffer zone around each school. We expected a greater quantity of homicides to affect educational quality negatively.
EMPIRICAL RESULTS
Three simulations were performed using the spatial lag model in the GeoDa software, this model introduces a Lag spatial variable, which allows spatial dependence to be observed.
The results are as follows (see Table 1).
Table 2 Estimates of the Educational Quality in Cali for the Year 2018
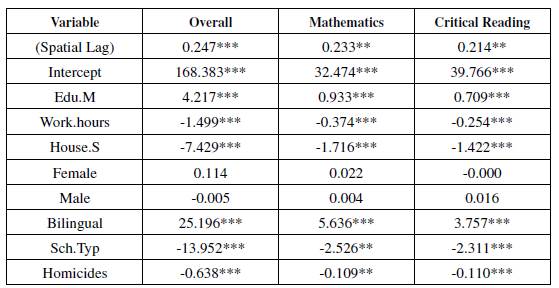
*** Significant at 1 % ** Significant at 5 % * Significant at 10 %
Source: Data from the Colombian Institute for Educational Assessment and Evaluation (ICFES) for the SABER11 tests for 2018.
The dependent variables are the scores in mathematics, critical reading and overall, which were taken as proxy variables for educational quality. The regression shows that the spatial lag in all three cases is significant, as is the intercept.
In the model in which the overall score is the dependent variable, it was found that when the number of homicides around the school increases by one percentage point, educational quality decreases by 0.63 percentage points, a finding that is consistent with our expectations. Moreover, the education of the mother is significant at 1% and has a positive relationship with the dependent variable. That is, when the educational level of the mother increases by one percentage point, the student's overall score (educational quality) increases by 4.22 percentage points.
Another significant result in this model is the number of hours the student works, which has a value of -1.49 points and is consistent with our expectations. If students are obliged to distribute their time between working and studying, they may not be able to fulfil their school activities adequately.
In the three regressions, the relationships found were as expected. As the educational level of the mother increases, their children obtain higher test results, indicating better educational quality. Similarly, if the school is bilingual, test scores are higher. On the other hand, when the number of hours worked increases, test scores decline. Similarly, when the number of people in the household is higher, or the number of homicides around the school rises, test scores fall.
Additionally, in the three models it was found that educational quality is lower in state schools. This could be explained by the fact that there are approximately three times more state schools than private and that consequently, the number of students who attend state schools and take the test is higher. A larger number of very low scores could lower the averages.
Another explanation might be that the educational quality of private schools tend to be higher as they are located in better geographical conditions. The variables related to gender were not significant in the models.
CONCLUSIONS
The point patterns methodology is an interesting alternative in the field of spatial statistics, as it allows the agglomeration of educational quality in Cali to be analysed in a novel way, as it provides geo-referenced information for each school. This makes it possible to observe the different socioeconomic factors that may affect agglomeration holistically.
It was found that high educational quality is concentrated in the south of the city, specifically in commune 22. This finding is consistent with the fact that most of the city's higher-income neighbourhoods are located there. The cluster of the worst-performing schools is found in the east of the city, in communes 13, 14 and 15.
In addition, school facilities are uneven. In commune 22 (high quality) the schools have superior educational materials and infrastructure to the schools in communes 13, 14 and 15 (low quality). Therefore, to minimise the negative effects of educational agglomeration and segregation in Cali, and to increase educational quality, efforts must be increased to provide better resources and facilities to schools located in disadvantaged environments and efforts should be made to attract better-trained teachers and managers.
One of the principal findings of this study is the negative effect of criminality on academic performance. This shows the necessity of improving social security and public order policies in the city.
Similar studies should be conducted to identify the large educational gaps in Colombia's major cities, such as Cali. The hillside areas that concentrate the largest number of state schools perform least well in the SABER11 tests. Additionally, the context of these schools (risk areas, high homicide rates, etc.), present challenges that might complicate further research into the situation.
Social division is reproduced in schools. For example, in commune 22 many schools operate a "club-type" model whereby parents pay for "shares" in return for high-quality quality bilingual education, while educational quality in many other communes is very low. This situation exacerbates differences that may generate problems, given the social gaps that characterise relations between inhabitants of the same city. It is a challenge for state policy to analyse educational segregation and build solutions so as not to keep aggravating the situation.
Finally, it is important to note that the investigations described in this article highlight the need to study educational segregation in Latin America. It is likewise necessary to deal with this issue in Colombia, where research on the problem is scarce. Simultaneously, it is crucial that these concerns are transmitted to policymakers.

