


 English (pdf)
 Article in xml format
 Article references
 Send this article by e-mail
 Cited by SciELO
  Cited by Google
  Similars in
SciELO
Similars in
SciELO  Similars in Google
 Permalink
INTRODUCTION
Cryptocurrencies are modern, digital means of exchange that rely on cryptography to ensure the anonymity of financial transfers (Hardle et al., 2019). Although there is a vast range of cryptocurrencies, Bitcoin (BTC) is by far the most important one today. Since its creation 2008, BTC has evolved into a globally operating system, which sets the dominant standards for the industry. In recent years, and especially since 2017, BTC's astonishing market price rises and fluctuations, as well as the profit opportunities with which they are associated, have attracted worldwide attention from investors, financial authorities and the news media. According to CoinDesk (n.d.) BTC's market price stood at US$964 in January 2017, increasing to an all-time high of US$ 19,167 in December 2017 before crashing again to US$ 3,195 within a year after its peak.
In fact, comparing the behaviour of BTC market prices in recent years with historic episodes of speculative bubbles, it is easy to conclude that similarities exist between the episodes, such as, for example, high volatility measures, a powerful price rally followed by a crashing market prices, etc. This paper seeks to analyse the possibility that BTC market prices experienced an asset price bubble in more depth. Accordingly, it attempts to answer the following research question: To what extent did Bitcoin market prices provide evidence of speculative bubble tendencies during the period between October 2013 and July 2019? The study's statistical approach centres on an analysis of statistical moments, return stationarity analysis, estimations of TARCH-type models and Supremum Augmented Dickey-Fuller (SADF) and Generalised Supremum Augmented Dickey-Fuller (GSADF) tests.
In order to respond to the research question, the paper is divided into five main sections. Following this introduction, the second part (Theoretical Background) presents the theoretical basis of the concepts of speculation, asset price bubbles and BTC. The third section (Methodological Design) outlines the statistical approach used in the study. The fourth part (Presentation and Analysis of Results) presents and interprets the results of the statistical tests. The article ends in section five with some concluding remarks.
THEORETICAL BACKGROUND
Speculation and Asset Price Bubbles
This section of the paper presents the fundamental theory and historical basics of the concept of asset price bubbles. As financial bubbles are speculative mass phenomena that occur in financial markets, it is necessary first to define the term speculation.
Kaldor (1939, p. 1) defines speculation as: "the purchase (or sale) of goods with a view to re-sale (re-purchase) at a later date, where the motive behind such action is the expectation of a change in the relevant prices relatively to the ruling price and not a gain accruing through their use, or any kind of transaction effected in them or their transfer between different markets". Hence, profit-seeking market participants realise speculative transactions in anticipation of generally short-term price changes. In other words, a speculator purchases (sells) an asset at time t0, in the expectation that the future price of the asset will be higher (lower) than the current t0 market price (Demmler, 2017).
A controversial debate is found in financial literature about whether or not speculative activities have stabilizing or destabilizing effects on asset prices. On the one hand, followers of the traditional proposition based on Friedman (1953) are convinced that all profitable speculative transactions have a stabilizing impact on asset prices, as speculators buy when market prices are low and sell when they are high. At this point, a stabilizing effect implies that the frequency and amplitude of price fluctuations are reduced.
Different authors, on the other hand, such as Hart and Kreps (1986) and Baumol (1957), disagree with Friedman's traditional proposition and assign a somewhat destabilizing effect on asset prices to speculation, arguing that speculative transactions increase the frequency and amplitude of market price fluctuations. Specifically, Hart and Kreps (1986) argue that speculators generally buy when the likelihood of price increases is perceived to be relatively high, and sell when they are felt to be low. Furthermore, Minsky's Financial Instability Hypothesis associates debt-financed speculation with financial crises, arguing therefore that speculation has a destabilizing impact on financial markets (Minsky, 1972, 1982).
Empirical evidence for the destabilizing influence of speculators on market prices may be found in numerous historic examples of so-called asset price -or speculative- bubbles. According to Angel and McCabe (2009) speculative activities may add excess volatility to market prices and might contribute to the evolution of financial bubbles, while Shiller (1981) presents empirical evidence of the destabilizing effect of excess volatility on financial markets.
Both Kindleberger and Aliber (2012) and Blanchard and Watson (1982) define asset price bubbles as sharp increases in the market price of an asset, which subsequently collapses. A similar definition is used by Phillips et al. (2011) and by Bouri et al. (2019), who define financial bubbles as extremely rapid accelerations in the market price of an asset followed by a strong market price correction. In these studies, extreme market price movements of this kind are referred to as explosive behaviours.Figure 1 illustrates the typical appearance of an asset price bubble.
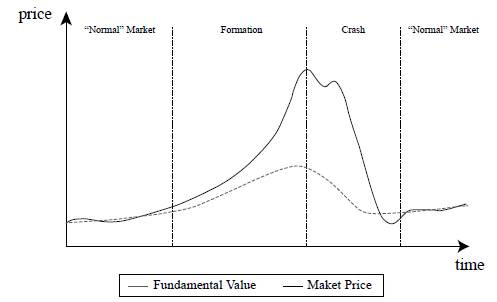
As may be appreciated in Figure 1, an asset price bubble normally displays the two principal phases mentioned in the definitions provided above, namely, an increase in the market price (formation phase) followed by a correction (crash). In Figure 1, the market price of an asset is shown by the solid line. The dashed line represents the concept of the fundamental -or fair- value of the asset. Thus, a financial bubble may also be interpreted as an exaggerated market price movement compared to the asset's fundamental value (Brunnermeier, 2001). Accordingly, asset price bubbles provide an example of inefficient financial markets, which, according to Fama's Efficient Market Hypothesis (Fama, 1970, 1991), should not exist, -according to the theory- market prices always reflect fundamental values. Nevertheless, according to Figure 1, during the formation phase of a financial bubble the asset price increasingly exceeds the level it should have (fundamental value). This mispricing is subsequently erased during the crash phase. Figure 1 also demonstrates that, in this sense, a "normal" (bubble-free) asset market is characterised by movements in market prices and fundamental values that are generally similar to each other -a behaviour that is more consistent with the Efficient Market Hypothesis.
According to Shiller (2015), asset price bubbles are both speculatively and psychologically-driven mass phenomena. Demmler (2017) also highlights the important role played by speculative activities and irrational investment behaviours by market participants in the evolution of financial bubbles. Roehner and Sornette (2000) state that during the formation phase of a speculative bubble, investors expect that the rising trend in the market price of a given asset will continue in the future. Based on this expectation the demand for the asset increases even further and, with it, the market price. Accordingly, market participants by themselves actually fulfill their own expectations of a further increase in the market price without the intervention of others (self-fulfilling prophecy).
Clearly, major asset price bubbles are rather rare occurrences in national and international asset markets. However, many examples have occurred over the centuries, affecting a large variety of assets (including stocks, commodities and real estate). The first ever registered speculative bubble, the so-called Tulipmania episode, occurred in the Netherlands between 1634 and 1637. As its name suggests, this episode of financial speculation was centred on tulip bulbs. According to Hirschey (1998), at the beginning of the 17th century tulip flowers were a status symbol for wealthy segments of the Dutch population. Over time, middle class households started to demand tulip bulbs too, leading to gradual price increases. Beginning in 1634, speculators became attracted to the market in search of short-term profits and converting tulip bulbs into objects of speculation rather than utility, in a process that reached its maximum in the last quarter of 1636 and first weeks of 1637. During this period of mass speculation, less cost-intensive future contracts led poor segments of the Dutch population to participate in the trading of tulip bulbs as well. As a result, the market prices of some tulip bulb varieties increased more than twenty-fold in January and early February of 1637, only to crash again a few weeks later (Garber, 1989).
Another example of a historical asset price bubble, the Wall Street Crash, occurred in the U.S. stock market at the end of the 1920s. The economic boom of the 1920s was fuelled by revolutionary innovations such as automobiles, radio, the telephone and electricity. The period was characterised by significant organisational innovations, such as those associated with Frederick Taylor and the assembly line. Speculation focused principally on various growth industries (such as the media, telecommunications, electronics, aerospace, power supply and the chemical industry) including firms with typically a short period in the market, great - but hard to quantify -future profit potential and little or no history of dividend payments (Stahl, 2000). Figure 2 presents daily Dow Jones Industrial Average Index prices for the period January 1927 to December 1932. The two main phases of a financial bubble are easily discerned: formation (roughly between August 1928 and September 1929) and crash (approximately September to November 1929).
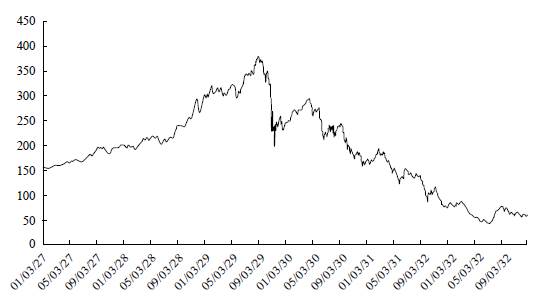
Source: Demmler (2017).
Figure 2 Historical Prices of the Dow Jones Industrial Average Index Between January 1927 and December 1932.
Finally, another example of a historical stock-based speculative bubble is the New Economy Bubble, which occurred at the turn of the millennium and which, according to Shiller (2015), saw the largest speculative asset price rise in the history of stock markets. The financial bubble principally affected businesses in the internet, telecommunications and biotechnology sectors, in which, from the early 1990s onwards, innovations in semiconductor and optical fibre technologies as well as in software and networks resulted in astonishing advances. Like the 1929 crash, the speculations of the New Economy Bubble had repercussions of global scope, as it affected the U.S., British, French, German and other stock markets (Malkiel, 2015). By way of illustration, Figure 3 shows the daily closing prices of the U.S. Nasdaq 100 Index for the period January 1998 to December 2003. The asset price bubble is discernible between early 1998 (the start of the formation of the bubble) and spring 2001 (the end of the crash).
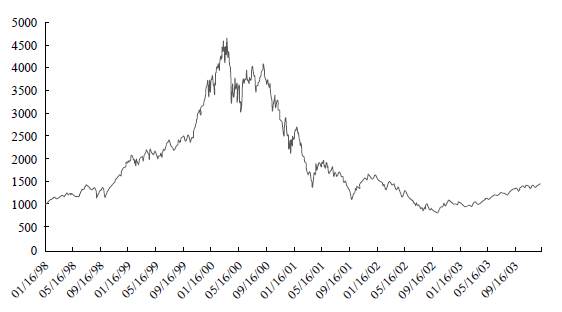
Source: Yahoo! Finance (n.d.).
Figure 3 Historical Prices of the Nasdaq 100 Index from January 1998 to December 2003
CRYPTOCURRENCIES AND BTC
According to Hardle et al. (2019, p. 3), who base their definition of the concept cryptocurrency on some of the principal functions of money, "a cryptocurrency is a digital asset designed to work as a medium of exchange using cryptography to secure transactions, to control the creation of additional value units, and to verify the transfer of assets". Both Makarov and Schoar (2020) and Malherbe et al. (2019) define cryptocurrencies as digital currencies which use blockchain technology and are not backed by any central authority. There are different opinions about the potential impact of cryptocurrencies on existing monetary regimes. Ponsot (2017), for example, states that cryptocurrencies challenge the existing monetary system and the traditional concept of money in general, while Hardle et al. (2019) argue that they represent an existential threat to traditional payment systems based on financial intermediaries, because the participants in cryptocurrency systems (payers and payees alike) realise their financial transfers directly on the internet, within a peer-to-peer mechanism and without the need of a central intermediary. As a result, cheap, secure and near-instant financial transactions are potentially available to billions of people. On the other hand, Malherbe et al. (2019) acknowledge the importance of cryptocurrencies within today's economic world, but deny their potential use as everyday money. Furthermore, Fry and Cheah (2016) argue that cryptocurrencies such as BTC can hardly be characterised as real currencies, as they do not properly fulfil the two currency functions of store of value and unit of account.
Although cryptocurrencies seem to be highly innovative and have recently became very popular as a result of the astonishing price increases achieved by a wide range of cryptocurrencies and of extensive media coverage, the idea of an automated, highly anonymous, e-cash system based on cryptography was first introduced nearly four decades ago, by Chaum (1982). According to Weidmann (2018), around 1,500 different cryptocurrencies exist worldwide today - a number that is likely to increase in the future. Among this vast multitude of cryptocurrencies, BTC is by far the most important.
As a typical cryptocurrency, BTC is a digital, decentralised, anonymous currency that relies on cryptography and peer-to-peer networking (Grinberg, 2011; Gerlach et al., 2019). The idea of BTC was introduced in a white paper published in 2008 by a person or group of persons using the pseudonym "Satoshi Nakamoto". Naka-moto (2008) emphasises the importance of a purely peer-to-peer version of electronic cash secured by cryptographic keys, which allows online payments to be made directly between payers and payees without the costly and time-consuming intermediation of a financial institution. Hence, the original idea of BTC was that users of the system could realise national and international financial transactions much faster and at lower costs than is the case with transfers within the traditional financial intermediary system (Barber et al., 2012).
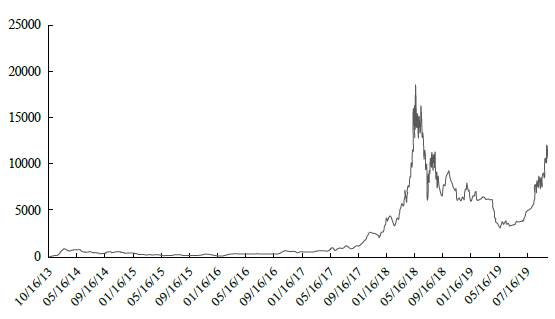
Figure 4 shows historic price data for BTC market prices, specifically for the BTC Price Index published by CoinDesk (n.d.). This index provides an average of BTC prices across the following leading global exchanges: Bitstamp, Coinbase, itBit and Bitfinex. Figure 4 illustrates daily closing prices for the period 1 October 2013 to 31 July 2019. As may be seen, the BTC Price Index quoted a price of US$124 per BTC at the very beginning of the time series (1 October 2013). In 2014 and 2016 BTC market prices might be characterised as relatively stable, fluctuating within a range more or less between US$200 and 900. BTC experienced an astonishing price rally in 2017 as market prices increased from US$964 (1 January 2017) to an all-time high of US$19,167 (17 December 2017) representing a total increase of 1,887.6 % in less than a year. During 2018, the BTC Price Index crashed to US$3,195 (15 December 2018) - a total loss of 83.33 % compared to the December 2017 price. 2019 once again showed a clear upward price trend, which pushed market prices to US$ 12,576 (9 July 2019). At the end of the time series presented in Figure 4 the BTC Price Index quoted a price of US$10,005 (31 July 2019). The entire time series presents a daily mean return of 0.21 %, a daily standard deviation of 4.44 % and a relatively high variance coefficient of 21.14.
As mentioned above, the original idea of the architects of the BTC system was - and remains- to realise financial transfers much more quickly and at significantly lower costs than in the traditional system based on financial intermediation carried out, for example, by commercial banks. However, in recent years, especially from 2017 onwards, the acquisition of BTCs for speculative purposes increased substantially. On this matter Makarov and Schoar (2020) estimate that more than 15 million active investors are currently involved in trading BTC and other cryptocurrencies on more than 100 exchanges worldwide.
Furthermore, international regulatory authorities publicly warn against investments in cryptocurrencies. According to the ECB Crypto-Assets Task Force (2019) cryptocurrencies like BTC are highly speculative assets. Thus, for example, Carl-Ludwig Thiele a former member of the executive board of the German Deutsche Bundesbank states that "the heavy fluctuations in BTC's value ... show that BTC is a high-risk speculative plaything" and "purely as an investment form, BTC is classed as highly speculative since it has no inherent value, unlike precious metals" (Thiele, 2018). Similarly, the European Parliament (2016) identified an urgent need for stricter regulation of cryptocurrencies in order to reduce their potentially detrimental effects on financial stability. Some academic literature has also identified the need for regulatory efforts (e.g. Dow, 2019).
Much of the financial literature characterises BTC and cryptocurrencies in general as highly speculative and potentially dangerous for investors and financial markets. For example, Grinberg (2011) outlines the possibility that the BTC system could be vulnerable to speculative movements such as financial bubbles. Cheah and Fry (2015) characterise it as a speculative asset which continuously suffers financial bubble periods. They also present a calculation of BTC's fundamental value and come to the conclusion that it is actually zero. Moosa (2020) interprets BTC's historic price behaviour as an explosive process containing asset price bubbles. In line with these results, Gerlach et al. (2019) find multiple bubble periods (three major bubbles and 10 additional smaller ones) within BTC market price history between 2012-2018. Moreover, using the methodological approach of Phillips et al. (2015) -a method which is also relevant for the present study- Bouri et al. (2019) examine price data between 2015 and 2017, finding multiple explosive periods in the market prices of BTC and leading cryptocurrencies. They even find interrelations between the bubble episodes of different cryptocurrencies -a phenomenon which they call multidirectional co-explosivity and which might imply possible contagion effects between one cryptocurrency and another. The results of Bouri et al. (2019) are supported by Agosto and Cafferata (2020) for BTC and four other leading cryptocurrencies for the period 2017-2018. Also using the methodology proposed by Phillips et al. (2015), Vogiazas and Alexiou (2019) find evidence for a major asset price bubble in BTC during 2017, while Geuder et al. (2019) detect several episodes of financial bubble tendencies in BTC market prices between 2016 and 2018 and identify a critical moment in December 2017. Finally, Corbet et al. (2018) -using the slightly different method described by Phillips et al. (2011)- find empirical evidence for one financial bubble beginning in early 2017 when BTC market prices surpassed US$1,000.
A different strand of the financial literature highlights the potential advantages of BTC as an investment alternative. For example, Briere et al. (2015) find high weekly average returns of BTC investments for the period 2010 to 2013 and considerable diversification benefits due to low correlation coefficients with other traditional financial assets. Moreover, some studies conclude that BTC and other cryptocurrencies might even exhibit a safe-haven property for stock market investments during extreme market conditions. For instance, Shahzad et al. (2019) and Bouri et al. (2017) show that the safe-haven role of BTC is time-varying and changes across different stock market indices. However, other studies question the diversification potential and safe-haven properties of BTC. For example, Li et al. (2019) find evidence that BTC can be used as a hedge against market specific risks, although they also find strong financial bubble tendencies in BTC on several international exchanges. Furthermore, Koutmos (2019) use daily price data for the period 2013 to 2017 to show that BTC returns depend on the same market risk factors (e.g. interest rates and implied stock market and foreign exchange market volatilities) as other conventional assets. Thus, BTC's potential for diversification and as a safe-haven during problematic market conditions is held to be quite limited.
METHODOLOGICAL DESIGN
The research question of this paper is as follows: To what extent did Bitcoin market prices provide evidence of speculative bubble tendencies during the period between October 2013 and July 2019? Although a simple graphic analysis of historical BTC market prices in Figure 4 appears to provide convincing evidence of speculative bubble tendencies (e.g., 2017-2018 and, more recently, mid-2019), the present study aims to present something more sophisticated and statistically comprehensive. Therefore, we apply three statistical methods based on Baur et al. (2018) and Phillips et al. (2015) to analyse volatility and speculative bubble tendencies in BTC prices and returns. First, in order to properly describe the characteristics of the time series and its volatility, different statistical moments (mean, standard deviation, skewness and kurtosis) of BTC's returns distribution are analysed. To examine structural changes, we also estimate the four statistical moments before and after the Maximum Price Date (MPD), i.e. the moment the BTC bubble is held to have burst (17 December 2017). In addition, we examine the stationarity of BTC returns by analysing the first order autoregressive coefficient in model (1), and performing Augmented Dickey-Fuller (ADF) and Phillips-Perron (PP) unit root tests. To properly specify these tests, we set the number of lags using the Akaike, Schwarz-Bayesian as well as Hannan and Quinn information criteria and include a constant or trend term according to their statistical significance.
In equation (1)x t indicates BTC returns, and e t is an error term, assumed to be normally distributed e t ~ N(0, σ 2 t ). If BTC returns follow a stationary process then p< 1, and the ADF and PP tests reject the null hypothesis of a unit root.
We also estimate Threshold Autoregressive Conditional Heteroskedasticity (TARCH)-type models (2) to analyse the volatility of BTC returns. The specification of the model allows us to estimate persistence as well as asymmetric effects of shocks in the volatility equation.
In equation (2)x t denotes BTC returns and e t is an error term (also called innovation) assumed to be distributed e t ~ N(0, σ 2 t ). S is a constant parameter that shows general volatility of the returns and (e t-1 > 0) represents an indicator function that takes the value 1 when the lagged error is positive and 0 otherwise. y is the TARCH parameter that shows the additional volatility caused by a positive shock, i.e. the asymmetric effect. a and ( are the Autoregressive Conditional Hetero-skedasticity (ARCH) and Generalised Autoregressive Conditional Heteroskedas-ticity (GARCH) parameters respectively, which show whether there is persistence in the volatility (due to past innovations or past volatility).
Finally, in order to identify potential financial bubble tendencies, we compare the results of the Supremum Augmented Dickey-Fuller (SADF) test and the Generalised Supremum Augmented Dickey-Fuller (GSADF) test proposed by Phillips et al. (2015) for BTC prices in logs. Since the SADF and GSADF use recursive testing, we establish the starting testing point at a threshold of 2 % of data available, as suggested by the authors, increasing it by one observation (one day) at a time for each recursion. As before, to correctly specify the ADF version of the tests, we set the number of lags using the Akaike, Schwarz-Bayesian and Hannan and Quinn information criteria, and the inclusion of a constant or a trend term according to their statistical significance in the recursion, which included MPD.
As Phillips et al. (2015) remark, both the SADF and GSADF are right-tail variations of the unit root tests, which test the null Ho: p = 1 (unit root) against the alternative Ha: p> 1, i.e. a mildly explosive process or an asset price bubble. It is important to note that the GSADF is consistent even in the case of multiple bubbles, whereas the SADF test is not. In order to decide whether or not to reject the null, we use the asymptotic critical values provided by Phillips et al. (2015), which the authors regard as more adequate for practical use.
PRESENTATION AND ANALYSIS OF RESULTS
We use data of daily BTC prices spanning nearly six years, covering a period between 1 October 2013 and 31 July 2019. Data was obtained from CoinDesk (n.d.), which provides a comprehensive picture of BTC price behaviour on a global scale, as the CoinDesk BTC Price Index represents an average of BTC prices across leading global exchanges. As is evident from Figure 4, the data shows the typical sharp rise and decline of market prices characteristic of a speculative bubble, as discussed in the theoretical section of this paper.
BTC returns are obtained as the percentage of daily log-price differences, i.e. r t = [ln(pt) -ln(Pt=1)]X 100 . Figure 5 displays BTC returns, alongside MPD, on 17 December 2017, marked with a vertical line.
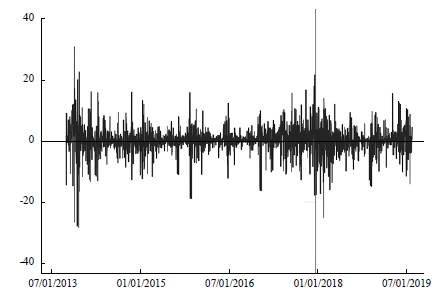
Figure 5 suggests that BTC returns remained stationary around zero, so a less-than-unity AR(1) coefficient might be expected. The figure indicates that the greatest volatility of returns was present following the beginning of the series (November-December 2013) as well as near MPD. The maximum positive return of BTC occurred before MPD (close to 30% on 19 November 2013) when market prices were close to US$700. Interestingly, Figure 5 also displays a return greater than 20% some days before MPD, as prices reached US$16,299. Likewise, maximum negative returns (also greater than 20%) occurred on 17 December 2013 and soon after MPD (6 February 2018).
Table 1 shows the momentums of the BTC return distribution, illustrating some differences in the BTC returns between the two subperiods - before and after MPD. Considering the entire sample, BTC's mean return is positive. Standard deviation is considerably greater than its mean, suggesting that the asset's overall volatility is substantial. The skewness of BTC returns is negative, so most are greater than their mean. The fact that BTC's mean return is close to zero suggests that most of its returns were positive. Tests of a statistically different-from-zero means are analysed later.
Table 1 Statistical Moments (Returns)
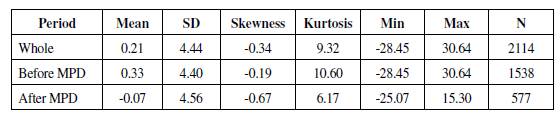
Notes: MPD: maximum price date. SD: standard deviation.
Source: Author's own elaboration.
Table 1 also indicates that before MPD, BTC's mean return was positive and relatively large in magnitude. Moreover, the standard deviation and skewness of BTC returns were somewhat smaller than for the whole period, suggesting that BTC returns were slightly less volatile before MPD. However, after MPD the mean return was negative, as were the returns' skewness. Furthermore, the standard deviation of BTC returns increased slightly compared to the period before MPD, suggesting that BTC returns became more volatile after this point. Figure 6 clearly shows that the density of BTC returns after MPD had a significantly smaller kurtosis, while the density for negative returns was generally greater. Likewise, after MPD, BTC returns density ended in a positive return of 15 %, whereas for the whole period, and before MPD, skewness was not as great in absolute terms.
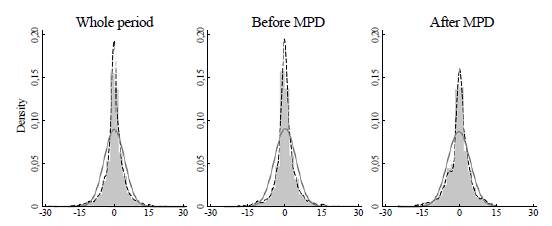
Notes: Figures show normal (grey) and kernel (black dashed) densities. Source: Author's own elaboration.
Figure 6 Histograms of BTC Returns
Reinforcing the discussion of Figure 5, Table 2 presents evidence that BTC returns followed neither a unit root process nor a (stable) AR(1) process either during the whole period analysed or in any subperiod. This result supports the argument that, even though the asset returns show volatility, deviations from a long-term value (1 in equation 1) do not last and the process reverts to an equilibrium, i.e. to the mean return. The sharp rise and decline of BTC returns suggests the presence of exuberant behaviour in BTC prices. However, before performing tests on BTC prices we examine its return variance (volatility).
Table 2 AR(1) Coefficients and Unit Root Tests (Returns)
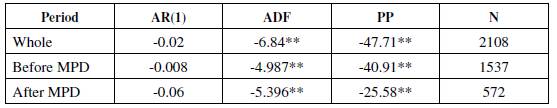
Notes: *, ** denotes significance at a 5% or 1% level respectively. MPD: maximum price date. AR(1): Autoregressive model of order 1. ADF: Augmented Dickey-Fuller test. PP: Phillips-Perron test.
Source: Author's own elaboration.
A deeper analysis of returns volatility is shown in Table 3. The insignificant p coefficients in the mean equation show that BTC returns do not follow a stable AR(1) process in any period analysed when volatility (second part of equation 2) is estimated along with the AR(1) equation (first part of equation 2). Moreover, the insignificant constant coefficients (λ) suggest that the long-term expected value of the returns moved close to zero for the whole sample and after MPD. However, the constant coefficient was significant before MPD, suggesting that the expected value of BTC returns had a positive value before MPD.
Table 3 TARCH Models (Returns)
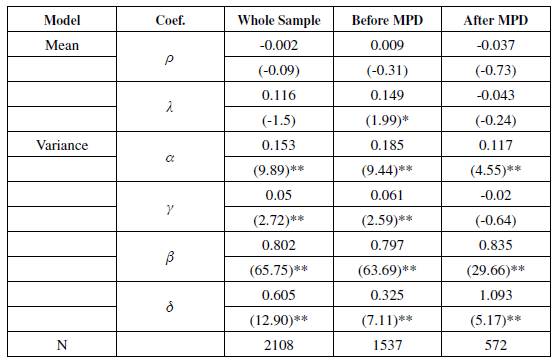
Notes: *, ** denotes significance at a 5 % or 1 % level respectively. standard error in parenthesis. MPD: maximum price date.
Source: Author's own elaboration.
Considering the entire sample, BTC returns show a positive and relatively high δ. Hence, BTC returns were relatively volatile overall, being greater after MPD. In addition, BTC returns present a positive ARCH coefficient (α), so past innovations exert a positive effect on current volatility. This result might accord with Koutmos (2019) who argues that exogenous risk factors influence BTC's return behaviour. Moreover, BTC returns display a positive TARCH coefficient (y), i.e. a positive shock has a greater effect on BTC returns volatility than does a negative shock. Finally, the GARCH coefficient (β) is also positive. Thus, past volatility has a relatively high effect on current volatility. Similar results are found when the subperiod before MPD is examined. However, after MPD the TARCH coefficient was not statistically significant. Thus, there is no evidence that positive shocks had a different effect on volatility than did negative shocks. This suggests that returns reacted more to decreases after MPD than before. That is, investors became more sensitive to declines in BTC returns after MPD.
Table 4 demonstrates that both SADF and GSADF statistics reject the null at a 99% level, so there is evidence that BTC experienced at least one period of speculative bubble tendencies in the time series under examination. In order to identify the dates when BTC experienced mildly explosive behaviour, we show the SADF test recursions in Figure 7. It is clear that the SADF test statistics of BTC prices reached their greatest values at the beginning of the period analysed and close to MPD. Furthermore, it is interesting to note that these statistics reject the null, generally during the two episodes of greatest volatility of returns: at the beginning of the period analysed and close to MPD (see Figure 5). For instance, after a period of relatively greater volatility in BTC returns around August 2016, the SADF test recursions started to increase until it reached its maximum value.
Table 4 SADF and GSADF Tests (Prices)
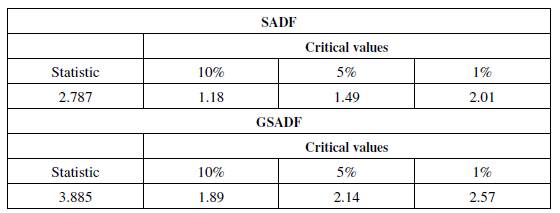
Notes: SADF: Supremum Augmented Dickey-Fuller. GSADF: Generalised Supremum Augmented Dickey-Fuller.
Source: Author's own elaboration.
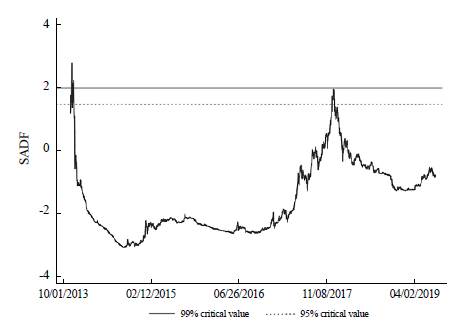
The SADF test recursions displayed in Figure 7 show two moments where the statistics reject the null at a 95% level: at the beginning of the series and close to MPD. This suggests the presence of at least one speculative bubble in BTC prices. Since Phillips et al. (2015) claim that the SADF test is not consistent if there is more than one exuberance episode, we should rely on the GSADF test instead.
Figure 8 shows several moments where the GSADF statistics surpassed the 95% and 99% critical values, revealing multiple moments of financial bubble tendencies within the time series. Phillips et al. (2015) argue that the best statistical evidence of a major financial bubble can be found where the ADF statistic exceeds the critical value for a relatively long period. Therefore, as the GSADF statistic rejects the null at a 99% level for a relatively long period of time during December 2017 (reaching a peak when MPD occurred), it seems that speculative bubble tendencies also reached a critical maximum at the time when BTC prices reached their greatest levels.
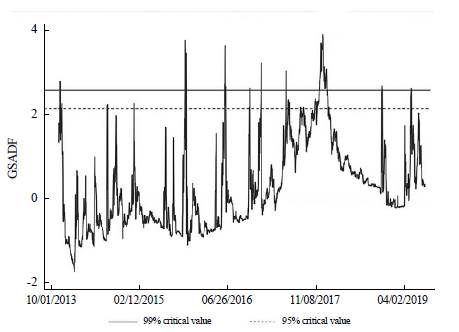
Figure 9 shows some important dates/events along with BTC prices and returns alongside the GSADF statistics, in order to facilitate an examination of the other apparent moments of exuberance. As is apparent, the first time that the GSADF statistic surpassed the critical value coincided with the U.S. senate hearing on BTC and digital currencies on 18 November 2013. Subsequently, BTC returns exhibited a period of relative volatility (returns greater than 20% in absolute value). Yet before long the GSADF statistic moved below the 95% critical value. The next relevant moment when the GSADF statistic reached levels above the 99% critical value was shortly after the introduction of the Gemini Bitcoin exchange in the US. It is, furthermore, interesting to note that after Japan declared that BTC could be used as legal tender, BTC prices and GSADF statistics increased, a trend that culminated in MPD. After MPD, the GSADF statistic reached the 99% critical value after Christine Lagarde of the IMF declared in November 2014 that central banks might consider issuing digital currencies. The GSADF statistic also reached the 99% critical value in the first days of May 2019, coinciding with increased reporting by news media of Facebook's plans to launch its own cryptocurrency, which seemed likely to evolve into the most mainstream cryptocurrency yet. These moments were certainly very important for the BTC market in general and resulted in periods of increased volatility and potential speculative bubble tendencies around the dates in question. The other moments when the GSADF reached the 99% critical value do not appear to be related to any major event.
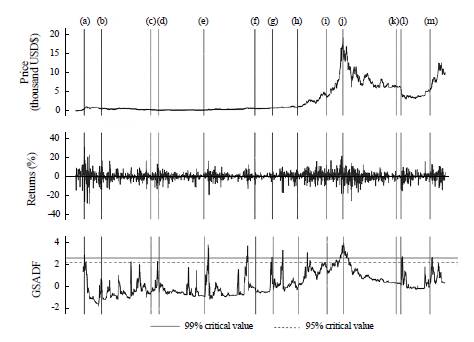
Notes: Vertical lines indicate important events as identified by Koutmos (2019), Landauro (2018), BBC (2018) and Andriotis et al. (2019): (a) 18 November 2013: The U.S. Senate holds a hearing on BTC and digital currencies. (b) 24 February 2014: BTC exchange Mt. Gox suspends all trading and closes. (c) 11 December 2014: Microsoft begins accepting BTC. (d) 26 January 2015: Coinbase opens within U.S. borders. (e) 8 October 2015: Gemini BTC exchange is launched. (f) 2 August 2016: Approximately 120,000 units of BTC (by then, worth US$72 million) are stolen. (g) 9 November 2016: Donald Trump is elected U.S. president. (h) 1 April 2017: Japan declares that BTC may be used as legal tender. (i) 15 September 2017: China's three largest exchanges - BTC China, Huobi and OKCoin - suspend local trading. (j) 17 December 2017: Maximum price date. (k) 19 October 2018: Financial Action Task Force (FATF) says jurisdictions worldwide will be required to license or regulate cryptocurrency exchanges. (l) 14 November 2018: Christine Lagarde, then Managing Director of the International Monetary Fund (IMF), states that central banks around the world should consider issuing digital currency. (m) 2 May 2019: Increased reporting by news media of Facebook's plans to launch its own cryptocurrency. Source: Author's own elaboration.
Figure 9 Important Dates and BTC Prices, Returns and GSADF Sequence
CONCLUDING REMARKS
The research question posed in this paper was: To what extent did Bitcoin market prices provide evidence of speculative bubble tendencies during the period between October 2013 and July 2019? The quantitative research approach analyses daily price data from the information provider CoinDesk, which publishes an average of BTC prices in leading global exchanges. This makes it possible to obtain a comprehensive perspective on BTC price behaviour on a global scale. Nevertheless, the current study cannot claim to offer a perfectly complete picture of existing historical prices as the BTC market - like any other cryptocurrency market - is a highly innovative and dynamic system whose price behaviours change on an almost daily basis.
First of all, statistical moments as well as return stationarity analysis and estimation of TARCH-type models were presented in order to characterise the time series of BTC prices. Second, SADF and GSADF tests for the identification of speculative bubble tendencies were considered. The principal results were as follows:
For the entire sample period (October 2013 to July 2019), BTC's mean return was positive. As standard deviation was substantially greater than its mean, BTC market prices may be considered highly volatile. Consequently, we characterise BTC as a highly speculative asset, a view that is in agreement, for example, with the positions of Cheah and Fry (2015) and Moosa (2020). BTC prices showed a positive mean return before MPD (17 December 2017) and a negative one afterwards. Volatility, measured by the standard deviation of the returns, was slightly higher after than before this date.
The sharp rise, which began in January 2017 and continued until the MPD, and the crash of BTC market prices that followed suggest the presence of exuberant behaviour in BTC prices. Indeed, the GSADF statistic reveals the occurrence of several exuberant episodes (mildly explosive behaviours) in BTC market prices throughout the sample period, which may be interpreted as financial bubble tendencies. A critical maximum of these speculative bubble tendencies was detected for the end of 2017 - when the ADF statistic exceeded the critical value for a relatively long period of time and BTC prices reached their historic maximum levels.
Our results are in line with previous studies, such as those of Bouri et al. (2019), Geuder et al. (2019) and Agosto and Cafferata (2020), as well as of Vogiazas and Alexiou (2019), who, like us, all used the methodology proposed by Phillips et al. (2015) -albeit for different and shorter samples than ours- and find evidence of multiple periods of bubble tendencies in BTC market prices. Furthermore, several of the studies coincide with our results, identifying 2017, and especially late 2017, as a critical period during which bubble tendencies reached their maximum.
As this paper identifies various moments marked by explosive behaviours in BTC market prices during the sample period, and a particularly critical period in late 2017, there is clear evidence for the destabilizing effects of speculation on BTC market prices. This finding is consistent with the excess volatility argument of Shiller (1981) and Angel and McCabe (2009). Moreover, the theoretical section of the paper shows that the original idea of the architects of BTC was to establish an autonomous peer-to-peer payment system whose principal aim was to offer time and cost advantages in comparison with traditional payments systems based on financial intermediation. However, recent years show that BTC is effectively "(mis-)used" for speculative purposes -a general characteristic of asset price bubbles, as is apparent from historical financial bubbles such as Tulipmania, the 1929 Wall Street Crash or the New Economy Bubble.
It is important to mention at this point that we do not question the outstanding potential of BTC and of cryptocurrencies in general as modern, digital means of payment, which are highly necessary in the globalised digital world we inhabit today. However, extreme caution should be exercised and cryptocurrencies should not be interpreted (wrongly) as mere speculative investment vehicles. This has, though, been the exact tendency that has been followed in recent years -years that were characterised by the search for new investment alternatives for portfolio diversification and innovative investment alternatives in the light of, for example, unattractive investments in conventional alternatives such as low-yielding debt instruments.
Finally, and based on all the above arguments, we would like to stress our support for strict regulatory efforts in BTC and cryptocurrency markets in general in order to limit speculative investments. This final consideration is consistent with the views of several significant authors with policy responsibility, for example the ECB Crypto-Assets Task Force (2019), Carl-Ludwig Thiele (Thiele, 2018) and the European Parliament (2016).

