


Services on Demand
Journal
Article
 English (pdf)
 Article in xml format
 Article references
 Send this article by e-mail
Indicators
-
 Cited by SciELO
 -
 Access statistics
Related links
-
 Cited by Google
 -
 Similars in
SciELO
Similars in
SciELO -
 Similars in Google
Share

 Permalink
Revista de Ingeniería
Print version ISSN 0121-4993
rev.ing. no.36 Bogotá Jan./June 2012
CMIP5 Climate Simulations: Implications for Hydrology*
CMIP5 simulaciones de clima: implicaciones para la hidrología
Lawrence Buja(1),
(1) Director of the Climate Science and Applications Program (CSAP) at the National Center for Atmospheric Research (NCAR), Boulder, Colorado southern@rap.ucar.edu
Recibido 3 de octubre 2012, modificado 19 de octubre de 2012, aprobado 7 de noviembre de 2012
Key words
Adaption, climate change, climate simulation, global warming, vulnerability.
Abstract
This article points out through climate simulations from the National Center for Atmospheric Research (NCAR) that global warming will be increased by the end of the 21st century 3.3°C and in some areas as 7-8°C. This change will have an impact on agricultural production and human mortality. A new emphasis on the integration of social sciences with physical sciences will be fundamental to address the problem of climate adaptation; likewise, it will be important for decision-making to overcome the vulnerability and the challenges that brings a climate change.
Palabras claves
Adaptación, cambio climático, simulación climática, calentamiento global, vulnerabilidad.
Resumen
En este artículo se señala a través de las simulaciones climáticas del centro nacional de la investigación atmosférica (NCAR) que, para finales del s. XXI, habrá un incremento de la temperatura del 3.3°C y en algunas áreas hasta de 7-8°C. Este cambio repercutirá sobre la producción agrícola y la mortalidad de los seres humanos. El nuevo enfoque que integra las ciencias sociales con las ciencias físicas busca manejar el problema de adaptación al al cambio climático y, asimismo, influir en la toma de decisiones para afrontar la vulnerabilidad y los retos que impone la adaptación al cambio climático.
INTRODUCTION
The effects of climate change on the hydrology and water resources are often evaluated using climate simulation models as part of the Coupled Model Intercomparison Project (CMIP). CMIP simulations carried out at the National Center for Atmospheric Research (NCAR) are used to analyze changes in projected temperature and precipitation means and extremes under different future emissions scenarios. These global climate simulations are used to study societal vulnerability and adaption options.
CLIMATE SIMULATIONS
The NCAR in Boulder Colorado is a Federally Funded Research and Development Center (FF RDC) that undertakes basic and applied research into atmospheric and related sciences. Founded in 1960 to support the University research community, NCAR consists of four laboratories, the Earth Observing Laboratory, the NCAR Earth System Laboratory (NESL), the Computational Information Systems Laboratory and the Research Applications Laboratory. Cross laboratory research programs are supported by the crosscutting Integrated Science Program.
One of the fagship activities of the NCAR Earth System Laboratory is the development of the application of open source global and regional climate models. The Community Earth System Model (CESM), NESL's global climate model, has been used to carry out past, present and future simulations of the earth's climate for the global Coupled Model into Comparison Project (CMIP). The CESM model is validated through careful comparison of how well it simulates the observed climate of the present and recent past. Figure 1 compares the simulations of the earth's globally averaged surface temperature over the past One of the fagship activities of the NCAR Earth System Laboratory is the development of the application of open source global and regional climate models. The Community Earth System Model (CESM), NESL's global clima-te model, has been used to carry out past, present and future simulations of the earth's climate for the global Coupled Model into Comparison Project (CMIP). The CESM model is validated through careful comparison of how well it simulates the observed climate of the present and recent past. Figure 1 compares the simulations of the earth's globally averaged surface temperature over the past thousand years by CESM (red) with the best available reconstruction of observational temperatures over that same period (green). While there are periods in which deviation in terms of the impacts of volcanoes appear to be over predicted, the CESM does a good job of reproducing the variation of the evolution of the earth's surface temperature over the past thousand years. The pullout in figure 1 shows that we can only simulate (black line) the observed temperature trends over the 20th century (redline) by including man-made gases. When the exact same simulation is run without the man-made gases present in the simulated atmosphere (blue line), the simulation deviates from the observed record starting in the 1980s. The Intergovernmental Panel for Clima-te Change 5th Assessment Report (IPCC AR5) evaluates and synthesizes the current physical, social and political science research in the area of climate. The physical science assessment is based on two foundational observations of the earth climate system and simulations of the past present and future climate states, such as the simulations carried out for the CMIP analysis. A summary plot of the CESM simulations for the IPCC AR 5 and the six-year timeline that the IPCC assessment reports have historica lly followed are shown in figure 1.
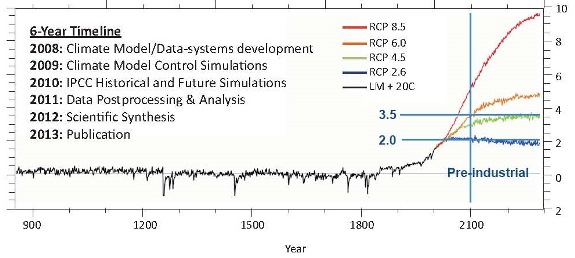
Figure 1. Six-Year Timeline. Simulatons Past, Present, Future Climate States.
Figure 2 summarizes these simulations for the IPCC AR4. Starting in 1870 the historical simulation is relatively stable until the eruption of Krakatau (1883) which causes significant global cooling for about fve years. During the historical period, the dark black line is the ensemble mean and the red margin is the ensemble variation. We had an eight-member ensemble jointly carried out by the United States and Japan. As the simulations progressed through the 20th century, the atmosphere slowly warms in the global warming signature emerges with the greatest warming at the poles. By the end of the 21st century, following the A1 B scenario, global warming is at 3.3°C, though in some areas it is as high as 7-8°C
While climate model simulations are typically undertaken up to the year 2100 to allow the relatively small global warming signal to emerge from the relatively large natural variability, most decision-makers are interested in chan-ges that will take place over the next 10 to 30 years. With so many ensemble members and climate modeling groups around the world participating in this unit process, it is possible to analyze changes in the climate means and extremes at shorter time periods that are more relevant to the decision scales. Changes in the several temperature – related indices over Central and South America. Heat waves have been shown to adversely impact agricultural production and excessive concurrent warm nights have been linked to increased human mortality due to heat stress.
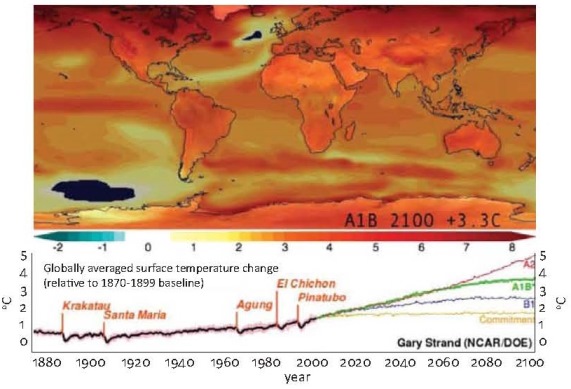
Figure 2. Surface Temperature Change Relatve to 1870-1899
In climate models, temperature is a relatively easy variable to simulate due to the advanced state of the thermodynamics and dynamic advection in these models. Other more complicated phenomena such as precipitation, which requires correctly simulating or parameterizing 4 to 5 complicated processes all at the same time and place, have proven to be more difficult to simulate accurately with a relatively spatial low resolution climate models. Consequently there is much less confdence in the precipitation simulated by climate models, and the results tend to be presented as broad climatic changes rather than specific changes to watersheds.
That said, the broad changes in future simulations can be summarized as an intensification of the hydrological cycle; when it is dryer, it gets dryer still, when is wetter, it gets wetter still, and their extremes are stronger.
With the release of the IPCC AR4, there was broad acceptance of the findings in industry government and the general public such that, almost overnight, the fundamental question that society asks of climate science drama-tically changed. Before 2007 (Climate 1.0), climate researchers focused on demonstrating that anthropogenic cli-mate change was occurring. The tools to do this were a classic low resolution climate models that have been developed over the last 40 years. After 2007, (Climate 2.0) the question became what is the impact of this expected climate change on the coupled human natural system. This is a much harder question to answer requiring dramatic improvements to the existing climate tools, new approaches priorities and capabilities in bringing new collaborations and partners to the climate research community. To address this, NCAR is developing climate models with much higher time, space and process resolution, sophisticated methods for downscaling the climate model data to scales more relevant to decision-making, and specialized regional models to address phenomenon such as hurricanes, hydrology, chemistry and cropping.
There is also a new emphasis on the integration of social science with physical science to address the problem of climate adaptation. Effectively interfacing across physical climate science, social science, and political science requires integrative frameworks such as shown in figure 3. In this example, to assess the potential impacts of extreme heat events, the external drivers (green), the dimensions of vulnerabi lity: exposure sensitivity and adaptive capacity (blue) and the societal adaptations and responses (orange), all must be evaluated to understand the final impact on human mortality and morbidity (red). And all of these occur under changing policies, governance, decisions and future scenario. If only the physical science aspects, such as the temperatures or physical location, are considered (red circle), there is insufficient information to understand the final impact in the absence of the social science information (yellow circle). Only when both the physical and social science dimensions of the problem are considered will it be possible to understand the final human impact.
To transition from the experimental climate research to actionable information for decision-making a more formal process for "climate services" is required. Climate services are defined as "The timely reduction and delivery of useful climate data information and knowledge to decisionmakers." The goal is to develop issued climate products and processes that allow planners to make climate informed infrastructure decisions and move on with their real job, and to also stay out of court. Considerable effort is being made internationally via the World Meteorological Organization Global Framework for Climate Services and the International Conference on Climate Services programs.
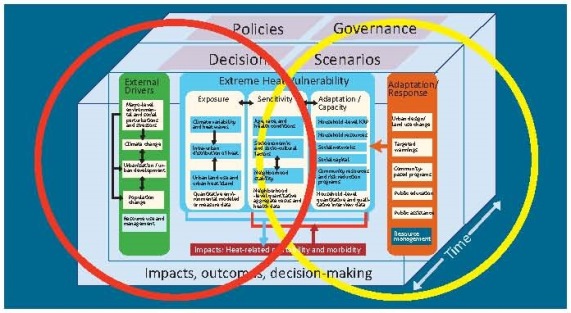
Figure 3. Quantifying Socetal Impacts to Climate and Weather Risk.
FOOTNOTES
*Este artículo es el resultado de la ponencia de Lawrence Buja presentada en el foro "Hidrología de extremos y cambio climático", que se llevó a cabo en la Universidad de los Andes el día 28 de junio de 2012.
