


Servicios Personalizados
Revista
Articulo
 Español (pdf)
 Articulo en XML
 Referencias del artículo
 Enviar articulo por email
Indicadores
-
 Citado por SciELO
 -
 Accesos
Links relacionados
-
 Citado por Google
 -
 Similares en
SciELO
Similares en
SciELO -
 Similares en Google
Compartir

 Permalink
Revista de Ingeniería
versión impresa ISSN 0121-4993
rev.ing. no.39 Bogotá jun./dic. 2013
Statistical Texture Model for mass Detection in Mammography
Modelo estadístico de textura para detección de masas en mamografía
Nicolás Gallego-Ortiz (1), David Fernández-Mc-Cann (2)
(1) Ms.C en Ingeniería. nicgallego@ieee.org
(2) Ph.D. en Telecomunicaciones. Profesor Asociado. Universidad de Antioquia. Medellín, Colombia. dfernan@udea.edu.co
Recibido 30 de noviembre de 2012. Modificado 17 de septiembre de 2013. Aprobado 18 de octubre de 2013.
Key words
Biomedical Engineering, Breast-Cancer, Mathematical , Models, Radiodiagnostic, Statistical Methods.
Abstract
In the context of image processing algorithms for mass detection in mammography, texture is a key feature to be used to distinguish abnormal tissue from normal tissue. Recently, a texture model based on a multivariate gaussian mixture was proposed, of which the parameters are lear-ned in an unsupervised way from the pixel intensities of images. The model produces images that are probabilistic maps of texture normality and it was proposed as a visua-lization aid for diagnostic by clinical experts. In this paper, the usability of the model is studied for automatic mass de-tection. A segmentation strategy is proposed and evaluated using 79 mammography cases.
Palabras clave
Ingeniería Biomédica, cáncer de seno, métodos estadísticos, modelos matemáticos, radiodiagnóstico.
Resumen
En el contexto de procesamiento de imágenes para detección de masas en mamografía, la textura es una característica clave para distinguir tejido anormal del normal. Recientemente un modelo de textura basado en mezcla de gaussianas multivariadas fue propuesto. El modelo produce imágenes que son mapas probabilísticos de la normalidad de la textura y fue propuesto como una ayuda de vi-sualización para diagnostico por médicos expertos. En este artículo la usabilidad de dicho modelo es estudiada para detección automática de masas. Una estrategia de segmentación es propuesta y evaluada en 79 casos de mamografía.
Introduction
Breast cáncer is currently the second most common cause of death among women after lung cáncer. Approximately one out of ten women can develop breast cáncer during their lifetime according to the American Cáncer Society (2012). Mammography is a powerful diagnostic tool for early detection, and Computer aided detection (CAD) systems for mammography have proven to be effective in facilitating early detection and diagnosis, a key factor improving patient prognosis and reducing mortality rates (Sampat, Markey & Bovik, 2004). There are two types of lesions associated to breast cáncer: masses and micro-calcifications (BIRADS-Committee, 2003). Detection of masses is still an open issue in research and more challenging problem than the detection of micro-calcifications (Oliver et al., 2010). The work of Sampat et al.(2004) and Olivier et al. (2010) presents a comprehensive survey.
Mammography with CAD is the most widely researched problem of diagnostic radiology (Yoon et al., 2007).
A large number of works addressed the problem of mass detection as a problem of texture analysis: Li et al. (1995), Mencat-tini et al. (2008), Haindl & Mikes (2008) to cite a few. An unsupervised scheme for mass segmentation has proven to be feasible and to have many advantages over supervised schemes due to great variability of normal tissue texture. Li et al. (1995) developed this approach based on a stochastic model for texture using Markov Random Fields (MRF).
The same idea of unsupervised texture analysis using local neighborhoods is found in Haindl et al. (2008). They pro-posed an automatic segmentation algorithm for fibrous glandular tissue of mammograms based on texture features from a MRF model and segmentation based on clustering in fea-ture space with a multivariate gaussian mixture model. Grim et al. (2009) proposed the use of log-likelihood images com-puted from a multivariate gaussian mixture model of gray levéis of local neighborhoods. They proposed log-likelihood images as a novel visualization tool for human interpreta-tion and discuss the properties of such statistical constructs for abnormality detection. The scope of their study did not include any automatic segmentation or classification stage.
As suggested by Grim et. al. (2009) the properties oí log-likelihood images íor mass detection are: (1) Masses should be mapped as regions that are darker than normal tissue on log-likelihood images. (2) Borders are enhanced by iso-countour-like Unes that the model produces on the regions oí transition between texture components. The properties are il-lustrated in a few cases and no detection strategy is proposed.
The scope oí this work is to test these two hypotheses on a larger population sample. Qualitative assessment is per-formed on log-likelihood images and a visualization strategy is proposed. As the model components and samples from both normal and abnormal tissue on the log- likelihood fea-ture space are projected via principal component analysis.
Materials and methods
The images used for this study were taken from the Digital Datábase for Screening Mammography (DDSM), mass sets BCRP_MASS_0 and BCRP_MASS_1 (Heath et al, 2001). These sets contain 39 and 40 cases respectively. Each case is called a MI field mammography case (4 images, left and right cranio-caudal CC and mediolateral oblique MLO). Each case contains a malignant mass visible in one or two images. In total there are: 79 cases, 316 images, out of which 160 have a visible mass. Ground truth mass contours are pro-vided with the datasets. The multivariate gaussian mixture model for abnormality-enhanced visualization was proposed by Grim et al. (2009).
This model captures normal patterns in each mammo-graphic case and enhances texture abnormalities based on gray level distribution of pixels within a local neighborhood.
Formally, let S be the set of all measurement vectors x formed by extracting the gray levels of N pixels of a local neighborhood as the center pixel iterates over each pixel of each image of case S = {x(1), x(2),... }, x(i)∈ RN , as illustrated in Figure 1 .
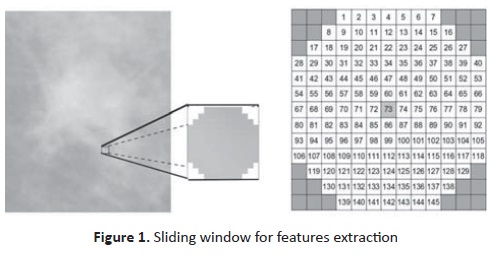
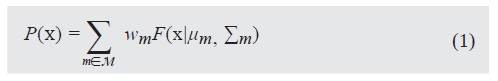
Image textures can be modeled with a multivariate gaussian mixture:
Where each wm is a mixture proportion satisfying wm ≥ 0 and Σ m∈M wm = 1. Each component F(x\ μm, Σm) is a multivariate gaussian with diagonal covariance matrix. The constraint on the covariance matrix is due to computational causes.
The model parameters θ = {w, μ, Σ} are estimated by the EM algorithm (Grim et al., 2009). An efcient implemen-tation may use lookup tables to save computation time and should prevent variable underflow (Gallego-Ortiz & Fernan-dez-Mc-Cann, 2011).
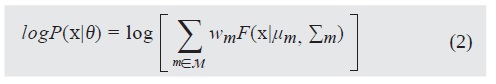
With the estimated model, log-likelihood images are com-puted over the original texture image at every pixel location as the logarithm of the probability in Equation ( 1 ), called likelihood when interpreted as a function of parameters θ.
For model selection, the number of components M = |M| and the size of the neighborhood JV is assessed by visual inspection of the characteristics of log-likelihood images produced with Equation (2), computed after model fitting for various M and N combinations.
As N is typically on the order of tens to hundreds, the model and samples can be projected to a lower dimensional space for visualization and characterization purposes. This is achieved using principal component analysis (PCA) of the data points x∈S and the mixture model as follows. Let C∈R NxN be the covariance matrix of dataset S. The eigen-analysis of C produces.
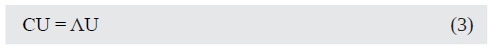
where Λ is the diagonal matrix with the eigenvalues in nonincreasing order and U is the matrix formed by the corre-sponding eigenvectors in its columns.
By using the first k ≤ N eigenvectors Ured , we obtain the desired projections z = UTred X.
The projection error, is calculated by reconstructing the original data points x from the projections z to get x' = Ured z. The average projection error is then given by e = 1/|S| Σx∈S(x - X')T (x - x'). The total variability is given by vt = 1/|S| Σx∈S XTX, so that the total variability conserved is v = 1-e/vt
Similarly, the model can be projected by μ'm = UTred μ and the component covariance matrices by the quadratic form, Σ'm = UTred Σ'm Ured for all components m=1,...,M.
Results
Model selection was performed by visual image evaluation for several configurations. A good compromise was obtained with images down-sampled at 200 um/pix, with M=36 components and N=69 variables. Segmentation of breast tissue was undertaken with a simplified model of M=3 and N=69.
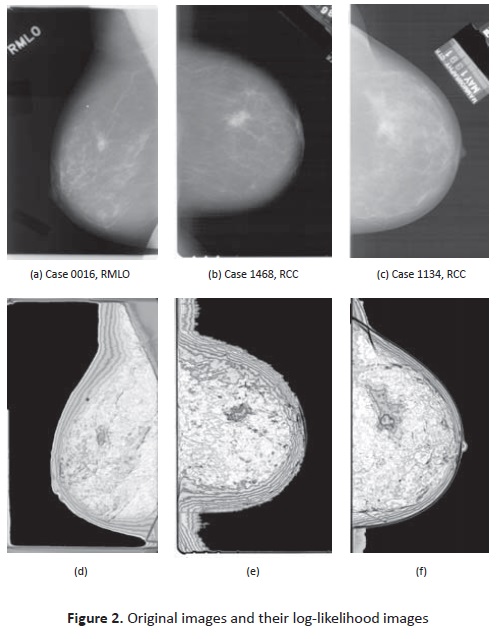
The model was estimated for each case, i.e. data of the four images. Then log-likelihood images are computed for each image with the estimated model parameters for the case. Figure 2 shows three images with masses, original and corres-ponding log-likelihood images.
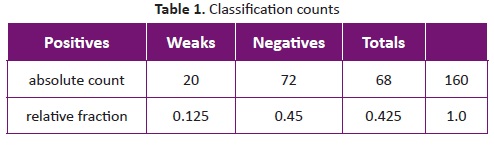
Three categories were defined after visual inspection of masses in log-likelihood images, according to the degree they support the mass hypothesis: Positive, Weak, Negative. For example in Figure2, case 0016 is a ‘positive' because the center of the mass is darker than the surrounding regions and there are contour lines. Cases 1468 and 1134 are ‘Weak' since even if there are contour lines, the mass center is not darker than the surrounding tissue. Under weak classification fall the images that have one of the properties but not both. Finally, negative cases are those that do not have any of the expected properties. Classification counts are summarized in Table 1. The weaker hypothesis among images was the darker seed over mass región.
To investígate the geometry of the feature space, PCA was used to project data and model as discussed. For this purpose a dataset of mass and normal tissue was selected from each case using ground truth data of the datábase.
Figure 3 summarizes the results of projecting the model along with the datasets to k=2 dimensions. The ratio of va-riability conserved in these projections are: 0.99879, 0.9985 and 0.9994 respectively.
Figure 3 depicts for each of the illustration cases: the pro-jected estimated model as contour lines and surfaces respectively and both normal tissue feature vectors as small dots and small triangles for mass tissue feature vectors over the contour lines plot, while only mass vectors are plotted on the log-likelihood surfaces.
Discussion
Log-likelihood images produced by the model were less discriminating than expected for the mass hypothesis. Only 57.5% of the mass image cases have a positive or weak degree of agreement. Weak images are mostly lacking dark cores for mass regions (first hypothesis). The performance of a detection algorithm searching for dark regions and some sort of concentric activity will present a similar performance.
Visualization of some typical cases evidences the fact that the texture representation obtained by taking the gray levéis of local neighborhoods in ráster order resides in regions very cióse to the hyper diagonal of the feature space, x1 = x2 = ... = xN . The distribution of examples in the bi-dimensional plots in Figure 3 are concentrated along the first principal component axis ul, the horizontal axis in these plots. The amount of variability conserved in this low dimensional projection is of 99 %, which suggests that the geometry of the high dimensional space is not very different.
Note also that, in general, the representation fails to discrimínate normal texture from abnormal texture because mass and normal feature vectors are closely interlaced or superimposed in the feature space. From the perspective of the model, sometimes the mass feature vectors may fall in model valleys, as evidenced in Figures 3a and 3b for Case 0016, but, in general, they fall in dense regions not always with low probability densities as in Figures 3c to 3e for cases 1468 and 1134.
Figure 3. PCA projections of labeled feature vectors and estimated model
The above information suggests that the local representation alone is not enough to discrimínate between mass and normal tissues. The absence of dark cores for masses can be explained by the fact that local texture representations of masses and dense normal tissue are very similar. To clas-sify them more precisely, a more sophisticated feature space should be studied, somehow including the multi-scalar as-pects of texture. For that purpose we believe that a combi-nation of both local and context features may improve the performance of an initial detection system based on texture analysis (Hupse & Karssemeijer, 2009). Conceptually this could extend this approach and is suggested as future work.
Conclusions
This study focused on the usability of a gaussian mixture model based on local neighborhood intensities íor automatic mass detection. It revealed that the mixture model is flexible enough to capture the complexity of normal tissue and to adapt, in an unsupervised fashion, to the distribution of each mammography case. However, the selected texture rep-resentation is not discriminating enough since in most cases normal and mass examples overlap.
The proposed framework provides a means to visualize re-sults from different texture representations by using projec-tion techniques. These visualizations provide insight into the feature space geometry and allow us to monitor the fitness of the model to the underlying distribution. Further investiga-tion is suggested in relation to these ideas.
Note: This project was financed by CODI (Comité para el Desarrollo de la Investigación de la Universidad de Antioquia).
References
American Cáncer Society. (2012). Cáncer facts & figures 2012. Atlanta: American Cáncer Society [ Links ]
BIRADS-Committee, A. (2003). Breast imaging and repor-ting data system-mammography (fourth ed.). Reston VA. [ Links ]
Gallego-Ortiz, N., & Fernandez-Mc-Cann, D. (2011). Effi-cient implementation of the em algorithm for mammo-graphic image texture analysis with multivariate gaussian mixtures. In Proceedings of the ieee workshop on statisti-cal signal processing (ssp2011) [ Links ]
Grim, J., Somol, R, Haindl, M., & Danés, J. (2009, april). Computer-aided evaluation of screening mammograms based on local texture models. Image Processing, IEEE Transactions on, 18 (4), 765-773. [ Links ]
Haindl, M., & Mikes, S. (2008, dea). Unsupervised mammograms segmentation. In 19th International Conference on Pattern Recognition. Conferencia llevada a cabo en ICPR, Tampa, Florida, USA. [ Links ]
Heath, M., Bowyer, K., Kopans, D., Moore, R., & Kegelme-yer, W. R (2001, june). The digital datábase for screening mammography. In Yale M. (Ed.), Proceedings of the üfth international workshop on digital mammography Toron-to, Canadá [ Links ].
Heath, M., Bowyer, K., Kopans, D., Moore, R., Kegelmeyer, W.R The Digital Datábase for Screening Mammography. In Proceedings of the Fifth International Workshop on Digital Mammography, 2000; Medical Physics Publis-hing: Madison, WI, USA, pp. 212-218. [ Links ]
Hupse, R., & Karssemeijer, N. (2009). Use of normal tissue context in computer-aided detection of masses in mammograms. Medical Imaging, IEEE Transactions on, 28 (12), 2033 -2041. [ Links ]
Li, H. D., Kallergi, M., Clarke, L. R, Jain, V. K., & Clark, R. A. (1995). Markov random field for tumor detection in digital mammography. IEEE Transactions on Medical Imaging, 14 (3), 565-576. [ Links ]
Mencattini, A., Salmeri, M., Lojacono, R., Frigerio, M., & Caselli, F (2008). Mammographic images enhancement and denoising for breast cáncer detection using dyadic wavelet processing. IEEE Transactions on Instrumenta-tion and Measurement, 57 (7), 1422-1430. [ Links ]
Oliver, A., Freixenet, J., Martí, J., Pérez, E., Pont, J., Dentón, E. R., & Zwiggelaar, R. (2010). A review of automatic mass detection and segmentation in mammographic images. Medical Image Analysis, 14 (2), 87-110. [ Links ]
Sampat, M. R, Markey, M. K., & Bovik, A. C. (2004). Hand-book of image and video processing. In (pp. 1159-1217). Elsevier Academic Press. [ Links ]
Yoon, H. J., Zheng, B., Sahiner, B., & Chakraborty, D. P. (2007). Evaluating computer-aided detection algorithms. Med Phys, 34(6), 2024-38. Retrieved from http://ncbi.nlm.nih.gov/pubmed/17654906 [ Links ]
