


Serviços Personalizados
Journal
Artigo
 Espanhol (pdf)
 Artigo em XML
 Referências do artigo
 Enviar este artigo por email
Indicadores
-
 Citado por SciELO
 -
 Acessos
Links relacionados
-
 Citado por Google
 -
 Similares em
SciELO
Similares em
SciELO -
 Similares em Google
Compartilhar

 Permalink
Revista de Ingeniería
versão impressa ISSN 0121-4993
rev.ing. no.40 Bogotá jan./jun. 2014
A discrete Model of TransMilenio Station Occupation: Representation and algorithms
Consideraciones algorítmicas para un modelo discreto de la ocupación en estaciones de TransMilenio
Sergio A. Rojas-Galeano(1)*, Camilo Alfonso Rodríguez Garzón(2)*
(1) Ph.D in Computer Science, Associate Professor. srojas@udistrital.edu.co.
(2) Computer Engineer. camilo.18.20@gmail.com
* Universidad Distrital Francisco José de Caldas. Bogotá, Colombia.
Received May 21st, 2014. Modified July 8th, 2014. Approved July 11th, 2014.
Key words
Bus rapid transit station modelling, cellular automata.
Abstract
The current demand of Bogota's BRT system (TransMilenio) is causing critical overcrowding throughout the system, particularly in bus stations. The behaviour of individual passengers in such stations is simplistic, yet the resulting crowd dynamics are complex, as the majority of regular users of the system may attest. Discrete models such as cellular automata have proved helpful in simulating simplistic-local vs. complex-global behaviour in similar contexts. Thus, the aim of this study is to characterise a cellular automata model of a TransMilenio station that may serve as a tool to help us better understanding these dynamics, and also as a test-bed for the proposal of mitigation strategies. The paper describes representations and algorithmic aspects of the model and presents preliminary simulations that demonstrate the feasibility of the discussed considerations.
Palabras clave
Modelamiento de sistemas de transporte masivo, autómatas celulares.
Resumen
Debido a la creciente demanda de pasajeros en el sistema de transporte masivo TransMilenio en Bogotá, los problemas de congestionamiento se hacen cada vez más evidentes, particularmente, en las estaciones de buses. A pesar de que el comportamiento individual de los pasajeros en la estación es relativamente simple, el fenómeno que surge en la multitud se podría calificar de complejo, como lo pueden atestiguar la mayoría de sus usuarios. Esta característica de comportamientos globales complejos debidos a la interacción local entre múltiples agentes, ha sido analizada con modelos discretos como los autómatas celulares. En este estudio se parte de esta premisa, con el objetivo de caracterizar un modelo de autómata celular para simular el comportamiento de una estación típica del sistema TransMilenio. Se espera que modelos como este puedan convertirse en herramientas útiles para un mejor entendimiento de estas dinámicas, que eventualmente conlleven al planteamiento de estrategias de disminución de la congestión. En el artículo se describen los aspectos algorítmicos y de representación requeridos por el modelo; se complementa con la presentación de resultados preliminares que comprueban la fac-tibilidad del modelo y con algunas ideas de trabajo futuro.
1. Introduction
Recent statistics show that Bogota's Bus Rapid Transit (BRT) system, TransMilenio (TM), is transporting nearly 2 million passengers daily1 as of 2013. This level of demand is causing overflow of the capacity of the system at different levels: buses, bus lanes, bus stations, ticket booths (Velasquez et al., 2013). We are concerned particularly with the problem of station overcrowding, as we believe that this is a major cause of passenger dissatisfaction. Simulation models accounting for the wide range of variables involved in the problem, may help traffic engineers to better understanding the causes and effects of the phenomena in order to design effective alleviating strategies.
This study focuses on discrete models where the station is considered a system of multiple agents moving on the basis of a simple schedule of states (boarding, walking, waiting, departing, etc.) and transitions (move forward, step aside, change gate, etc.). Such models are known as cellular automaton (CA), see e.g. Toffoli & Margolus (1987). CA systems have proven to be helpful in the analysis of similar pedestrian-like environments over the last decade (Maerivoet & De Moor, 2005; Kirchner & Schadschneider, 2002; Was, 2005; Guo & Huang, 2012), including evacuation models in crowded BRT stations (Ji-hua et al., 2013). The aim of this study is to characterise the representations and algorithms needed to simulate a CA model for a TM station. Our characterisation differs from recently reported approaches using multi-agent systems (Aricapa et al., 2010; Oszerowicz, 2012), in that the rules we define to control the state of the agents are local and simplistic; furthermore, we also propose a new asynchronic strategy to resolve conflicts of movement. The paper discusses the assumptions made regarding station layout and bus and passenger traffic dynamics, and the representations and algorithms embodied in CA itself. Preliminary simulations are reported indicating model feasibility.
2. Model characterisation
2.1. Station
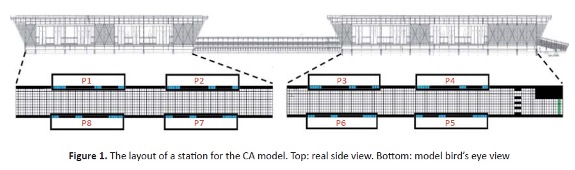
A generic TM station consist of a platform connecting a number of wagons with parking bays for bus docking, and access corridors on ground level at the endpoints of the platform. Based on this layout of a real TM station, we made the following assumptions: (i) a wagon has three gates on each side, allowing for passengers to board and alight the bus; (ii) one side of the wagon serves bus traffic on the way forward, and the opposite side on the way back; (iii) access corridors are equipped with a ticket booth and three turnstiles that admit passengers once they scan their tickets. Such a generic layout is shown in Figure 1, consisting of one access corridor and two wagons connected with a walkway. The station is modelled as a discrete grid of cells, where each cell can be empty or occupied by only one passenger. The layout accounts for eight stops, four per wagon, each one fitted with three gates (blue cells) that open when a bus arrives and close when a bus departs. Besides, the access corridor contains blocks of cells representing the ticket booth and turnstiles (black cells). The walls, booth and turnstiles serve as station boundary conditions (or obstacles) whose cells cannot be occupied by passengers.
2.2. BUSES
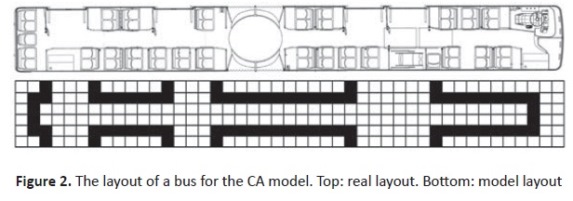
Buses are modelled as a grid of cells with the layout and boundary conditions shown in Figure 2. We assume that the buses arrive regularly and dock at the station for passengers to alight and board. Buses are identified with up to 3 routes per stop, yielding up to 24 routes stopping at the station. Again, these assumptions are in accordance with the real TM buses. The arrival of buses is modelled as a Poisson process with parameter λbij , which indicates the average number of buses on route j arriving per hour at stop Eight queues are defined to accommodate buses arriving simultaneously to the same stop i Passenger load of the bus and amount of passengers alighting is randomly determined when the bus arrives at the station.
2.3. Passengers
Passengers are modelled as agents moving across the station grid in discrete steps. We assume that prior to entering the station, the passenger knows what bus route and gate he is aiming for. So, when a new passenger is created, this information is randomly assigned in advance. Similarly to the arrival of buses, the admission of new passengers to the station is modelled as a Poisson process with parameter λbij , which indicates the average number of passengers arriving per hour at the station entering by corridor lane Six queues (one per lane) are defined for passenger arrivals.
2.4. Cellular automaton
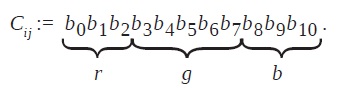
The CA is modelled as a 2D grid of cells representing the station and parking bays (see Figure 1). The grid is stored in a 32 x 307 integer matrix {Cij}. Each cell accounts for a 0.4m x 0.4m space region in the station that can be occupied by a passenger, or that can be empty. When occupied, the actual state Cij := {r, g, b} of a cell consists of the values of the route r, gate g and orientation bias b of the passenger. The attribute r ∈ {1, 2, 3} indicates the routes stopping at gate g, otherwise r ∈ {4, 5} if the passenger is exiting the station or riding a bus. Attribute g ∈ {1, ... , 26} denotes the gate numbering in the station, with values 25 and 26 representing the exit gates.
The values of  correspond to passengers heading north, south, east, west, stand still heading north, stand still heading south or not alighting, respectively. The state is codified as an 11-bit binary code representing the attributes r, g and b:
The rules controlling the state transitions of a cell are defined with respect to a standard Moore-neighbourhood (a central cell C surrounded by the array of cells {NW, N, NE, W, E, SW, S, SE}). Eight stochastic rules were defined (see Table 1). The rules were designed so as to mimic the standard behaviour of a TM station occupant, as we shall explain next. A passenger either aims to get to a gate where a bus on his intended route stops, or to get to the exit if alighting; according to this, the agent attempts to move forward in its orientation (R1), or to side-step if it encounters an obstacle (R2to R5). A couple of rules conform to the situation where a passenger with a front line blocked by fellow passengers is allowed to "jump" the queue (R7 and R8 ). Finally, a set of probability parameters P = {p1, ...,p6,p71, ...,p76, p81, ..., p86} determines whether the agent chooses or not to apply the transition or whether it chooses one of the transitions in rules with many options. It is worth noting that rules should be interpreted according to the orientation of the agent. A visual depiction of a number of them is shown in Figure 3.
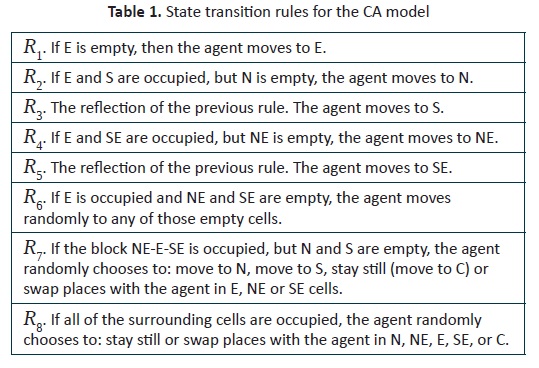
Figure 3. CA state transition rules.
The opening hours of the TM station during of a weekday were divided into 5 time windows (see Table 2), namely the morning and evening peak hours, and the off–peak hours in–between, spanning a range of 18 hours totalling 64800 seconds. The time unit for the simulation was defined as one second per iteration.
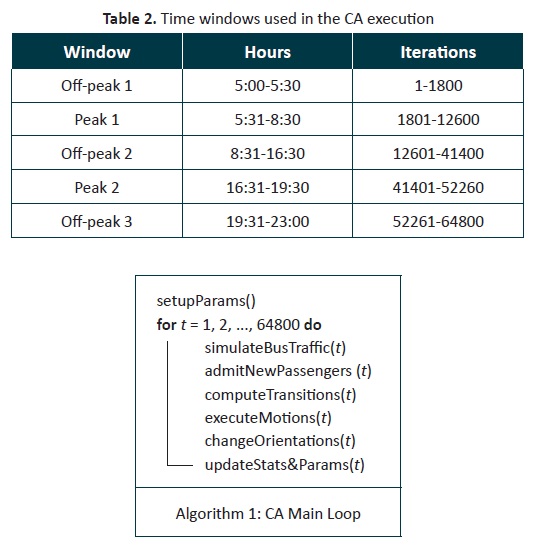
2.5.1. Main loop
The main loop iterates through the opening hours. At each iteration, the routines shown in Algorithm 1) are executed. The initialisation of the running parameters ({λbij}, {λpi}, P) is carried out in the routine setupParams(). High-level specifications of the remaining algorithms designed for each routine are discussed below.
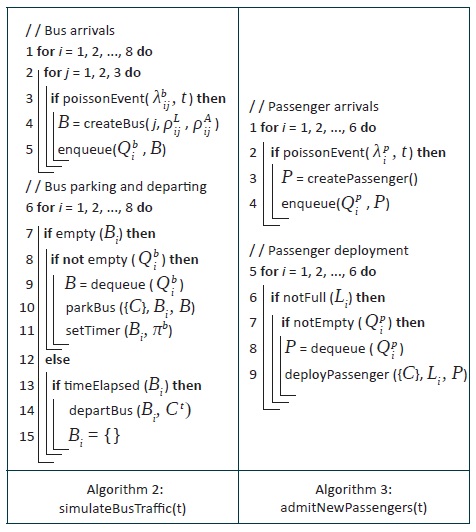
2.5.2 Simulation of bus traffic and passenger arrivals
Algorithm 2) controls the dynamics of bus traffic for the simulation. The first block of the algorithm simulates the arrival of buses. Buses arrive at any of the 8 stops; the predicate poissonEvent(-) defines whether a new bus for stop i and route j arrives at iteration t (unless λbij is zero). If so, a new bus is created and inserted in the corresponding queue with attributes such as route number, passenger load and the proportion of passengers alighting, indicated by the parameters p Lij and p Aij.
The second block of the algorithm simulates the parking and departure of buses. Parking is allowed for buses in the queues if their corresponding parking bays Biare empty. The parking manoeuvre is executed by the parkBus(-) subroutine, which updates the corresponding cells in C with the attributes of the dequeued bus B; a timer is also initialised with a value πb, the number of iterations that the bus will remain parked at the station. When the timer elapses for any buses parked in the bays Bi, the corresponding bus is cleared from C, leaving its bay empty.
The admission of new passengers arriving at the station is simulated through Algorithm 3). Similarly to the arrival of buses, these algorithm controls the generation of passengers following a Poisson process, insertion in the corresponding queues, and deployment on the cell grid C. The main difference is that the CA allocates 6 passenger corridors (Li). The length of these corridors allocates 18 spaces for visual deployment of new passengers. For higher demands passengers are kept in the queues Q piuntil room is available to be deployed in the grid. Notice that the createPassenger() predicate should randomly assign the attributes r, g, b for the new passenger.
2.5.3 CA state transitions
Algorithm 4 performs the evaluation of transition rules for each cell in the grid. Passengers are allowed to attempt to move to a cell by taking a gamble for the new location, depending on its current state and neighbourhood. Each entry (i' , j') in the object matrix D, keeps the gambles taken from all passengers attempting to move, precisely, to location (i' , j').
The evaluation of the matching rule firstly executes Nij= getNeighbours (i' , j'), which returns a binary string with the configuration of the cell neighbourhood reading row-wise from top (1: occupied cell, 0: empty cell). Similarly, the predicate Rk│ bij returns the conditional binary string representation of rule K with respect to passenger orientation, according to Figure 3. For example, R1 │ ▷ = {**** 10 ***}, where * denotes an occupation wildcard. In this way, the switch predicate simply performs a wildcard string, matching operation in order to decide the applicable case; then a transition is chosen with the predicate randCell(• • •) depending on orientation bijand a probability p obtained uniformly at random.
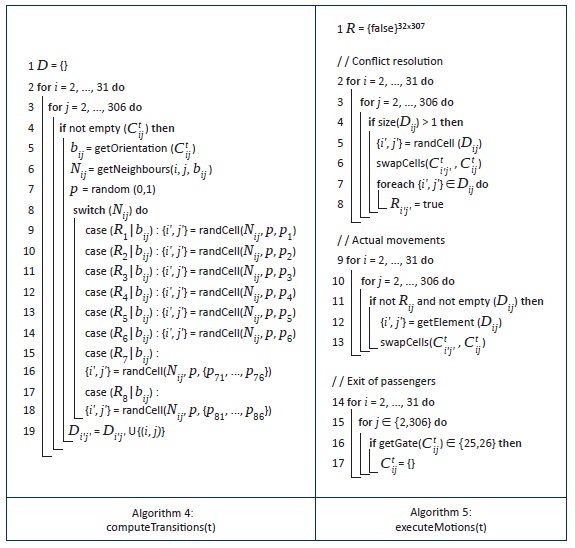
2.5.4. Passenger motion and conflict resolution
This is perhaps the most interesting routine of the simulation and is shown in Algorithm 5. It is divided into three blocks: one for bet conflict resolution, one to execute the actual movements, and one accounting for the departure of passengers from the station. The idea behind the first block is to resolve conflicts of different agents betting to move to the same location. The resolution policy follows the assumption that a cell can be occupied by only one agent at any time. Therefore, when multiple bets are in D ij, the algorithm chooses one at random (the winner), and rejects the other ones. Rejections from the other source locations are kept in a matrix {R ij}. The winning cell is allowed to move (movement is performed with the routine swapCells(-), which swaps the states of the cell arguments and also re-orients the agents if necessary; i.e., if they get to their target region of interest). On the other hand, the second block performs the movement of the other agents different from the winners of the previous block. The new assignments are made only for those cells that were not rejected and that hold at least one movement bet. The last block clears grid cells holding exiting agents reaching the station endpoints (gates 25 or 26, at columns 2 or 306 in the grid).
3. Computer simulation
An implementation of the proposed model was carried out using Matlab® vR2012b. Fieldwork in a real TM station was performed to estimate the values of the running parameters. For illustration purposes, snapshots of the simulation execution and collected statistics are shown in Figure 4. The snapshots were taken in the middle of peak times (t = 7200 and t = 46830). Passengers are identified according to their gate destination and route with different symbols (□, ο, ◊, x); buses and boundary conditions are displayed in black. Two congestion situations reminiscent of the real system can be recognized here. The first one represents bottlenecks emerging at the exit corridor on both sides of the turnstiles during different rush hours (right-hand side of Fig. (4a) and (b). The second one represents passenger "bubbles" growing at the gates of the express routes (left-hand side of Fig. 4(b), which are due to the large demand produced by passengers on their way back home; i.e., evening rush hour. Statistics of overall passenger occupation are summarised in Fig. 4(c), which shows the total amount of passengers vs. time. The two peaks visible within the time windows, marked within vertical bars, effectively correspond to the morning and evening rush hours. The second peak to the left is an indication of overcrowding phenomena.
Figure 4. CA model simularon results. (a)-(b) Simularon canvas snapshots. (c) Occupation vs. time plot.
4. Conclusion
We have characterised algorithms and representations for a discrete model of occupation dynamics in a TM station. Preliminary simulations of the model indicate its feasibility, since many realistic behaviours such as line-formation, exit bottlenecks and massive agglomerations were identified. The model is generic enough to account for different station configurations, regarding, for example, bus scheduling, demand variability or passenger action preferences. Thus, it may be helpful in finding the factors involved in crowd formation in the real system, and in understanding its hidden complexities. The possibility of adjusting these parameters and evaluate emerging behaviours may prove useful in testing strategies that may or may not contribute to alleviate the problem. Our current work is precisely focused on the latter; our goal is to hopefully typify parameter configurations leading to a reduction of the levels of overcrowding currently upsetting TM stations users.
1 http://www.transmilenio.gov.co/es/articulos/informe-de-gestion-2013 (last retrieved: May 15, 2014).
References
Aricapa, A., Beltrán, D., Devia, A., Moreno, D., Pérez, M., & Rodriguez, C. (2010). Modelado de la dinámica de ingreso y salida a los buses articulados del sistema TransMilenio. Technical report, Universidad Nacional. [ Links ]
Guo, R.-Y. & Huang, H.-J. (2012). Formulation of pedestrian movement in microscopic models with continuous space representation. Transportation Research Part C: Emerging Technologies, 24, 50-61. [ Links ]
Ji-hua, H., Cheng-zhi, Z., Zhi-feng, C. & Bo, W. (2013). A research of pedestrian evacuation simulation for BRT station based on fine grid method. Procedia Engineering, 52, 137-144. [ Links ]
Kirchner, A. & Schadschneider, A. (2002). Simulation of evacuation processes using a bionics-inspired cellular automaton model for pedestrian dynamics. Physica A: Statistical Mechanics and its Applications, 312 (1-2), 260-276. [ Links ]
Maerivoet, S. & De Moor, B. (2005). Cellular automata models of road traffic. Physics Reports, 419 (1), 1-164. [ Links ]
Oszerowicz, J. (2012). Un modelo de simulación multiagente del comportamiento de los usuarios al abordar el bus de Transmilenio en una estación tipo portal. (Tesis de pregrado). Universidad de los Andes, Bogotá [ Links ].
Toffoli, T. & Margolus, N. (1987). Cellular Automata Machines: A New Environment for Modeling. The MIT Press. [ Links ]
Velasquez, J., Bocarejo, J., Diaz, C., & Tafur, L. (2013). Impact of bus rapid transit systems on road safety: Lessons from Bogotá, Colombia. Transportation Research Record, 2317, 1-7. [ Links ]
Was, J. (2005, September). Cellular automata model of pedestrian dynamics for normal and evacuation conditions. In Intelligent Systems Design and Applications, 2005. ISDA'05. Proceedings. 5th International Conference on (pp. 154-159). IEEE. [ Links ]
