


Services on Demand
Journal
Article
 English (pdf)
 Article in xml format
 Article references
 Send this article by e-mail
Indicators
-
 Cited by SciELO
 -
 Access statistics
Related links
-
 Cited by Google
 -
 Similars in
SciELO
Similars in
SciELO -
 Similars in Google
Share

 Permalink
Revista de Ingeniería
Print version ISSN 0121-4993
rev.ing. no.42 Bogotá Jan./June 2015
https://doi.org/10.16924/riua.v0i42.40
Gas Leak Inspection Using Thermal, Visual and Depth Images and a Depth-Enhanced Gas Detection Strategy
Inspección de fugas de gas basada en imágenes termográficas, visuales y de profundidad y una estrategia de detección mejorada por profundidad
Johannes Rangel Julian Garzón (2), Jorge Sofrony (3), Andreas Kroll (4)
(1)Mechatronics Engineer. Universidad Nacional de Colombia. Bogota, Colombia. johanneshavid@gmail.com
(2)Mechatronics Engineer. Universidad Nacional de Colombia. Bogota, Colombia. jagarzonma@unal.edu.co
(3)PhD in Control Systems, University of Leicester. Associate Professor, Faculty of Engineering, Universidad Nacional de Colombia. Bogota, Colombia. jsofronye@unal.edu.co
(4)PhD in Measurement and Control Engineering, Universität Duisburg. Professor, Department of Mechanical Engineering, University of Kassel, Germany. andreas.kroll@mrt.uni-kassel.de
Received February 25th, 2013. Modified March 10th, 2015. Approved April 8th, 2015.
DOI: http://dx.doi.org/10.16924/riua.v0i42.40
Key words
Gas leak detection, thermography, image registration, mutual information, RBI, spectral absorption.
Abstract
Advanced gas leak detection methods in industrial environments are of vital importance as they may translate into a reduction of accidents and increased economic efficiency. This paper proposes the use of different sensors for detecting and localizing leakages remotely, based on the measurement of variables involved when a leak is present. The processing and fusing of thermal, depth and visual images, as well as gas concentration scanning technique, is the proposed method in this article.
Palabras clave
Detección de fugas de gas, termografía, registro de imágenes, transinformación, inspección basada en riesgo, absorción de espectro.
Resumen
La detección de fugas de gas en ambientes industriales significa la disminución de accidentes y la eficiencia económica. En este trabajo se propone la utilización de sensores para la detección y la localización de dichas fugas de manera remota, basadas en la medición de las variables que juegan un rol en presencia de ellas. El procesamiento y la fusión de imágenes termográficas, de profundidad y visuales, así como el escaneo de concentraciones de gas son los dos métodos que se pretenden integrar.
Introduction
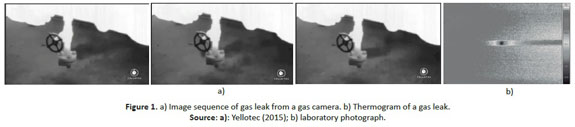
Inspection tasks in industrial environments prevent situations of human, environmental and economic risk. Gas leaks are a common failure in such environments. For this reason strategies are required to detect and localize them. It is therefore important to analyze measurements taken in proximity to leaks that may have occurred. Variables including temperature, pressure conditions, gas concentrations and audio noise may be considered in such an exercise; there is therefore no unique approach to dealing with the challenge. Two methods are considered in this work: gas-based detection supported by thermal-based inspection. The use of thermographic cameras in gas inspections has been gaining attention in recent years as the technology permits gas leaks to be detected remotely and without complicated measurement setups. Thermographic cameras may be classified according to the spectral range in which they work. Cameras working in the 3 to 5 μm wavelength range, also called gas cameras, are particularly useful in visualizing Volatile organic compound -or VOC- gases because these gases absorb more infrared energy in this particular range (see Figure 1a ). Thermal cameras working in the 7 to 14 μm wavelength range from (also called long wave thermographic cameras), are principally used to measure the temperature of opaque objects. Although gas cameras are the more suitable of the two for gas detection, their use in automatic gas inspection systems is still limited due to the complex processing that is required of the thermal images they produce (Soldan & Kroll, 2013) and their high cost.
However, long wave thermographic cameras are also used to support gas inspection tasks. The underlying principle involved in a gas leak takes into account that gas escaping from pressurized equipment into the atmosphere expands and therefore cools down (see Figure 1b ). Using certain image segmentation techniques these cameras can be used to detect the resulting (temperature) disturbance of the surface temperature field of equipment (Kroll, Baetz, & Peretzki, 2009). In many cases, thermographic measurements alone do not supply enough information to separate the regions of interest from the background. The fusion of thermograms with data from additional sensors generates a possibility of resolving this problem, as more information about the features may be extracted, giving desired and significant information from the captured scenes.
Infra-red-optical systems can also be used to detect gas. Depending on the optical configuration (short or long path, one or two path, diffuse background reflection or retro-re-flector) these can detect the plume locally or remotely at a distance of up to 1,000m (Baetz, Kroll, & Bonow, 2009). Improvements in inspection strategies using these kinds of devices can be achieved by using dimensional information on the environment. Thus, depth information captured with a laser time-of-flight measurement device can be processed to identify regions of interest. A Risk Based Inspection (RBI)-like approach is considered at the point when the scan paths are generated.
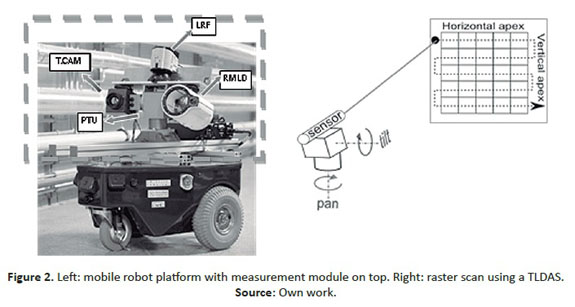
The strategy for a gas detection scheme proposed in this paper involves using gas concentration information and thermal images from a long wave thermal camera, fused with visual and depth data; it uses a digital 2-D map of an inspected industrial plant for navigation purposes. The map stores the coordinates of the inspection points, along with additional information concerning the orientation of the scanned areas. A mobile robot platform with a measurement module on the top (see Figure 2 , left) navigates to each one of the inspection points and performs a thermographic-visual-depth measurement and takes a sequence of readings of gas concentration levels using a Tunable Diode Laser Absorption Spectroscopy (TLDAS)-based sensor along a raster scanning path (see Figure 2 , right).
This paper describes the fusion of thermograms with visual and depth data along with independent gas concentration scans. Subsequently, a possible strategy to integrate these techniques is proposed, which has potential to be used to detect and localize gas leaks in industrial environments.
Fusing thermal with visual and depth images
The proposed arrangement of sensors for achieving thermal, visual and depth information is based on a long wave thermal camera (Optris PI450 Infrared Camera - see references) with an image resolution of 382x288 pixels and an RGB-D camera (Asus Xtion PRO LIVE - see references) which sends visual and depth images with a resolution of 640x480 pixels (see Figure 3a). The two sensors were rigidly attached in order to carry out an extrinsic calibration between both, i.e. finding the spatial relationship between the coordinate systems of both cameras. This spatial relationship is often represented as a transformation matrix composed of a rotation matrix and a translation vector.
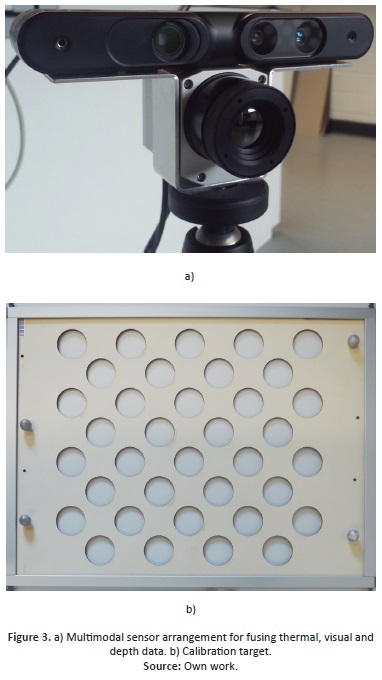
In order to carry out the extrinsic calibration of the system a calibration target was used (see Figure 3b). At an initial stage each camera was calibrated intrinsically (Zhang, 2000) i.e. by finding the parameters (camera matrix and distortion coefficients) that describe the way they map 3D objects onto an image plane. Subsequently, the extrinsic calibration was performed. The extrinsic parameters obtained allowed the visual and thermal images to be rectified for later processing and the depth and thermal data to be fused directly (Rangel, Soldan, & Kroll, 2014). In the following sections the approaches for fusing visual and depth data with thermal data are discussed.
Fusing Thermal and Visual Images
The fusion of thermograms from a long wave thermographic camera with data from a visual camera may be achieved using the Mutual Information (MI) technique, which consists of a similarity measure that defines the level of correlation between two images, based on the intensity values for each one. If two images are aligned, MI reaches its maximum value. This approach has provided good results in multimodal image registration (Zitova & Flusser, 2003). However, there are some constraints that should be taken into account when using MI-based methods, as they produce good results when the statistical correlation between the images is global, but this condition is not usually fulfilled, and most multimodal image pairs only achieve local statistical correlation. With this in mind, some extensions of MI-based methods have been advanced by Guan (2010), Jiang and Zhang (2010), Kim, Lee and Ra, (2005) and Zhang, Men, Liu and Yang (2010).
The method proposed in this article (see Figure 4) is based on mutual information, edge detection and image separation. Firstly, the images were filtered using a Gaussian filter in order to reduce the noise in the images, using a kernel of 9x9 and o (standard deviation) of 1.85. Then, a canny edge detector was used on both images in order to produce two edge images that showed the important salient edges. Next, region separation was carried out, the main goal being to constrain MI optimization functions to gray values that are in the neighborhood of edges.
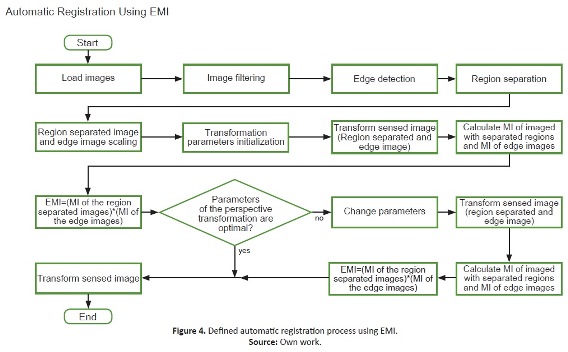
This approach was also used by Kim, Lee and Ra (2005) in order to enhance the performance of the mutual information method. The scale of edge images and region-separated images was reduced in order to increase the speed of the algorithm. The optimization function, based on Powell's method (Wikipedia, 2011), had as inputs the values of the parameters of a perspective transformation (rotation, translation and scaling) and yielded the product between the mutual information of the region-separated images and the edge images. This procedure explains why the strategy is known as Edge-Based Mutual Information, or EMI (Guan, 2010). In each iteration of the optimization process, one of the two images to be registered remains unchanged while the other is transformed with regards to the rotation, translation and scaling parameters.
Fusing Thermal and Depth Images
As was mentioned above, the extrinsic parameters of the system obtained from a previous calibration step are presented in a transformation matrix that represents the spatial relation-ship between the coordinate systems of both cameras (see Figure 5).
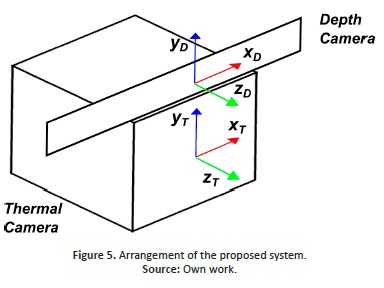
Using this transformation matrix, a 3D point p in the coordinate system of one of the cameras can be transformed into the coordinate system of the other one. This means that pixels from one camera image can be mapped to another camera image, since the depth (spatial) information of the scene is known. With the matrix T of extrinsic parameters nd the intrinsic parameters of both cameras, a point [uD,vD]T from the depth camera image can be mapped onto the thermal image ([uT,vT]T ) using the following equations:
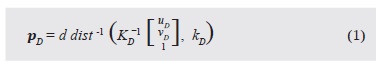
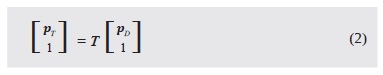
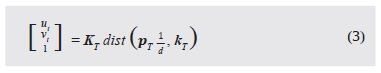
where pD is a 3D point on the depth camera's coordinate system, d the depth information from the depth image, dist the distortion model of the camera described in Rangel, Soldan and Kroll (2014), KD the depth camera matrix, KD the distortion coefficients of the depth camera, pT a 3D point on the thermal camera's coordinate system, KT the thermal camera matrix and KT the distortion coefficients of the thermal camera.
Results
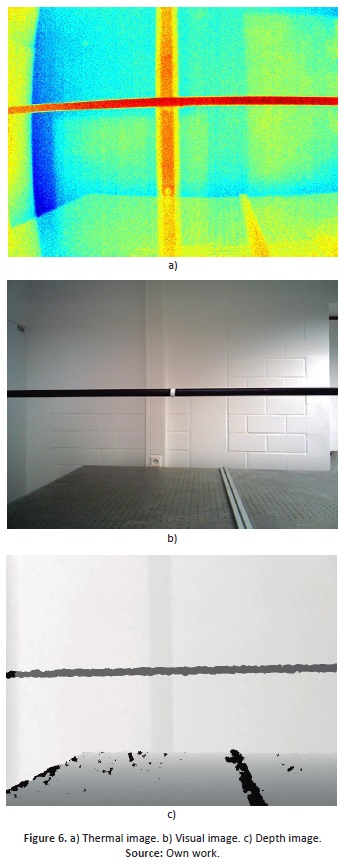
The performance of the proposed approaches was tested by taking thermal, visual and depth images of a pipe under lab conditions (see Figure 6).
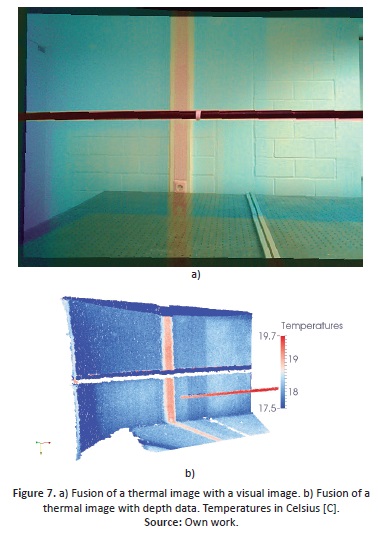
The results show that the algorithm for fusing visual and thermal images (see Figure 7a) is robust but sensitive to changes in the contrast of the thermograms (i.e. the temperature range used in the thermogram is important and not unique). Performance is also affected by the selection of initial parameters of the optimization function. Since an optimization algorithm sensitive to local maxima was used, the selection of the initial parameters was very important, because when dealing with multimodal images, the MI function presents many local maxima. It should be noted that the convergence speed of this approach is low due to two factors: the number of parameters that define the transformation matrix and the resolution of the images.
For outdoor applications where there is no prior knowledge about the environment, light condition changes and there are significant differences between the objects in the scene and the distance between the objects and the sensors, more robust methods must be developed. Good registration may occur when the temperature difference between the principal objects and their surroundings is not too significant or when the light conditions do not change drastically.
On the other hand, the fusion of depth and thermal images (see Figure 7b) depends on the accuracy of the (intrinsic and extrinsic) geometric calibration process. It has been shown that a registration error of less than a pixel can be achieved.
Gas detection strategy using concentration sensors
RBI is suitable for gas detection tasks. The methodology allows a shift of inspection and maintenance resources to provide a higher level of coverage of high-risk equipment, and an appropriate focus of effort on lower risk equipment. It classifies static equipment (piping systems, vessels and tanks) according to high, medium and low levels of risk (Ramesh, 2005).
A common technique for gas detection in industrial environments is Tunable Diode Laser Absorption Spectroscopy, TDLAS (Hermann Sewerin GmBH., 2005). Absorption spectroscopy is a technique used to measure the amount of light absorbed by a target gas at a specific wavelength (SpectraSensors Inc., 2011). The gas detection procedure proposed here is an alternative to the standard raster scan strategy (Yellotec, 2015). It applies an RBI-like approach, which processes the depth information that has been captured to identify and label regions with different risk levels. The regions are grouped in a layered frame (see Figure 8a), which is then merged to define the regions of interest and to calculate the scanning path (see Figure 8b).
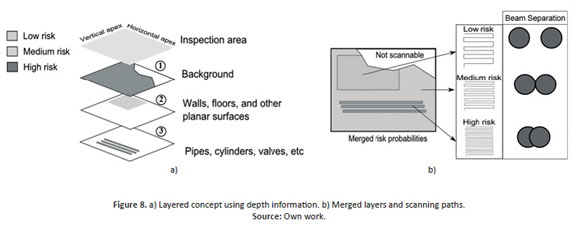
In the layered concept, risks are assigned as follows: low risk for planar surfaces, medium risk for unknown regions and high risk for objects containing gas. The probabilities associated with each risk level are assumed, not calculated. The first region defining the range of the inspection device is filtered by applying thresholding (layer 1); the remaining areas are segmented using planar and cylindrical segmentation (layers 2 and 3).
The layers are then merged, bearing in mind the probabilities associated with the risk level for each region. The resulting data defines the contour and the velocity of scan in the identified regions. As shown in Figure 8b the separation of the laser beams for gas concentration measurements is correlated to the risk level assigned each region. In contrast with the standard raster inspection strategy, the proposed approach is, then, based on regional risk-based raster scans.
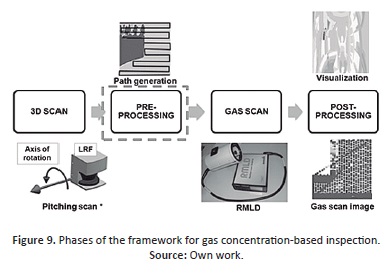
The framework used for testing the strategy had four independent phases (see Figure 9): first, a 3D scan was performed in order to obtain the depth data; second, the segmentation filters were applied to the Point Cloud Data and an RBI model was used to identify regions and generate the scanning path; third, the scan was performed, using a methane-gas concentration sensor; finally, the results of the scan were processed for visualization purposes.
Results
The existing raster scan and the proposed strategy were tested and compared. The test stand used for the validation of the proposed strategy for gas leaks detection consists in two sensors mounted over a mechanical actuator as shown in Figure 3a).
A Laser Range Finder (LRF) was used to obtain depth information of the environment, while a Remote Gas Leak Detector (RMLD) measures methane gas concentration by laser absorption spectrometry. The Pan Tilt Unit (PTU) used was a 2 DoF servo drive, which allowed wide spatial domain to the sensors. One methane-gas sample was used to simulate a source of high gas concentration (see Figure 10b, top-left). The gas concentration of the sample exceeded 1,000 ppm-m, considerably above the normal methane-gas concentration in air. The area of inspection was restricted to aperture angles of 50°x50° by placing constraints in the testing room.
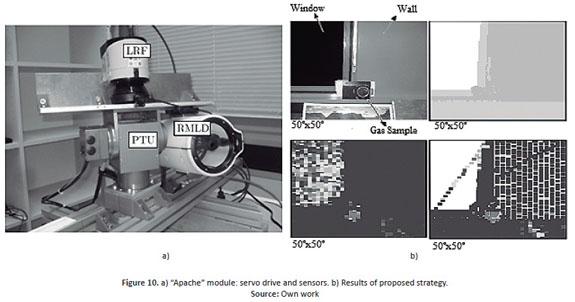
Enhanced results were obtained by using the proposed strategy to generate the scanning path (see Figure 10b). In contrast with the existing raster scan (bottom-left), the scanning paths of the proposed strategy were regionalized. The largest planar surface was segmented; the region described by the window was ignored while remaining regions were not segmented (top-right). Inspection using the proposed strategy (bottom-right) showed a reduction in the time required for the scan of 34.84% for this inspection scene, compared to the standard raster strategy. It is important to emphasize that the gas probe was detected in both scans; this is represented by the red patches. The performance of the strategy depends to a great extent on the effectiveness of the path scan generation process. Besides the segmentation and velocity of the scan, a solution to the traveling salesman problem might influence the total time required to carry it out.
Top-left: digital RGB image of the area of scan; top-right: merged risk probabilities from depth data; bottom-left: image of gas concentration using raster scan (old strategy); bottom-right: image of gas concentration after inspection using proposed strategy.
Integration approach
Where the information about a scene is better than the information provided by a single thermogram (e.g. objects that appear in the visual image but not in the thermogram, may now be visualized in the fused image) fused data obtained from thermographic, visual and depth images can be used as enhanced data, for example for detecting the existence of a gas leak by means of image processing techniques, including segmentation and pattern recognition algorithms. Depth data can also be used for separating pipe information from the background (see Figure 7b). Gas concentration images of the scene can also be obtained from the gas sensor. Such data can be processed and fused with the thermal, visual and depth data, providing more information about the scene. The localization of a gas leak using the risk-based gas concentration scanning strategy can be supported by the thermal-depth data, since geometrical information about the pipe is known. If the result of the image processing process proposed by Kroll, Baetz and Peretzki, D. (2009) is "Leak Detected", then the gas detection is performed in order to confirm the previous result and identify the position of the source of the leak within the industrial workspace. This information, together with the position of the cameras relative to the robot and the position of the robot relative to the plant, can be used to improve the gas leak source localization strategy proposed by Baetz, Kroll and Bonow (2009).
Conclusions and Future Perspectives
The two approaches described in this work have proved to be suitable for gas detection tasks under controlled conditions (lab conditions). However, it is necessary to consider outdoor applications where some variables that it is not possible to control may constrain the performance of the methods, and therefore their reliability. Results concerning the performance of similar approaches under real conditions can be found already in (Bonow & Kroll, 2013).
The velocity of the gas scan performed using the measurement module is constrained by the properties of the RMLD. The response frequency of this device is so low that the construction of a gas image is a time consuming task, which is neither efficient nor reliable. For that reason additional information on the scene can be used to define alternative scanning paths only in regions that represent potential risks. Gas cameras are available on the market but their performance is not comparable to devices that operate according to the TD-LAS principle. Future research should include investigation into "on-line" data fusion algorithm capable of integrating all the onboard sensors (cameras and gas sensor). Although there is no guarantee that this would enhance leak-detection performance, the results obtained when using the two methods described here are encouraging, and full data integration is believed to be the natural step forward.
Acknowledgements
We wish to express our sincere thanks to the Department of Measurement and Control at the University of Kassel, especially to Professor Andreas Kroll, Samuel Soldan, Dipl.-Ing. and Gero Bonow, Dipl.-Ing. for providing us with the inputs, facilities and motivation that were necessary in order to carry out this work.
References
Asus Xtion PRO LIVE. (Online). Downloaded from: http://www.asus.com/de/Multimedia/Xtion_PRO_LIVE/ [ Links ]
Baetz, W., Kroll, A., & Bonow, G. (2009). Mobile robots with active ir-optical sensing for remote gas detection and source localization. Proceedings of the IEEE 9th International Conference on Robotics and Automation, 2773-2778. doi: http://dx.doi.org/10.1109/ROBOT.2009.5152338 [ Links ]
Guan, L. (2010). Face recognition with visible and thermal IR images. (Unpublished masters thesis). Temple University, Philadelphia, United States. [ Links ]
Hermann Sewerin GmBH. (2005). RMLD user's manual. (Online). Retrieved from: http://www.heathus.com/hc/res/InfoCenter/rmld.pdf [ Links ]
Optris PI450 Infrared Camera. (Online). Downloaded from: http://www.optris.de/infrarotkamera-pi400?gclid=Cj0KEQiAvKunBRCfsum9z6fu_5IBEiQAu4lg4tQyXdqjSuLVAYCLu69GWkb_0n7xMM-p5gmL2F8_u4saAvAh8P8HAQ [ Links ]
Jiang, J. & Zhang, X. (2010). Visible and infrared image automatic registration algorithm using mutual information. Proceedings of the Control and Decision Conference, 1322-1325. doi: http://dx.doi.org/10.1109/CCDC.2010.5498181 [ Links ]
Kim, K., Lee, J. & Ra, J. (2005). Robust multi-sensor image registration by enhancing statistical correlation. Proceedings of the IEEE 8th International Conference on Information Fusion, 1, 7. doi: http://dx.doi.org/10.1109/ICIF.2005.1591880 [ Links ]
Kroll, A., Baetz, W. & Peretzki, D. (2009). On autonomous detection of pressured air and gas leaks using passive ir-thermography for mobile robot application. Proceedings of the IEEE 9th International Conference on Robotics and Automation, 921-926. doi: http://dx.doi.org/10.1109/ROBOT.2009.5152337 [ Links ]
Patel, J. R. (2005). Risk based inspection. Proceedings of the Middle East Nondestructive Testing Conference & Exhibition, Bahrain, Manama. 27-30. [ Links ]
Rangel, J., Soldan, S., & Kroll, A. (2014). 3D thermal imaging: Fusion of thermography and depth cameras. International Conference on Quantitative InfraRed Thermography, Bordeaux, France. [ Links ]
Soldan, S. & Kroll, A. (2013). Towards automated gas leak detection using IR gas imaging cameras. Advanced Infrared Technology and Applications (AITA), Turin, Italy, 2013, 195-199. [ Links ]
SpectraSensors Inc. (2011). Tech note: Tunable laser diode spectroscopy (TDLAS). Retrieved from: http://www.ima.co.uk/technical/tdlas principles.pdf [ Links ]
Wikipedia. (2011). Powell's Method. Retrieved from: http://en.wikipedia.org/wiki/Powelrs_method [ Links ]
Yellotec. (2015). Spotting a methane leak (FLIR GF320). (Video). Retrieved from: http://www.youtube.com/watch?v=oL_kBhz8yxw [ Links ]
Zhang, X., Men, T., Liu, C. , & Yang, J. (2010). Infrared and visible images registration using BEMD and MI. Proceedings of the IEEE 3rd International Conference on Computer Science and Information Technology, 3, 644-647. doi: http://dx.doi.org/10.1109/ICCSIT.2010.5564849 [ Links ]
Zhang, Z. (2000). A flexible new technique for camera calibration. IEEE Transactions on Pattern Analysis and Machine Intelligence 22(11), 1330-1334. [ Links ]
Zitova, B. & Flusser, J. (2003). Image registration methods: A survey. Image and Vision Computing 21(11), 997-1000. [ Links ]

